

Abstract
Objectives:
Previous community-based studies have failed to demonstrate an independent association between OSA and circulating cardiac troponin concentrations, a marker of myocardial injury. However, these studies have used troponin assays with modest analytic sensitivity to detect low-level, chronic increments in troponin levels. Using a highly sensitive troponin I (hs-TnI) assay, we tested the hypothesis that the severity of OSA is associated with myocardial injury independently of comorbidities.
Design:
Cross-sectional study.
Setting:
Community-based.
Participants:
514 subjects (54% men, age 48 ± 11 y [mean ± SD]).
Interventions:
N/A.
Measurements and Results:
hs-TnI concentrations were measured in fasting morning blood samples and 318 participants (62%) had hs-TnI concentration above the limit of detection ([LoD] 1.2 ng/L). The severity of OSA, expressed as the apnea-hypopnea index (AHI) and nocturnal hypoxemia, was assessed by in-hospital polysomnography. After adjustment for age, gender, estimated creatinine clearance, history of coronary artery disease and hypertension, smoking, diabetes mellitus, systolic blood pressure, heart rate, body mass index, left ventricular hypertrophy, and cholesterol ratio in multivariate linear regression models, higher AHI (standardized β = 0.12, P = 0.006), lower mean SpO2 (β = -0.13, P = 0.012) and higher percentage of total sleep time with SpO2 < 90% (β = 0.12, P = 0.011) were all associated with higher hs-TnI levels in separate models. Additional analyses with hs-TnI categorized in tertiles or using a different strategy for persons with hs-TnI levels below the LoD did not change the results.
Conclusion:
Increased obstructive sleep apnea (OSA) severity is independently associated with higher concentrations of hs-TnI, suggesting that frequent apneas or hypoxemia in OSA may cause low-grade myocardial injury.
Citation:
Einvik G, Røsjø H, Randby A, Namtvedt SK, Hrubos-Strøm H, Brynildsen J, Somers VK, Omland T. Severity of obstructive sleep apnea is associated with cardiac troponin I concentrations in a community-based sample: data from the Akershus Sleep Apnea Project. SLEEP 2014;37(6):1111-1116.
Keywords: obstructive sleep apnea, troponin I, polysomnography, Akershus Sleep Apnea Project
INTRODUCTION
Obstructive sleep apnea (OSA) is a common disorder characterized by hypopneas and apneas, which will result in both hypoxemia and sympathetic arousals.1,2 OSA has been linked to myocardial dysfunction, and patients with OSA are at increased risk of cardiovascular disease (CVD).3–6 However, given the close associations between OSA and other CV risk factors like obesity, arterial hypertension and metabolic dysregulation,7 it has not been fully established whether OSA is an independent risk factor for CVD.8 Thus, the association between OSA and CVD may only be due to a clustering of CV risk factors in patients with OSA and a not a consequence of OSA per se.9
Assays that quantify circulating concentrations of cardiac troponin (Tn) I and T are currently in clinical use as markers of myocardial injury. As low-level increments in troponin concentrations may represent an early signal of subtle myocardial injury, several groups have previously tested whether troponin concentrations are increased in proportion to the severity of OSA.10–17 However, most of these studies have been performed using troponin assays with limited sensitivity in the lower range, and thus a low proportion of the patients with OSA had measurable troponin concentrations.10–14 In 2012, we hypothesized that by using the commercially available highly sensitive TnT (hs-TnT) assay (Roche Diagnostics, Penzberg, Germany), we would be able to demonstrate an independent association between OSA and troponin concentrations. Although we did demonstrate an association between OSA severity and hs-TnT, this was not significant when adjusting for CV risk factors.15 Importantly, much to our surprise, only 28% of our cohort recruited in the general population was found to have hs-TnT concentrations above the limit of detection (LoD). In two other studies using the same assay, patients with comorbid heart failure or coronary artery disease (CAD) showed detectable levels of hs-TnT increasing with OSA severity,16,17 but the relevance of these findings for individuals in the general population is unclear. We recently got access to a hs-TnI assay (Abbott Diagnostics, Abbott Park, IL) with superior low-range sensitivity compared to the hs-TnT assay.18 In addition, the smaller molecular size of TnI vs. TnT may have consequences for the release characteristics of these biomarkers.19,20 Since the hs-TnI assay may represent a superior tool to detect the troponin signal associated with the hypothesized low-grade myocardial injury in OSA, we decided to re-analyze the samples from our cohort with the new hs-TnI assay. Accordingly, in this study we wanted to assess whether there is an association between the severity of OSA and myocardial injury, as measured by hs-TnI, independent of the comorbidities generally found in persons with OSA.
METHODS
Study Design
The Akershus Sleep Apnea Project is a two-phase epidemiological study investigating risk factors of OSA in adults in the South-Eastern region of Norway. The design and methods of the study have previously been reported.21 In the first phase, 30,000 persons randomly drawn from the National Population Register received a questionnaire by mail, including the Berlin Questionnaire (BQ).22 The BQ consists of 10 items within 3 symptom categories (snoring, sleepiness, hypertension/obesity); persons with significant symptoms in ≥ 2 categories were considered to be at high risk for OSA. A total of 16,302 persons (55.7%) responded. In the second phase, 1,350 persons were selected among the responders to be contacted by phone and invited to a clinical study. This selection was performed as a random draw within prespecified strata. We performed oversampling of persons regarded as high-risk persons for OSA according to the BQ. In addition, oversampling of persons with a history of established CVD, diabetes mellitus, or previous otitis media surgery was performed. Among the 1,350 selected, 202 were not reached by telephone, 585 declined the invitation, and 28 were excluded due to physical impairments, use of continuous positive airways pressure devices, lack of fluent Norwegian language, or pregnancy (Figure 1). Hence, the clinical cohort comprised of 535 participants (46.7% of the selected) who attended a one-night stay at Akershus University Hospital for the examinations. The final sample consisted of 378 BQ high risk persons and 157 BQ low risk persons. Thus, the ratio of OSA high-to-low risk in the clinical sample was 2.4:1.
Figure 1.
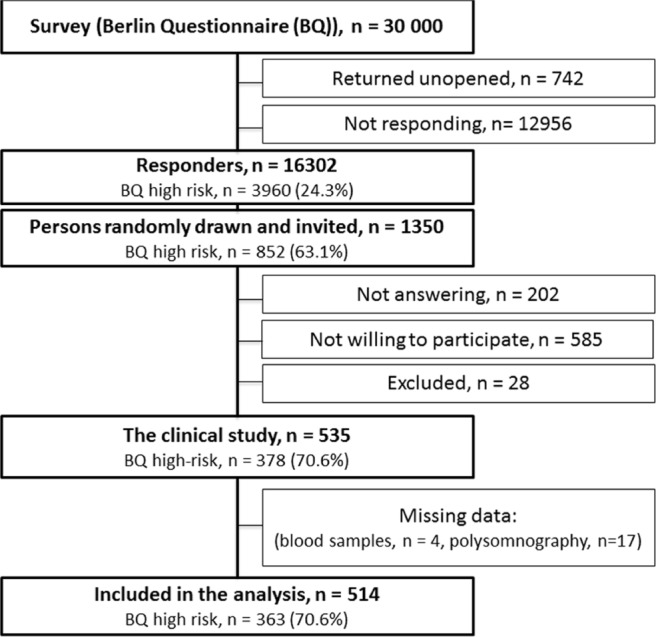
Flow chart of the study
The study was performed according to the Declaration of Helsinki, approved by the Regional Medical Ethics Committee (2011/2421), and all participants provided written informed consent prior to study commencement.
Demographic Variables and Cardiovascular Risk Factors
All participants were interviewed regarding history of CAD (myocardial infarction or coronary artery revascularization), diabetes mellitus (use of anti-diabetic drugs or fasting glucose ≥ 7), hypertension (use of antihypertensives), and current smoking habits. Blood pressure was measured by a standard protocol after 15 minutes of rest in a sitting position and calculated as the mean of the last 2 of 3 measurements. Weight and height were measured and body mass index was calculated by weight (kg)/height (m)2.
Sleep Registration
All participants underwent an in-hospital polysomnography (sleep length 5.9 ± 1.2 h [mean ± SD]), in which the registrations were analyzed with the Somnologica 3.2 software package (Flaga-Medcare, Buffalo, NY) and scored according to the Rechtschaffen and Kales manual by two US certified technicians.23 The severity of OSA was evaluated by (i) the apneahypopnea index (AHI) and (ii) the peripheral oxygen saturation (SpO2). AHI was calculated as the mean number of apneas and hypopneas per hour of sleep according to the recommendations of the American Academy of Sleep Medicine,24 and participants categorized according to standardized criteria as having no OSA (AHI < 5), mild/moderate OSA (AHI 5-29.9), or severe OSA (AHI ≥ 30). SpO2 was measured by a finger plethysmograph (Nonin, Plymouth, MN), and the nadir SpO2, mean SpO2 and fraction of total sleep time with SpO2 < 90% were recorded after all results had been manually checked for technical artifacts. The AHI and SpO2 were missing from 17 persons due to technical failure of the polysomnography or insufficient duration of sleep.
Blood Sampling and Troponin Analyses
Venous blood was sampled in a fasting state in the morning after the polysomnography. The samples were fractionized within one hour, and serum and plasma frozen at −20°C for maximum 14 days, before being transported to the central biobank and stored at −80°C pending analysis. None of the samples were thawed prior to being analyzed. Serum hs-TnI was analyzed with the prototype ARCHITECT STAT High Sensitivity Troponin assay (Abbott Diagnostics). The characteristics of the assay and the analytical variation of the assay in our laboratory have previously been reported,18 and the 99th percentile concentrations are 15.6 ng/L in females and 34.2 ng/L in males.25 Creatinine, glucose, and blood lipids were measured by standard methods, and we calculated estimated creatinine clearance by the Cockcroft-Gault formula.26
Electrocardiographic Data
A resting 12-lead electrocardiogram was digitally recorded, and evidence of left ventricular hypertrophy (LVH) was assessed by the Sokolow-Lyon voltage criteria and the Cornell voltage-duration criteria.27,28 The average heart rate was registered before, during, and after sleep by a Holter monitor.
Statistics
Continuous variables were tested for normality by the Kolmogorov-Smirnov test, and hs-TnI levels were transformed by the natural logarithm due to a right-skewed distribution before one-way analysis of variance and regression analyses. The models did not compromise the basic principles of linear regression analysis, as the standardized residuals were normally distributed. Participants with hs-TnI concentration below the LoD (1.2 ng/L)25 were assigned a concentration of 1.2 ng/L, which is the strategy previously used by our group and also recommended in the literature.18,29–31 However, we acknowledge that other approaches have also been employed for subjects with levels below the LoD, including the use of a concentration 50% lower than the LoD for undetectable levels.32 Hence, to account for possible influence to our results by participants with levels below LoD, we have also performed analyses where these persons were assigned a concentration of 0.6 ng/L. An additional strategy may be to divide participants into categories based on hs-TnI levels, and we have also performed analyses with patients divided into tertiles based on hs-TnI levels. The associations between OSA and demographic or clinical variables were evaluated with Student t-test or Mann-Whitney U test for comparisons between participants with and without OSA. One-way analysis of variance was used to evaluate the bivariate association between the hs-TnI concentration and OSA severity. Correlation coefficients were calculated by the Spearman rank method. We performed linear regression analyses to evaluate the univariate and multivariate associations between concentrations of hs-TnI and OSA severity, with the covariates age, gender, current smoking, history of CAD, history of hypertension, diabetes mellitus, systolic blood pressure, average heart rate, body mass index, total cholesterol-to-HDL cholesterol ratio, estimated creatinine clearance, and LVH. OSA severity was assessed with AHI, nadir and mean SpO2 and fraction of total sleep time with SpO2 below 90% in separate models. Although hypertension, CAD and LVH are known to be associated with OSA, these conditions are of multifactorial etiology, including a strong genetic susceptibility, and thus cannot be attributed to OSA alone.9 Accordingly, by including hypertension, CAD, and LVH as confounders in our multivariate linear regression models, we performed analyses that adjust for the clustering of CV risk factors in subjects with OSA. Due to previous observations of gender differences in cardiovascular outcomes in OSA,4,8 we have also performed secondary analyses with participants stratified by gender. A P value < 0.05 was considered statistically significant in the final models. We used SPSS 20.0 (IBM, Chicago, IL) for all analyses.
RESULTS
Study Sample
The participants in the clinical phase of the study differed from the non-participants by gender and by a slightly higher prevalence of BQ high-risk status (Table S1, supplemental material). Characteristics of the participants according to presence of OSA are presented in Table 1. Participants with OSA were older, had higher systolic blood pressure, BMI, and cholesterol ratio, and higher prevalence of CVD and diabetes mellitus than the other study participants. A total of 142 persons (27.6%) reported hypertension on the BQ (item 9). Among these, 61 persons (11.9%) were categorized as BQ high-risk due to the presence of self-reported hypertension. In contrast, 391 (76.1%) and 272 (52.9%) reported significant snoring or sleepiness, respectively; thus these variables were the predominant causes for BQ high-risk status in our study.
Table 1.
Demographic and clinical characteristics according to OSA status

Distribution of Troponin I Concentrations
In total, 318 participants (61.9%) had hs-TnI concentrations over the LoD (1.2 ng/L) in our study. The median (5, 95 percentile) hs-TnI concentration was 1.5 (undetectable, 8.6) ng/L. Five participants (1.0%, 2 males) had hs-TnI above the gender-specific 99th percentile reported for the hs-TnI assay. The correlation coefficient between hs-TnI and hs-TnT among participants with both hs-TnI and hs-TnT concentrations over the LoD (n = 119) was 0.15 (P = 0.11). hs-TnI concentration increased significantly in proportion to the severity of OSA with median hs-TnI concentrations being undetectable in participants without OSA, 1.7 ng/L in participants with mild/moderate OSA (AHI 5-30), and 2.7 ng/L in participants with severe OSA (AHI > 30) (P < 0.001, Figure 2).
Figure 2.
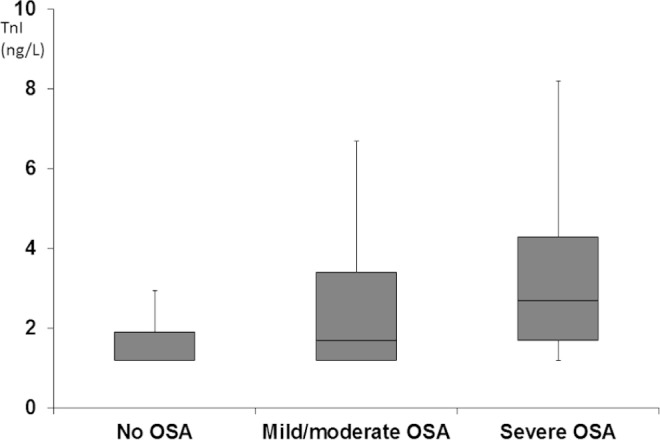
hs-TnI concentration (ng/L) according to the severity of OSA. The black horizontal line within the box represents the median level, the boundaries of the box the 25th and 75th percentile levels, and the whiskers the 5th and 95th percentile.
Determinants of Troponin I Concentrations
Several factors were associated with hs-TnI concentrations by univariate analyses (Table S2, supplemental material). Most variables, including AHI and fraction of total sleep time below SpO2 90%, were positively associated with higher concentration of hs-TnI, while current smoking, estimated creatinine clearance, and nadir and mean SpO2 showed inverse associations with hs-TnI. In multivariate linear regression analysis, higher age and systolic blood pressure, male gender, history of CAD, and lower estimated creatinine clearance were significantly associated with increasing hs-TnI concentrations (Table 2). In separate models increasing AHI and fraction of total sleep time with SpO2 below 90% as well as decreasing mean and nadir SpO2 (Table 2, model 1-4) were independently associated with increasing hs-TnI.
Table 2.
Significant predictors of hs-TnI in multivariate linear regression analyses with different measures of OSA severity

Stratifying participants by gender in secondary analyses, the association between AHI and hs-TnI in the multivariate regression analysis appeared to be stronger in men than in women (Table S3, supplemental material), but adding an interaction term (gender × AHI) in the main model did not show statistical significance (P = 0.58).
Independent associations between severity of OSA and higher hs-TnI levels were also demonstrated when participants with hs-TnI below the LoD were assigned a hs-TnI level of 50% below the LoD (Table S4, supplemental material) and when participants were divided into tertiles based on hs-TnI levels (Table S5, supplemental material). To assess the possible bias introduced by oversampling of persons with hypertension, we also performed additional analyses excluding participants with self-reported hypertension (BQ item 9 positive). We still found an independent association between AHI and hs-TnI levels (Table S6, supplemental material).
DISCUSSION
The main finding of the present study is that the severity of OSA, as measured by AHI or peripheral oxygen desaturation, is independently associated with higher concentrations of hs-TnI, a biomarker of myocardial injury, among subjects recruited from the general population.
This is the first study reporting an independent association between indices of OSA severity and circulating TnI. Previously, Oktay et al., using a less sensitive assay, measured TnI concentrations in 54 patients with OSA and 19 healthy individuals and found no difference.11 Likewise, Cifci et al. did not find measureable TnI concentrations in patients with OSA, neither prior to nor after treatment with continuous positive airway pressure.13 We recently demonstrated a significant association between increasing severity of OSA and the prevalence of detectable hs-TnT in the current population, but this association was attenuated and no longer significant after adjusting for CV risk factors.15 Inami et al. and Yoshihisa et al., in studies of patients with stable CAD and heart failure, respectively, observed higher concentrations of hs-TnT than in the present study and reported independent associations between AHI and hs-TnT.16,17 However, as these studies were performed in patients with established CVD, the results cannot be extrapolated to the general population. Our study differs from previous studies in several aspects, including the larger number of participants, the recruitment of subjects from the general population, and most importantly, the use of the hs-TnI assay. The increased sensitivity of the hs-TnI assay enhances the signal to noise ratio, providing a more accurate reflection of actual cardiac troponin release than assays with lower sensitivity. In addition, the higher number of participants with measureable concentration increases the statistical power of the hs-TnI assay to detect a true relationship and reduces the likelihood of a type II error. Moreover, recent data suggest that there may be differences in factors influencing hs-TnI and hs-TnT concentrations, which may also contribute to the observed independent association between the severity of OSA and hs-TnI, but not hs-TnT concentrations.30–32 We believe that this is partially due to the different sensitivity and low-range analytical precision of the assays, but it could also be due to true biological differences. The notion that low-level, chronic elevation of cardiac troponins may reflect different pathophysiologic mechanisms is supported by both current data showing lack of correlation and recent data from other patient cohorts. Previous reports examining the hs-TnT and hs-TnI assays head-to-head in patients with suspected and stable CAD have demonstrated moderate correlations between hs-TnT and hs-TnI levels.18,31 Furthermore, determinants of hs-TnT and hs-TnI levels seem to differ somewhat in patients with suspected or stable CAD. The rationale for these differences may relate to the smaller size of troponin I (∼26 kDa) compared to the troponin T molecule (37-39 kDa) and to potential differences in the release characteristics and clearance of Tn I and T. Furthermore, while the secondary analyses suggested that the association between AHI and hs-TnI concentration may be stronger in males, there was no significant interaction by gender in the final model. Characteristics of the sample, including the prevalence of comorbidities may explain this finding. Whether there are true differences according to gender and subclass (T vs. I) in troponin release in OSA, will require additional studies. However, very recent work has shown an independent association between high hs-TnT levels and OSA severity33; thus the differences between hs-TnI and hs-TnT results in our study could partly be related to the specific characteristics of the cohorts.
The cross-sectional design of the present study precludes drawing of inferences concerning causal mechanisms underlying the association between OSA and troponin release. Our results do not bring evidence for any particular mechanism for low-grade myocardial injury in OSA. Chronic low-level release of troponin as measured by hs Tn-assays has also previously been noted in patients with stable CAD,34 patients with suspected reversible myocardial ischemia,18 and in subjects from the general population.35 In the present study none of the participants reported prior heart failure, no participant reported current symptoms of unstable CAD, and conventional CV risk factors were adjusted for. One mechanism for troponin release in OSA may be a result of repetitive arousals and sympathetic hyperactivity. Also, there is an independent association between AHI and endothelial dysfunction,36 which could influence coronary epicardial arteries and lead to chronic, low-level cardiomyocyte death and subsequent troponin release. However, to establish the exact mechanism for the troponin release in OSA, more experimental and longitudinal clinical studies are needed.
A potential limitation of the study is the slight oversampling of men and BQ high-risk persons for the clinical examination. However, as our study is community-based, we believe this selection bias is modest compared to most other hospital-based OSA studies, and we also found other demographic variables to be evenly distributed among study participants and non-participants. Another limitation of this study is the lack of echocardiographic or other imaging data, but given the relatively young age of the study population and the fact that all participants were subjected to a thorough clinical examination, we believe that the prevalence of participants with overt myocardial dysfunction is likely to be low. We also included electrocardiographic signs of LVH as a covariable in the analyses.
In conclusion, we have demonstrated that the severity of OSA, expressed as AHI or oxygen desaturation, is independently associated with higher hs-TnI concentration in a community-based sample. These results support the theory that repetitive episodes of apnea and hypopnea may have detrimental effects on myocardial structure and function independent of other CV risk factors, which may explain at least some of the increased risk of myocardial dysfunction and heart failure in patients with OSA.
DISCLOSURE STATEMENT
The Akershus Sleep Apnea Project was supported by the South-Eastern Norway Regional Health Authority (grant number 2004219, 2007048) and the University of Oslo. Abbott Diagnostics has provided the reagents for hs-TnI analysis. The sponsors played no role in any of the following: design and conduct of the study, collection, management, analysis and interpretation of the data, or preparation, review and approval of the manuscript. The study was conducted at Akershus University Hospital. Dr. Omland has received speaker honoraria from Abbott Diagnostics and Roche Diagnostics. Dr. Somers has served as a consultant for ResMed, Sova Pharmaceuticals, Apnex Medical, Johnson and Johnson, Merck, Respicardia, Neu Pro, and Cardiac Concepts. He works with Mayo Health Solutions and their Industry partners on intellectual property related to sleep and cardiovascular disease, and he has received research grants from the Phillips-Respironics Sleep and Breathing Foundation, ELA Medical, and Select Research, Inc. The other authors declare no personal conflict of interest.
ACKNOWLEDGMENTS
Drs. Einvik and Røsjø contributed equally to this work. The authors acknowledge the expert contribution by Marit Jørgensen, BSc, Division of Medicine and Department of Clinical Molecular Biology, Akershus University Hospital, Lørenskog, Norway for performing the hs-TnI analyses.
SUPPLEMENTAL MATERIAL
Comparisons of clinical variables between participants and non-participants in Akershus Sleep Apnea Project
Univariate predictors of hs-TnI concentration
Significant predictors of hs-TnI in multivariate linear regression analyses as stratified by gender
Multivariate model with hs-TnI as the dependent variable and where participants with hs-TnI levels below the limit of detection were assigned a concentration of 0.6 ng/L.
Multivariate nominal logistic regression with tertiles of hs-TnI as the dependent variable
Significant predictors of hs-TnI in multivariate linear regression analyses with different measures of OSA severity among persons without preexisting hypertension (BQ-item 9 = no) (n = 372)
REFERENCE
- 1.Jennum P, Riha RL. Epidemiology of sleep apnoea/hypopnoea syndrome and sleep-disordered breathing. Eur Resp J. 2009;33:907–14. doi: 10.1183/09031936.00180108. [DOI] [PubMed] [Google Scholar]
- 2.Somers VK, White DP, Amin R, et al. Sleep Apnea and cardiovascular disease. An American Heart Association/American College of Cardiology Foundation Scientific Statement From the American Heart Association Council for High Blood Pressure Research Professional Education Committee, Council on Clinical Cardiology, Stroke Council, and Council on Cardiovascular Nursing Council. Circulation. 2008;118:1080–111. doi: 10.1161/CIRCULATIONAHA.107.189375. [DOI] [PubMed] [Google Scholar]
- 3.Baguet JP, Barone-Rochette G, Levy P. Left ventricular diastolic dysfunction is linked to severity of obstructive sleep apnoea. Eur Resp J. 2010;36:1323–9. doi: 10.1183/09031936.00165709. [DOI] [PubMed] [Google Scholar]
- 4.Gottlieb DJ, Yenokyan G, Newman AB, et al. Prospective study of obstructive sleep apnea and incident coronary heart disease and heart failure: the sleep heart health study. Circulation. 2010;122:352–60. doi: 10.1161/CIRCULATIONAHA.109.901801. [DOI] [PMC free article] [PubMed] [Google Scholar]
- 5.Kohli P, Balachandran JS, Malhotra A. Obstructive sleep apnea and the risk for cardiovascular disease. Curr Atheroscler Rep. 2011;13:138–46. doi: 10.1007/s11883-011-0161-8. [DOI] [PMC free article] [PubMed] [Google Scholar]
- 6.Kasai T, Bradley TD. Obstructive sleep apnea and heart failure: pathophysiologic and therapeutic implications. J Am Coll Cardiol. 2011;57:119–27. doi: 10.1016/j.jacc.2010.08.627. [DOI] [PubMed] [Google Scholar]
- 7.Lurie A. Metabolic disorders associated with obstructive sleep apnea in adults. Adv Cardiol. 2011;46:67–138. doi: 10.1159/000325106. [DOI] [PubMed] [Google Scholar]
- 8.Sánchez-de-la-Torre M, Campos-Rodriguez F, Barbé F. Obstructive sleep apnoea and cardiovascular disease. Lancet Resp Med. 2013;1:61–72. doi: 10.1016/S2213-2600(12)70051-6. [DOI] [PubMed] [Google Scholar]
- 9.Lurie A. Cardiovascular disorders associated with obstructive sleep apnea. Adv Cardiol. 2012;46:197–266. doi: 10.1159/000325110. [DOI] [PubMed] [Google Scholar]
- 10.Gami AS, Svatikova A, Wolk R, et al. Cardiac troponin T in obstructive sleep apnea. Chest. 2004;125:2097–100. doi: 10.1378/chest.125.6.2097. [DOI] [PubMed] [Google Scholar]
- 11.Oktay B, Akbal E, Firat H, Ardic S, Akdemir R, Kizilgun M. Evaluation of the relationship between heart type fatty acid binding protein levels and the risk of cardiac damage in patients with obstructive sleep apnea syndrome. Sleep Breath. 2008;12:223–8. doi: 10.1007/s11325-007-0167-1. [DOI] [PubMed] [Google Scholar]
- 12.Koehnlein T, Schmidt A, Moesenthin M, Dierkes J, Neumann KH, Welte T. Increased cardiac troponin T and C-reactive protein levels in end-stage renal disease are associated with obstructive sleep apnea. Clin Nephrol. 2009;71:50–8. doi: 10.5414/cnp71050. [DOI] [PubMed] [Google Scholar]
- 13.Cifci N, Uyar M, Elbek O, Suyur H, Ekinci E. Impact of CPAP treatment on cardiac biomarkers and pro-BNP in obstructive sleep apnea syndrome. Sleep Breath. 2010;14:241–4. doi: 10.1007/s11325-009-0306-y. [DOI] [PubMed] [Google Scholar]
- 14.Colish J, Walker JR, Elmayergi N, et al. Obstructive sleep apnea: Effects of continuous positive airway pressure on cardiac remodeling as assessed by cardiac biomarkers, echocardiography, and cardiac MRI. Chest. 2012;141:674–81. doi: 10.1378/chest.11-0615. [DOI] [PubMed] [Google Scholar]
- 15.Randby A, Namtvedt SK, Einvik G, et al. Obstructive sleep apnea is associated with increased high-sensitivity cardiac troponin T levels. Chest. 2012;142:639–46. doi: 10.1378/chest.11-1779. [DOI] [PubMed] [Google Scholar]
- 16.Inami T, Seino Y, Otsuka T, et al. Links between sleep disordered breathing, coronary atherosclerotic burden, and cardiac biomarkers in patients with stable coronary artery disease. J Cardiol. 2012;60:180–6. doi: 10.1016/j.jjcc.2012.03.003. [DOI] [PubMed] [Google Scholar]
- 17.Yoshihisa A, Suzuki S, Yamaki T, et al. Impact of adaptive servo-ventilation on cardiovascular function and prognosis in heart failure patients with preserved left ventricular ejection fraction and sleep-disordered breathing. Eur J Heart Fail. 2013;15:543–50. doi: 10.1093/eurjhf/hfs197. [DOI] [PubMed] [Google Scholar]
- 18.Røsjø H, Kravdal G, Høiseth AD, et al. Troponin I measured by a high-sensitivity assay in patients with suspected reversible myocardial ischemia: data from the Akershus Cardiac Examination (ACE) 1 Study. Clin Chem. 2012;58:1565–73. doi: 10.1373/clinchem.2012.190868. [DOI] [PubMed] [Google Scholar]
- 19.Jaffe AS, Vasile VC, Milone M, Saenger AK, Olson KN, Apple FS. Diseased skeletal muscle: a noncardiac source of increased circulating concentrations of cardiac troponin T. J Am Coll Cardiol. 2011;58:1819–24. doi: 10.1016/j.jacc.2011.08.026. [DOI] [PubMed] [Google Scholar]
- 20.Labugger R, Organ L, Collier C, Atar D, Van Eyk JE. Extensive troponin I and T modification detected in serum from patients with acute myocardial infarction. Circulation. 2000;102:1221–6. doi: 10.1161/01.cir.102.11.1221. [DOI] [PubMed] [Google Scholar]
- 21.Hrubos-Str›m H, Randby A, Namtvedt SK, et al. A Norwegian population-based study on the risk and prevalence of obstructive sleep apnea: The Akershus Sleep Apnea Project (ASAP) J Sleep Res. 2011;20:162–70. doi: 10.1111/j.1365-2869.2010.00861.x. [DOI] [PubMed] [Google Scholar]
- 22.Netzer NC, Stoohs RA, Netzer CM, Clark K, Strohl KP. Using the Berlin Questionnaire to identify patients at risk for the sleep apnea syndrome. Ann Intern Med. 1999;131:485–91. doi: 10.7326/0003-4819-131-7-199910050-00002. [DOI] [PubMed] [Google Scholar]
- 23.Rechtshaffen A, Kales A. Los Angeles, CA: University of California at Los Angeles, Brain Information Service/Brain Research Institute; 1968. A manual of standardized terminology and scoring system for sleep stages of human sleep. [Google Scholar]
- 24.American Academy of Sleep Medicine. 2nd ed. Westchester, IL: American Academy of Sleep Medicine; 2005. International classification of sleep disorders: diagnostic and coding manual. [Google Scholar]
- 25.Apple FS, Ler R, Murakami MM. Determination of 19 cardiac troponin I and T assay 99th percentile values from a common presumably healthy population. Clin Chem. 2012;58:1574–81. doi: 10.1373/clinchem.2012.192716. [DOI] [PubMed] [Google Scholar]
- 26.Cockcroft DW, Gault MH. Prediction of creatinine clearance from serum creatinine. Nephron. 1976;16:31–41. doi: 10.1159/000180580. [DOI] [PubMed] [Google Scholar]
- 27.Sokolow M, Lyon K. The ventricular complex in left ventricular hypertrophy as obtained by unipolar precordial and limb leads. Am J Cardiol. 1949;37:161–9. doi: 10.1016/0002-8703(49)90562-1. [DOI] [PubMed] [Google Scholar]
- 28.Casale PN, Devereux RB, Kligfield P, et al. Electrocardiographic detection of left ventricular hypertrophy: development and prospective validation of improved criteria. J Am Coll Cardiol. 1985;6:572–80. doi: 10.1016/s0735-1097(85)80115-7. [DOI] [PubMed] [Google Scholar]
- 29.R›ysland R, Kravdal G, H›iseth AD, et al. Cardiac troponin T levels and exercise stress testing in patients with suspected coronary artery disease: the Akershus Cardiac Examination (ACE) 1 study. Clin Sci. 2012;122:599–606. doi: 10.1042/CS20110557. [DOI] [PMC free article] [PubMed] [Google Scholar]
- 30.White HD. Pathobiology of troponin elevations: do elevations occur with myocardial ischemia as well as necrosis? J Am Coll Cardiol. 2011;57:2406–8. doi: 10.1016/j.jacc.2011.01.029. [DOI] [PubMed] [Google Scholar]
- 31.Omland T, Pfeffer MA, Solomon SD, et al. Prognostic value of cardiac troponin I measured with a highly sensitive assay in patients with stable coronary artery disease. J Am Coll Cardiol. 2013;61:1240–9. doi: 10.1016/j.jacc.2012.12.026. [DOI] [PubMed] [Google Scholar]
- 32.Turer AT, Addo TA, Martin JL, et al. Myocardial ischemia induced by rapid atrial pacing causes troponin T release detectable by a highly sensitive assay: insights from a coronary sinus sampling study. J Am Coll Cardiol. 2011;57:2398–405. doi: 10.1016/j.jacc.2010.11.066. [DOI] [PMC free article] [PubMed] [Google Scholar]
- 33.Querejeta Roca G, Redline S, Punjabi N, et al. Sleep apnea is associated with subclinical myocardial injury in the community: the ARIC-SHHS study. Am J Respir Crit Care Med. 2013;188:1460–5. doi: 10.1164/rccm.201309-1572OC. [DOI] [PMC free article] [PubMed] [Google Scholar]
- 34.Omland T, de Lemos JA, Sabatine MS, et al. A sensitive cardiac troponin T assay in stable coronary artery disease. N Engl J Med. 2009;361:2538–47. doi: 10.1056/NEJMoa0805299. [DOI] [PMC free article] [PubMed] [Google Scholar]
- 35.de Lemos JA, Drazner MH, Omland T, et al. Association of troponin T detected with a highly sensitive assay and cardiac structure and mortality risk in the general population. JAMA. 2010;304:2503–12. doi: 10.1001/jama.2010.1768. [DOI] [PMC free article] [PubMed] [Google Scholar]
- 36.Namtvedt SK, Hisdal J, Randby A, et al. Impaired endothelial function in persons with obstructive sleep apnoea: impact of obesity. Heart. 2013;99:30–4. doi: 10.1136/heartjnl-2012-303009. [DOI] [PubMed] [Google Scholar]
Associated Data
This section collects any data citations, data availability statements, or supplementary materials included in this article.
Supplementary Materials
Comparisons of clinical variables between participants and non-participants in Akershus Sleep Apnea Project
Univariate predictors of hs-TnI concentration
Significant predictors of hs-TnI in multivariate linear regression analyses as stratified by gender
Multivariate model with hs-TnI as the dependent variable and where participants with hs-TnI levels below the limit of detection were assigned a concentration of 0.6 ng/L.
Multivariate nominal logistic regression with tertiles of hs-TnI as the dependent variable
Significant predictors of hs-TnI in multivariate linear regression analyses with different measures of OSA severity among persons without preexisting hypertension (BQ-item 9 = no) (n = 372)