Figure 3.

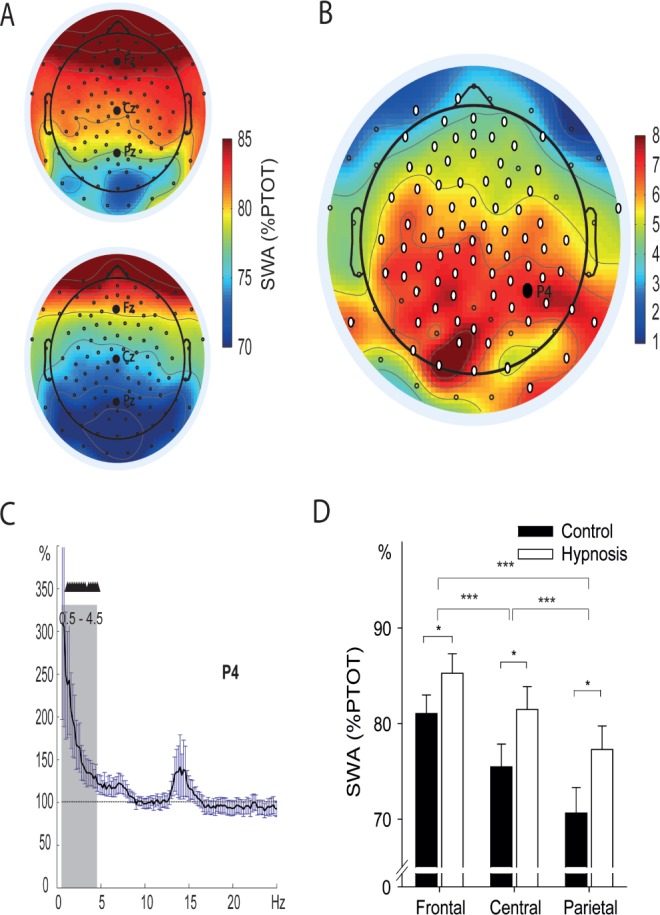
Changes in slow wave activity (SWA) after hypnosis and control conditions in experiment 1. (A) Topographical distribution of SWA (0.5–4.5Hz) during nonrapid eye movement (NREM) sleep after listening to the hypnotic suggestion (upper panel) and the control text (lower panel). SWA is indicated as percent of total power (% PTOT; 0.5–50 Hz). Black dots represent electrode positions of the 128-channel electroencephalography (EEG) cap. (B) Topographical distribution of the difference of SWA %PTOT between hypnosis and control condition. White dots represent significant differences between the conditions, indicating a widespread increase in SWA during NREM sleep after the hypnotic suggestion “to sleep deeper”. (C) Representative spectrogram of electrode P4. Black triangles indicate significant increases (P < 0.05) in SWA after hypnosis as compared to the control condition, which are highly specific for SWA (gray area). Mean increases ± standard error of the mean (SEM) are indicated for the hypnosis condition, with the control condition set to 100% (dotted line). (D) Averaged SWA over three topographical regions (frontal, central, parietal, see supplemental material), for the hypnosis and control conditions. SWA is significantly increased after hypnosis as compared to the control condition (P < 0.03), and the effect is stronger over central and parietal as compared to frontal regions (interaction type of text * topography: P = 0.03). Means ± SEM are indicated. * P ≤ 0.05; *** P ≤ 0.001, for post hoc contrasts.
