

Increased ER stress and reactive oxygen species are the salient features of end-stage liver diseases. Here, Wu et al. discovered that the XBP1–Hrd1 arm of the ER stress pathway is up-regulated while the Nrf2-mediated antioxidant response pathway is down-regulated in human cirrhotic liver. They identified Hrd1 as a novel E3 ubiquitin ligase that controls Nrf2, and targeting Hrd1 preserved the Nrf2 protective response. This study highlights the pathological importance of the convergence of ER and the oxidative stress response pathway in liver cirrhosis.
Keywords: Nrf2, Hrd1, liver cirrhosis
Abstract
Increased endoplasmic reticulum (ER) stress and reactive oxygen species (ROS) are the salient features of end-stage liver diseases. Using liver tissues from liver cirrhosis patients, we observed up-regulation of the XBP1–Hrd1 arm of the ER stress response pathway and down-regulation of the Nrf2-mediated antioxidant response pathway. We further confirmed this negative regulation of Nrf2 by Hrd1 using Hrd1 conditional knockout mice. Down-regulation of Nrf2 was a surprising result, since the high levels of ROS should have inactivated Keap1, the primary ubiquitin ligase regulating Nrf2 levels. Here, we identified Hrd1 as a novel E3 ubiquitin ligase responsible for compromised Nrf2 response during liver cirrhosis. In cirrhotic livers, activation of the XBP1–Hrd1 arm of ER stress transcriptionally up-regulated Hrd1, resulting in enhanced Nrf2 ubiquitylation and degradation and attenuation of the Nrf2 signaling pathway. Our study reveals not only the convergence of ER and oxidative stress response pathways but also the pathological importance of this cross-talk in liver cirrhosis. Finally, we showed the therapeutic importance of targeting Hrd1, rather than Keap1, to prevent Nrf2 loss and suppress liver cirrhosis.
Liver cirrhosis is a pathological state in which the normal liver tissue is replaced with scar tissue. Most commonly, liver cirrhosis is caused by alcohol consumption, viral hepatitis, chronic or excessive drug use, or exposure to hepatotoxic chemicals (Lotersztajn et al. 2005; Hernandez-Gea and Friedman 2011; Wynn and Ramalingam 2012). Currently, there are no effective treatments available to prevent or suppress the pathogenesis of liver cirrhosis. Therefore, understanding the molecular mechanisms underlying the pathological progression of liver cirrhosis and developing new therapeutic strategies for prevention or reversal of liver cirrhosis are urgently needed.
Studies suggest the involvement of endoplasmic reticulum (ER) stress in the pathogenesis of liver cirrhosis. Using experimental disease models, for example, it has been demonstrated that the ER is enlarged and stressed in response to intraperitoneal (IP) injection of carbon tetrachloride or by feeding a methionine- and choline-deficient diet (Mu et al. 2010; Zheng et al. 2011b; Wang et al. 2013). To cope with ER stress, mammalian cells have developed an adaptive mechanism called the unfolded protein response (UPR), signaled by three sensors residing on the ER membrane: IRE1, PERK, and ATF6 (Travers et al. 2000; Carvalho et al. 2006; Tsang et al. 2010). The cellular decisions in activating or coordinating these pathways are crucial in determining cell fate and disease outcome in a variety of pathological conditions (Tsang et al. 2010).
Hrd1, an E3 ubiquitin ligase sometimes called synoviolin, is a multipass ER membrane protein encoded by synovial apoptosis inhibitor 1 (SYVN1 or Hrd1). Recent studies have identified Hrd1 as a downstream effector of the IRE1 branch of the UPR. In response to ER stress, XBP1 mRNA is spliced by IRE1 to produce XBP1s, which encodes an active transcription factor, resulting in transcriptional up-regulation of Hrd1 through a UPR element in its promoter (Yoshida et al. 2001; Yamamoto et al. 2008). Hrd1 is essential for embryogenesis, as demonstrated by the embryonic lethality of Hrd1−/− mice (Yagishita et al. 2005). It also plays a crucial role in the pathogenesis of arthropathy and liver cirrhosis/fibrosis (Amano et al. 2003; Hasegawa et al. 2010). Although Hrd1 was initially characterized as an E3 ubiquitin ligase controlling ER-associated degradation (ERAD), recent reports demonstrate that Hrd1 can also control the turnover of non-ERAD substrates such as p53, IRE1, and Nrf1, a member of the cap‘n’collar (CNC) transcription factor family (Yamasaki et al. 2007; Gao et al. 2008; Steffen et al. 2010; Tsuchiya et al. 2011).
In addition to the UPR, reactive oxygen species (ROS) have been shown to play a major role in the pathogenesis of liver cirrhosis (Lotersztajn et al. 2005; Wynn and Ramalingam 2012). Cellular ROS levels are regulated by the Nrf2 transcription factor that also belongs to the CNC family (Kensler et al. 2007; Jaramillo and Zhang 2013). Under basal conditions, Nrf2 levels are low due to tight regulation by Keap1, a substrate adaptor protein for the Cullin3 (Cul3)-based E3 ubiquitin ligase (Itoh et al. 1999; Kobayashi et al. 2004; Zhang et al. 2004). Activation of Nrf2 has been shown to confer protection against liver cirrhosis (Kawata et al. 2010; Ramani et al. 2012; Chen et al. 2013). Conversely, compromised Nrf2 signaling and elevation of ROS were detected in end-stage alcoholic liver disease (Kurzawski et al. 2012). Although the functional importance of the UPR and Nrf2 responses in liver cirrhosis has recently emerged, the interplay between these two major stress response pathways during the pathogenesis of liver cirrhosis remains unclear. Using liver tissues from cirrhosis patients, we detected up-regulation of the XBP1–Hrd1 arm of the ER stress pathway and down-regulation of the Nrf2-mediated antioxidant response. Here, we demonstrate that these two stress response pathways converge, and therapeutic modulation through inhibition of the IRE1–XBP1–Hrd1 pathway can prevent loss of the Nrf2-mediated protection, thus mitigating liver cirrhosis in vivo.
Results
The XBP1–Hrd1 arm of the ER stress pathway is up-regulated, and the Nrf2-mediated antioxidant response pathway is down-regulated in human cirrhotic livers
To investigate the role of the ER and Nrf2-mediated stress responses in the pathogenesis of liver cirrhosis, we measured the protein expression of several key proteins involved in both pathways in human cirrhotic liver tissues. Immunohistochemistry (IHC) and immunoblot analyses of cirrhotic liver tissues revealed increased levels of XBP1s and Hrd1 proteins that corresponded to compromised Nrf2 signaling, as evidenced by the decreased protein levels of Nrf2 and Nrf2-regulated proteins, NQO1, and GCLM (Fig. 1A,B). Consistently, the mRNA level of HRD1 was increased, whereas mRNA levels of Nrf2 target genes, such as NQO1 and GCLM, were decreased in cirrhotic tissues compared with normal tissues (Fig. 1C). In contrast, no change in NRF2 mRNA expression was observed (Fig. 1C), indicating that Hrd1 is altered at the transcriptional level, while Nrf2 is regulated at the post-transcriptional level during cirrhosis. These results demonstrate an up-regulation of the XBP1–Hrd1 arm of the ER stress response pathway and a down-regulation of the Nrf2 antioxidant response pathway in liver tissues from end-stage alcoholic cirrhosis patients. To further confirm this, we used a murine CCl4-induced liver cirrhosis model. The protein levels of XBP1s and Hrd1 were increased in cirrhotic liver tissues from both Nrf2+/+ and Nrf2−/− mice (Fig. 1D,E), suggesting activation of the XBP1–Hrd1 pathway during the course of liver cirrhosis. Interestingly, the protein levels of Nrf2, GCLM, and NQO1 decreased in cirrhotic livers, and altered expression of GCLM and NQO1 was Nrf2-dependent, since no changes in their expression were detected in Nrf2−/− mice (Fig. 1D,E). Similar to the results obtained using human specimens, the mRNA level of Hrd1 increased in CCl4-treated groups regardless of genotype, whereas the mRNA levels of Nrf2 (in Nrf2+/+ mice) and Keap1 were not affected by CCl4 treatment (Fig. 1F). In contrast, the mRNA levels of NQO1 and GCLM decreased in Nrf2+/+ but not Nrf2−/− mice (Fig. 1F). This inverse activation status of the XBP1–Hrd1 and Nrf2 pathways observed in human and mouse cirrhotic livers prompted us to test whether there is cross-talk between these two pathways using Hrd1 conditional knockout mice. Hrd1 was deleted through tail vein injection of adenoviruses containing Cre recombinase. Silencing of Hrd1, which occurred only in Hrd1f/f but not Hrd1+/+ mice, resulted in a robust increase in the protein level of Nrf2, NQO1, and GCLM as well as an increase in the mRNA level of NQO1 and GCLM without changing Nrf2 or Keap1 (Fig. 1G–I).
Figure 1.

The XBP1–Hrd1 arm of the ER stress pathway is up-regulated, and the Nrf2-mediated antioxidant response pathway is down-regulated in human cirrhotic liver. (A–C) Normal or cirrhotic liver tissues from patients with end-stage liver cirrhosis. (A) Representative hematoxylin and eosin (H&E) and IHC staining of XBP1s, HRD1, and NRF2 from liver tissues. (B) Expression levels of the indicated proteins detected using immunoblot analysis. (C) mRNA levels of NRF2, HRD1, NQO1, and GCLM measured by quantitative real-time PCR (qRT-PCR). (D–F) Liver tissues from control or CCl4-treated mice. (D) Representative H&E and IHC staining of Hrd1, Nrf2, and GCLM from liver tissues. (E) Expression levels of the indicated proteins detected using immunoblot analysis. (F) mRNA levels of Nrf2, Keap1, Hrd1, NQO1, and GCLM measured by qPCR. (G–I) Liver tissues from Hrd1+/+ and Hrd1f/f mice tail vein-injected with Cre-containing viruses for 5 d. (G) Representative H&E and IHC staining of Hrd1, Nrf2, and GCLM from liver tissues. (H) Expression levels of the indicated proteins detected using immunoblot analysis. (I) mRNA levels of Nrf2, Keap1, Hrd1, NQO1, and GCLM measured by qPCR. For immunoblot analysis, each lane contains a tissue lysate from an individual person (B) or mouse (E,H). For qRT-PCR, results are expressed as means ± SD; n = 4, four people per group (C); n = 4, three mice per group (F); and n = 3, three mice per group (I).
XBP1s and Nrf2 expression levels are inversely correlated
Next, using cultured cells, we investigated the inverse correlation between the activation of the XBP1–Hrd1 pathway and the Nrf2 pathway and the underlying molecular mechanism of their negative correlation. Overexpression of XBP1s decreased the protein level of Nrf2 under both basal (untreated) and induced (tert-butylhydroquinone [tBHQ]-treated) conditions (Fig. 2A) in both HEK293T (Fig. 2A) and MDA-MB-231 (data not shown) cells. Overexpression of XBP1s also reduced the expression of NQO1, GCLM, and HO-1 but not Keap1 (Fig. 2A). Ectopic expression of XBP1s decreased ARE-luciferase activity in a dose-dependent manner under both basal and induced conditions (Fig. 2B) and also decreased the mRNA levels of NQO1 and HO-1 without affecting NRF2 or KEAP1 (Fig. 2C). Next, we used XBP1+/+ and XBP1−/− mouse embryonic fibroblast (MEF) cells to confirm these observations. Cell status was validated by the absence of both unspliced XBP1 (XBP1u) and XBP1s in XBP1−/− cells (Fig. 2D). The protein levels of Nrf2, HO-1, and GCLM were higher in XBP1−/− than in XBP1+/+ cells (Fig. 2E), as were the mRNA levels of NQO1, GCLM, and HO-1 but not Nrf2 (Fig. 2F). Increased expression of NQO1 and GCLM in XBP1−/− cells was found to correlate with enhanced activities of NQO1 (Fig. 2G) and a higher level of glutathione under both basal and induced conditions in XBP1−/− cells (Fig. 2H). It is notable that more prominent differences were observed under induced conditions (Fig. 2A–C,E–H). Furthermore, the higher Nrf2 protein level in XBP1−/− cells was due to a longer half-life of the Nrf2 protein in XBP1−/− cells (40.5 min vs. 19.8 min in XBP1−/− and XBP1+/+ cells, respectively) (Fig. 2I).
Figure 2.

XBP1s and Nrf2 expression levels are inversely correlated. (A) Immunoblot analysis of the indicated proteins with cell lysates from HEK293T cells transfected with an empty vector or Flag-XBP1s. At 24 h post-transfection, cells were left untreated or treated with 50 μM tBHQ for 16 h. (B) Luciferase activities were measured in HEK293T cells cotransfected with NQO1-ARE-firefly luciferase and TK-Renilla luciferase along with the indicated amount of Flag-XBP1s for 36 h. Relative luciferase activities and SDs were calculated from three independent experiments (n = 3). (C) mRNA levels of Nrf2, Keap1, NQO1, and HO-1 in HEK293T cells transfected and treated as described in A (n = 3 independent experiments). (D) Splicing analysis of XBP1 mRNA (unspliced [u] and spliced [s]) was performed as described in the Materials and Methods. Total mRNA was extracted from XBP1+/+ and XBP1−/− MEF cells untreated or treated with 5 μg/mL tunicamycin for 16 h. (E–H) Protein levels of the indicated proteins (E), mRNA levels of the indicated genes (F), NQO1 activities (G), and intracellular glutathione levels (H) were measured in XBP1+/+ and XBP1−/− MEF cells left untreated or treated with 50 μM tBHQ for 16 h. (I) The Nrf2 protein half-life in XBP1+/+ and XBP1−/− MEF cells was measured in the presence of 50 μM cycloheximide at the indicated time points. Cell lysates were subjected to immunoblot analysis, with Nrf2 intensity normalized to tubulin plotted using a semilogarithmic scale.
Nrf2 is negatively regulated by Hrd1
Next, we explored the relationship between Hrd1, a newly identified XBP1s target gene, and Nrf2. Similar to the XBP1 results, overexpression of Hrd1 reduced the protein level of Nrf2, GCLM, and HO-1 (Fig. 3A), whereas siRNA-mediated silencing of Hrd1 enhanced these proteins (data not shown). In accordance with these results, expression of Nrf2, GCLM, and HO-1 was much higher in Hrd1−/− compared with Hrd1+/+ cells (Fig. 3B). mRNA expression of HO-1 was also higher in Hrd1−/− cells (Fig. 3C). Furthermore, Nrf2 protein was more stable with a longer half-life in Hrd1−/− compared with Hrd+/+ cells (39.7 min vs. 16.3 min) (Fig. 3D). Since Hrd1 is an E3 ubiquitin ligase, we tested the possibility that Hrd1 ubiquitylates Nrf2. Overexpression of Hrd1 enhanced Nrf2 ubiquitylation, as shown in a cell-based ubiquitylation analysis (Fig. 3E). In addition, coexpression of cyan fluorescent protein (CFP)-Hrd1 and red fluorescent protein (RFP)-Nrf2 showed that in the perinuclear clusters where Hrd1 localized, the Nrf2 signal was reduced (appeared as holes in the RFP channel), suggesting that ectopically expressed Hrd1 down-regulated Nrf2 (Fig. 3F). This inverse colocalization pattern was diminished by MG132 treatment (80% vs. 20% in untreated and MG132-treated cells, respectively) (Fig. 3F). These results suggest that Hrd1 ubiquitylates Nrf2.
Figure 3.

Nrf2 is negatively regulated by Hrd1. (A) Immunoblot analysis of the indicated proteins with cell lysates from HEK293T cells transfected with an empty vector or Flag-Hrd1. At 24 h post-transfection, cells were left untreated or treated with 50 μM tBHQ for 16 h. (B,C) Protein levels of the indicated proteins (B) and mRNA levels of the indicated genes (C) were measured in Hrd1+/+ and Hrd1−/− MEF cells left untreated or treated with 50 μM tBHQ for 16 h. (D) The Nrf2 protein half-life in Hrd1+/+ and Hrd1−/− MEF cells was measured as described in Figure 2I. (E) Cell-based ubiquitylation analysis was performed in HEK293T cells cotransfected with the indicated expression vectors for 48 h. (F) The cellular localization of Hrd1 and Nrf2 was detected by live-cell imaging, with representative images shown in the left panel. NIH3T3 cells were cotransfected with CFP-Hrd1 and RFP-Nrf2 for 24 h. Inversed colocalization of CFP-Hrd1 and RFP-Nrf2 is indicated with a white arrow. A cell that contains more than two inversed colocalization dots was considered as “positive.” At least 50 cells from either the control or the MG132-treated group were counted to get the percentage of cells showing an inverse correlation in their signal intensities between Hrd1 and Nrf2.
To further confirm that XBP1-mediated down-regulation of the Nrf2 signaling pathway is through Hrd1, several additional experiments were performed. First, overexpression of XBP1s, but not the unspliced mutant XBP1-3K/3R (XBP1u), up-regulated Hrd1 and decreased Nrf2, NQO1, GCLM, and HO-1 under both basal and induced conditions (Fig. 4A). Second, the XBP1s-mediated down-regulation of Nrf2 signaling was blunted by transfection of Hrd1-siRNA (Fig. 4B). Third, a decreased Nrf2 expression by XBP1s overexpression was observed only in Hrd+/+ but not in Hrd−/− cells (Fig. 4C). Fourth, up-regulation of endogenous XBP1s induced by tunicamycin also decreased Nrf2, NQO1, and GCLM (Fig. 4D). Finally, the mRNA levels of Hrd1 and HO-1 were inversely correlated with higher Hrd1 and lower HO-1 in XBP1+/+ cells compared with XBP1−/− cells (Fig. 4E).
Figure 4.

XBP1s down-regulates Nrf2 through Hrd1. (A) The protein levels of the indicated proteins in HEK293T cells transfected with vector, Flag-XBP1s, or XBP1-3K/3R and treated with tBHQ for 16 h. (B) The protein levels of the indicated proteins in HEK293T cells cotransfected with Hrd1-siRNA along with an empty vector or Flag-XBP1s. Cells were then treated with tBHQ for 16 h. (C) The protein levels of the indicated proteins in Hrd1+/+ and Hrd1−/− MEF cells transfected with an empty vector or Flag-XBP1s for 24 h. (D) The protein levels of the indicated proteins in HEK293T cells left untreated or treated with transmembrane (TM), tBHQ, or both for 16 h. (E) The mRNA levels of HO-1 and Hrd1 in XBP1+/+ and XBP1−/− MEF cells treated with TM, tBHQ, or both for 16 h. Data are shown as mean ± SD (n = 3 independent experiments).
Hrd1 and Nrf2 interact directly
Immunoprecipitation analyses demonstrated that exogenously and endogenously expressed Hrd1 and Nrf2 coexisted in precipitated complexes (Fig. 5A,B). To map the Hrd1-interacting domains in Nrf2, several deletion proteins purified from bacteria were used (Fig. 5C). Deletion of either Neh4 or Neh5 diminished the interaction, while deletion of both (Neh4–5) completely abolished the interaction (Fig. 5D), indicating a direct interaction between Hrd1 and the Neh4–5 domains of Nrf2. This was further confirmed in a cell-based assay by the fact that Nrf2-ΔNeh4 or Nrf2-ΔNeh5 immunoprecipitated Flag-Hrd1 less efficiently compared with wild-type Nrf2 (Nrf2-WT), and Nrf2-ΔNeh4-5 did not immunoprecipitate Flag-Hrd1 at all (Fig. 5E). Moreover, overexpression of Hrd1 reduced Nrf2-WT but was unable to reduce the protein level of Nrf2-ΔNeh4-5 (Fig. 5F), which supports the notion that Neh4–5 domains interact with Hrd1 and that this interaction is important for down-regulation of Nrf2 by Hrd1.
Figure 5.

Hrd1 and Nrf2 interact directly. (A) Immunoprecipitation analysis was performed using cell lysates from HEK293T cells cotransfected with Flag-Hrd1 and hemagglutinin (HA)-tagged Nrf2 (HA-Nrf2). (B) Immunoprecipitation analysis was performed using cell lysates from HEK293T cells, immunoprecipitated by normal rabbit IgG or anti-Nrf2 antibody. (C) Schematic illustration of glutathione S-transferase (GST)-tagged Nrf2-WT and its deletion mutants used for interaction domain mapping. (D) Sepharose affinity chromatography analysis of the interaction between Nrf2 and Hrd1. [35S]-Hrd1-WT was generated by in vitro transcription and translation. GST-tagged Nrf2-WT and its indicated deletion mutants were expressed and purified from Escherichia coli cells. Equal amounts of Nrf2 proteins were used for each pull-down assay. (E) Immunoprecipitation analysis was performed using cell lysates of HEK293T cells cotransfected with Flag-Hrd1 and either HA-Nrf2, HA-Nrf2-ΔNeh4, HA-Nrf2-ΔNeh5, or HA-Nrf2-ΔNeh4-5. (F) Immunoblot analysis was performed with cell lysates from HEK293T cells cotransfected with Flag-Hrd1 and either Nrf2-WT or Nrf2-ΔNeh4-5 for 24 h. (G) Immunoprecipitation of Nrf2 by Flag-Hrd1 and its mutants. HEK293T cells were transfected with Flag-Hrd1 and the indicated truncation mutants. Hrd1 proteins were first immunoprecipitated using Flag-M2 beads and then incubated with His-tagged Nrf2 that was expressed and purified from E. coli cells. Equal amounts of Hrd1 proteins were used for each experiment.
To map the domain within Hrd1 that interacts with Nrf2, we performed an in vitro binding assay using His-tagged Nrf2 purified from bacteria and Flag-tagged Hrd1 proteins immunoprecipitated from HEK293T cells (Fig. 5G). As expected, His-Nrf2 was immunoprecipitated by Flag-Hrd1, whereas the interaction of His-Nrf2 with Flag-Hrd1-N or Flag-Hrd1-N-RING was completely lost when the C-terminal domain (amino acids 337–617) of Hrd1 was deleted (Fig. 5G). The C-terminal domain of Hrd1 was found to be sufficient to immunoprecipitate Nrf2 (Fig. 5G). These results suggest a direct interaction between the C-terminal domain of Hrd1 and the Neh4–5 domains of Nrf2, which is consistent with the notion that Nrf2 is a cytosolic protein and interacts with the cytosolic C-terminal domain of Hrd1.
Hrd1 is a novel E3 ubiquitin ligase of Nrf2
The RING domain of Hrd1 contains a cysteine critical for its ubiquitin ligase activity. To identify this critical cysteine residue in the RING domain, six Hrd1 mutant proteins in which each cysteine was replaced with serine were constructed (Fig. 6A). Hrd1-C291S was found to be critical for its function because overexpression of wild-type Hrd1 (Hrd1-WT), not Hrd1-C291S, reduced Nrf2 and HO-1 levels (Fig. 6B). Consistently, only Hrd1-WT, not Hrd1-C291S, was able to enhance ubiquitylation of Nrf2 both in a cell-based assay (Fig. 6C) and in vitro (Fig. 6D). Overexpression of Hrd1-WT accelerated degradation of Nrf2 (from 38.7 min to 17.7 min), while Hrd1-C291S had no effect on Nrf2 protein decay (38.7 min to 40.2 min) (Fig. 6E). Collectively, these results demonstrate that Cys291 within the RING domain of Hrd1 is indispensable for its ubiquitin ligase activity.
Figure 6.

Hrd1 is a novel E3 ubiquitin ligase of Nrf2. (A) Schematic illustration of the amino acid sequence of the RING domain of Hrd1. Conserved cysteine residues that are mutated to serines are labeled with arrows. (B) Immunoblot analysis of cell lysates from HEK293T cells transfected with an empty vector, Flag-Hrd1, or Flag-C291S. Cells were untreated or treated with tBHQ for 16 h. (C) Cell-based ubiquitylation analysis was performed in HEK293T cells cotransfected with Nrf2, Flag-Hrd1, or Flag-C291S mutant and HA-ubiquitin for 48 h. (D) In vitro ubiquitylation of Nrf2 in the presence of Flag-Hrd1 and Flag-C291S was measured. HA-Nrf2-containing complexes were immunoprecipitated using HA beads from HEK293T cells transfected with Nrf2 and either Flag-Hrd1-WT or Flag-Hrd1-C291S. HA bead-bound proteins were incubated with purified E1, E2-UbcH5c, ubiquitin, and ATP. Following denaturation by boiling, Nrf2 was immunoprecipitated with anti-Nrf2 antibodies, and ubiquitylation of Nrf2 was detected by immunoblot analysis with an anti-ubiquitin antibody. (E) The Nrf2 protein half-life in HEK293T cells transfected with either an empty vector, Flag-Hrd1, or Flag-C291S was measured as described above. (F) Immunoblot analysis of Nrf2 in Keap1−/− MEF cells transfected with an empty vector, Flag-Hrd1, or Flag-XBP1s for 24 h. (G) Immunoblot analysis of the indicated proteins. HEK293T cells were cotransfected with Flag-Hrd1 and either Nrf2-WT, Nrf2-ETGE/AAAA, or Nrf2-DLG/AAA. (H) Immunoblot analysis of the indicated proteins. HEK293T cells were cotransfected with Flag-Hrd1 and either Nrf2-WT, Nrf2-ETGE+2S, or Nrf2-ETGE-DLG+2S. (I) Immunoblot analysis of the indicated proteins. HEK293T cells were cotransfected with Flag-Hrd1 and either Nrf2-WT or Nrf2-K7/R7 for 24 h. (J) Immunoblot analysis of the indicated proteins. HEK293T cells were cotransfected with Flag-Hrd1 and either Nrf2-WT, Nrf2-NLS2, Nrf2-NES1, or Nrf2-NES2.
To demonstrate that Hrd1 functions independently of Keap1 or β-TrCP, previously defined E3 ligases that control Nrf2 protein stability (Kobayashi et al. 2004; Zhang et al. 2004; Rada et al. 2011, 2012; Chowdhry et al. 2013), we performed several additional experiments. Overexpression of XBP1s or Hrd1 reduced Nrf2 levels in Keap1−/− cells (Fig. 6F). In addition, ectopically expressed Hrd1 decreased not only Nrf2-WT but also Nrf2-ETGE/AAAA and Nrf2-DLG/AAA mutant proteins that were previously proven to lose interaction with Keap1, preventing degradation by Keap1-mediated ubiquitylation and subsequent proteasomal degradation (Fig. 6G; McMahon et al. 2006; Tong et al. 2006). These results suggest that Hrd1-mediated Nrf2 degradation is Keap1-independent. Next, to prove that Hrd1-mediated Nrf2 degradation is also independent of β-TrCP, we made two additional constructs, Nrf2-ETGE+S2 and Nrf2-ETGE-DLG+S2, that were confirmed to be resistant to both Keap1- and β-TrCP-mediated degradation (data not shown). However, Hrd1 was still able to reduce the protein level of these two mutants (Fig. 6H), indicating that the ligase activity of Hrd1 in ubiquitylating Nrf2 is not associated with Keap1 or β-TrCP. Next, we tested whether the seven lysines within the Neh2 domain of Nrf2 are also required for Hrd1-mediated ubiquitylation. The same seven lysines in Nrf2 that are required for Keap1-dependent ubiquitylation of Nrf2 (Zhang et al. 2004) were also critical for Hrd1-mediated Nrf2 ubiquitylation and degradation, since Nrf2-K7/R7 was not affected by overexpression of Hrd1 (Fig. 6I). In addition, Hrd1-mediated ubiquitylation and degradation of Nrf2 occurs in the cytosol, since Hrd1 reduced only the protein levels of Nrf2-WT and the cytoplasmic-only version of Nrf2 (Nrf2-NLS2) in which the nuclear localization signal RKRK was mutated to AAAA, but Hrd1 had no effect on Nrf2-NES1 and Nrf2-NES2, which were forced to localize in the nucleus due to mutations made in their nuclear export signals (Fig. 6J; Sun et al. 2007). Taken together, these results clearly demonstrate that Hrd1, an ER-associated E3 ubiquitin ligase, is a novel E3 ubiquitin ligase controlling Nrf2 though an interaction between the C-terminal domain of Hrd1 and the Neh4–5 domains of Nrf2. This Hrd1-mediated ubiquitylation of Nrf2 is independent of both Keap1 and β-TrCP.
Pharmacological inhibition of Hrd1 as a strategy to prevent loss of the Nrf2-mediated protective mechanism
Our results indicate that loss of the Nrf2-mediated cellular protection through Hrd1-mediated ubiquitylation and subsequent proteasomal degradation of Nrf2 may be crucial in determining liver disease outcome. This observation argues for a novel therapeutic strategy for treating liver cirrhosis by targeting Hrd1 to preserve the Nrf2 protective response rather than using currently available Nrf2 inducers that only block Keap1-dependent ubiquitylation of Nrf2. Therefore, we tested whether Hrd1 is a potential therapeutic target for preventing/mitigating liver cirrhosis through enhancement of the Nrf2-regulated protective mechanism. Two compounds, 4U8C (IRE1 inhibitor) (Cross et al. 2012; Qiu et al. 2013) and LS-102 (Hrd1 inhibitor) (Yagishita et al. 2012), were tested for their ability to alleviate liver cirrhosis in Nrf2+/+ and Nrf2−/− mice. In Nrf2+/+ mice, CCl4 increased XBP1s and Hrd1 protein levels while decreasing Nrf2, NQO1, and GCLM protein levels (Fig. 7A,B). 4U8C suppressed CCl4-mediated up-regulation of XBP1s and Hrd1 and restored the protein levels of Nrf2, NQO1, and GCLM (Fig. 7A,B). LS-102 suppressed down-regulation of Nrf2 and its target genes induced by CCl4 treatment while having no effect on the protein levels of XBP1s and Hrd1, consistent with its mode of action (Fig. 7A,B; Yagishita et al. 2012). Although the expression pattern of XBP1s and Hrd1 in response to both inhibitors was similar in Nrf2+/+ and Nrf2−/− mice, the expression levels of NQO1 and GCLM remained the same in the inhibitor-treated Nrf2−/− groups (Fig. 7A,B). Furthermore, neither CCl4 nor the two inhibitors affected Nrf2 or Keap1 mRNA levels (Fig. 7C). 4U8C, but not LS-102, suppressed CCl4-induced up-regulation of Hrd1 mRNA in both Nrf2+/+ and Nrf2−/− mice (Fig. 7C). However, NQO1 mRNA was restored by drugs only in Nrf2+/+ mice (Fig. 7C). Next, the effect of 4U8C and LS-102 in alleviating liver cirrhosis was tested. Both 4U8C and LS-102 were able to suppress CCl4-induced elevation of alanine aminotransferase (ALT) in Nrf2+/+ but not in Nrf2−/− mice (Fig. 7D). Hematoxylin and eosin (H&E) staining showed that both LS-102 and 4U8C restored normal liver morphology in Nrf2+/+ but not in Nrf2−/− mice, although LS-102 had the larger effect (Fig. 7E). Moreover, lipid peroxidation and oxidative DNA damage, measured as malonyl dialdehyde (MDA) and 8-hydroxydeoxyguanosine (8-OH-dG), respectively, were corrected to a level almost similar to the untreated group by LS-102 and 4U8C (Fig. 7F,G). In addition, apoptotic cell death was significantly reduced in Nrf2+/+ mice but only slightly in Nrf2−/− mice (Fig. 7H), and both drugs reduced collagen deposition in Nrf2+/+ but not in Nrf2−/− mice, as revealed by trichrome staining (Fig. 7I).
Figure 7.

Pharmacological inhibition of Hrd1 as a strategy to prevent loss of the Nrf2-mediated protective mechanism. (A–I) IHC staining (A); the protein levels of the indicated proteins (B); the mRNA levels of the indicated genes (C); serum levels of alanine aminotransferase (ALT), a key index for liver function (D); H&E staining (E); malonyl dialdehyde (MDA), an indicator for lipid peroxidation (F); 8-hydroxydeoxyguanosine (8-OH-dG) for oxidative DNA damage (G); apoptotic cell death as indicated by TUNEL staining (H); and collagen deposition measured using Masson's trichrome staining (I) were conducted with liver tissues from Nrf2+/+ and Nrf2−/− mice treated with vehicle control, CCl4, CCl4 plus 4U8C, and CCl4 plus LS-102. Four mice were used in each group. Treatment regimens are described in the Materials and Methods. (B) For immunoblot analysis, each lane contains a tissue lysate from an individual mouse. For results expressed as bar graphs, means and SD were from four mice (n = 4).
Discussion
It has been well documented that boosting the Nrf2-mediated cellular protective response offers protection against chronic diseases induced by accumulation of oxidatively damaged biomolecules (Kensler et al. 2007; Jaramillo and Zhang 2013). Therefore, identifying and developing small-molecule Nrf2 activators for disease prevention and intervention have been areas of intensive research. Interestingly, the basal Nrf2 levels were found to be low in aged organisms and certain pathological conditions (Sykiotis and Bohmann 2010; Kurzawski et al. 2012). The detailed mechanisms underlying age- and disease-related down-regulation of Nrf2 are unclear, but this knowledge is critical for developing a rational strategy to prevent loss of this major cellular protective response. Keap1 has been regarded as the primary E3 ubiquitin ligase controlling the protein level of Nrf2 and its downstream response (Kobayashi et al. 2004; Zhang et al. 2004). Accordingly, all Nrf2 activators known to date function by targeting Keap1 (Ma and He 2012; Magesh et al. 2012).
In this study, we discovered that the E3 ubiquitin ligase that compromised the Nrf2 response in cirrhotic liver is Hrd1 and not Keap1 or β-TrCP. Hrd1 has an essential developmental role, and aberrant expression of Hrd1 has been associated with a number of chronic diseases (Amano et al. 2003; Yagishita et al. 2005; Hasegawa et al. 2010). For instance, it was shown to be up-regulated in rheumatoid synovial cells, and overexpression of Hrd1 resulted in spontaneous arthropathy, whereas Hrd1+/− mice were more resistant to collagen-induced arthritis (Amano et al. 2003). Recently, Hrd1 was also found to be up-regulated in CCl4-induced fibrotic livers, and Hrd1+/− mice had fewer activated hepatic stellate cells, less collagen accumulation, and less hepatic injury compared with Hrd1+/+ mice (Hasegawa et al. 2010). The molecular mechanisms underlying the pathological roles of Hrd1 in these diseases are presumably derived from its function as an E3 ubiquitin ligase. Initially, it was thought that Hrd1 only regulated the turnover of proteins in the ERAD system, since Hrd1 resides in the ER membrane. More recently, however, Hrd1 substrates that control specific signaling pathways have been identified, including p53, Nrf1, Rer1, and IRE1 (Yamasaki et al. 2007; Gao et al. 2008; Steffen et al. 2010; Tanabe et al. 2012). In this study, we show that Nrf2 is a bona fide substrate of Hrd1. This activity is mediated through the direct binding between the Neh4–5 domains of Nrf2 and the cytosolic C-terminal domain of Hrd1. The inverse correlation in the expression of Nrf2 and Hrd1 was observed in both human and mouse cirrhotic livers. Furthermore, silencing of Hrd1 in the livers of conditional knockout mice markedly enhanced the expression of Nrf2 and its target genes. All of these observations support the functional importance of Hrd1-mediated control of Nrf2 in disease settings.
In support of our finding, negative regulation of ER stress on Nrf2 was observed in an in vivo study comparing the gene expression profile in the small intestine and liver in response to tunicamycin treatment. Many phase II detoxifying genes, including glutathione S-transferase (GST) isoforms and GCLM, were found to be down-regulated in an Nrf2-dependent manner (Nair et al. 2007). Combined with the results from our study, it is likely that the observed down-regulation of the Nrf2-mediated response in the early study was due to the up-regulation of Hrd1 by tunicamycin. Inconsistent with our data, a recent study comparing gene expression profiles from human liver tissues from normal, steatosis, alcohol cirrhosis, and diabetic cirrhosis showed increased Nrf2 levels and increased downstream genes in alcoholic and diabetic cirrhotic livers compared with normal nonsteatotic livers (More et al. 2013). The alcoholic cirrhotic liver tissues used in this study are from the same repository as ours. Therefore, it is unclear why the opposite outcomes regarding Nrf2 activation were obtained. However, the observed changes in the expression of Nrf2 and NQO1 in both studies are marginal, which may be due to the heterogeneity of human samples. Crucially, the experiments carried out using a mouse model clearly show the negative regulation between Hrd1 and Nrf2 or Nrf2 target genes (Fig. 1, cf. A–C and D–F or G–I). Furthermore, while our data explain pathological conditions when the overly activated IRE1–XBP1 arm of ER stress suppressed the Nrf2 protective mechanism, it is unclear what role, if any, the negative regulation of Nrf2 by Hrd1 may have under physiological conditions. We believe that Cul3–Keap1–Rbx1 is the primary E3 ligase that targets Nrf2 for ubiquitylation and degradation under physiological conditions. Therefore, it is reasonable to speculate from an evolutionary point of view that Hrd1-mediated regulation of Nrf2 is a way to get rid of cells that have activated the IRE1–XBP1 ER stress pathway, and cellular homeostasis can no longer be achieved.
As illustrated in Supplemental Table 1, Keap1–Cul3–Rbx1 was the first Nrf2 E3 ubiquitin ligase identified (Kobayashi et al. 2004; Zhang et al. 2004). Structural studies have demonstrated that a Keap1 dimer binds Nrf2. Each Kelch domain in Keap1 interacts with either a DLG or an ETGE motif in the Neh2 domain of Nrf2 (McMahon et al. 2006; Tong et al. 2006). The seven lysines between the DLG motif and the ETGE motif of Nrf2 were required for receiving a polyubiquitin chain (Zhang et al. 2004). Presently, all small chemical Nrf2 activators or endogenous proteins identified disrupt the DLG–Kelch interaction to suppress Nrf2 ubiquitylation, resulting in stabilization of Nrf2 and activation of the pathway (Magesh et al. 2012; Jaramillo and Zhang 2013). Recently, β-TrCP–Skp1–Cul1–Rbx1 was also identified as an E3 ubiquitin ligase for Nrf2 (Rada et al. 2011, 2012; Chowdhry et al. 2013). Two motifs, DSGIS and DSAPGS, in the Neh6 domains of Nrf2 were determined to interact with β-TrCP. Phosphorylation of the serine residues in DSGIS resulted in recruitment of Nrf2 by β-TrCP into the E3 ligase complex, with subsequent ubiquitylation of Nrf2 (Rada et al. 2011, 2012; Chowdhry et al. 2013). However, phosphorylation of DSAPGS is not required (Chowdhry et al. 2013). In the present study, we identified Hrd1 as another E3 ubiquitin ligase that down-regulates Nrf2 during the course of liver cirrhosis. Until now, Keap1, β-TrCP, and Hrd1 are three E3 ubiquitin ligases of Nrf2 that have been discovered (Supplemental Table 1). It is also worth mentioning that only β-TrCP and Hrd1, but not Keap1, are the E3 ubiquitin ligases for Nrf1, another member of the CNC family, even though Nrf1 also contains Keap1-binding DLG and ETGE motifs (Supplemental Table 1; Zhang et al. 2006; Steffen et al. 2010; Tsuchiya et al. 2011). Understanding how Nrf2 is controlled in distinct pathophysiological conditions and developing Nrf2 modulators to inactivate the appropriate E3 ligases are crucial for targeted disease prevention and intervention. To illustrate, we demonstrated the importance of targeting Hrd1, instead of Keap1, to preserve the Nrf2 defense system, which suppresses the progression of liver cirrhosis. In cirrhotic livers, high levels of ROS inactivate Keap1, which should lead to high Nrf2 levels. However, we observed low Nrf2 levels in cirrhotic liver tissues compared with normal liver tissues. Hrd1 turned out to be the primary E3 ubiquitin ligase controlling the Nrf2 protective response in cirrhotic livers. We showed that inhibition of Hrd1 directly with LS-102 or indirectly through IRE1 inhibition with 4U8C was able to restore the Nrf2 response, reduce oxidative damage, and alleviate liver injury and cirrhosis.
In summary, we discovered cross-talk between two major cellular stress response pathways: the IRE1–XBP1–Hrd1 arm of the ER stress response pathway and the cytoprotective Nrf2-mediated oxidative stress response pathway. These two pathways converge through Hrd1-mediated Nrf2 ubiquitylation. We demonstrated that Hrd1-mediated suppression of the Nrf2-dependent cytoprotective pathway plays a crucial role in the pathogenesis of liver cirrhosis. Finally, the therapeutic importance of our findings was demonstrated by showing that pharmacological inhibition of Hrd1 alleviated liver injury and cirrhosis in an Nrf2-dependent manner.
Materials and methods
Liver samples and preparations
Normal human liver tissues and cirrhotic liver tissues from end-stage alcoholic cirrhosis patients were obtained through the Liver Tissue Cell Distribution System, Minneapolis, Minnesota, which was funded by National Institutes of Health contract number HHSN276201200017C.
Generation of Hrd1f/f mice
The Hrd1 gene contains 16 exons; we floxed exons 8–11, which encode a large region of the Hrd1 protein from its fifth transmembrane domain to the proline-rich sequence (Fig. 4G). To exclude the potential effects of the neomycin selection cassette on Hrd1 expression, this cassette was flanked by two flippase recognition target (FRT) sites, which can be deleted by FLP recombinase. This targeting vector was transfected into an embryonic stem cell line generated from C57/BL6 mice. The neomycin selection marker was screened by PCR. Seven clones were obtained and confirmed by Southern blotting. Blastocyst injections resulted in several chimeric mice with the capacity for germline transmission. Breeding of heterozygous mice yielded Hrd1+/+, Hrd1+/f, and Hrd1f/f mice with the expected Mendelian ratios. No obvious phenotypic abnormalities were observed in all genotypes.
Animal treatment
For the liver cirrhosis model, male Nrf2+/+ and Nrf2−/− mice at the age of 6 wk were IP-injected with 1 mL/kg 50% (v/v) CCl4 or olive oil three times a week for 4 wk. For cotreatment groups, animals received IP injection of 5 mg/kg 4U8C and 1.3 mg/kg LS-102 daily. Animals were sacrificed 24 h after the last injection of CCl4, and liver tissues and serum were collected for analysis.
H&E, IHC analysis, and Masson's trichrome staining
H&E, IHC, and Masson's trichrome staining analyses were performed as described previously (Jiang et al. 2009; Zheng et al. 2011a). Briefly, paraffin-embedded liver tissues were cut into 4- to 5-μm sections and stained with H&E or the indicated antibodies. The trichrome stain (Masson) kit was purchased from Sigma, and the procedure was carried out according to the manufacturer's instructions.
Construction of recombinant DNA molecules
Plasmids expressing Flag-tagged XBP1s and XBP1-3K/3R were generous gifts from Dr. Laurie H. Glimcher (Harvard School of Public Health). Flag-tagged wild-type and truncated forms of Hrd1 were PCR-amplified using cDNAs reverse-transcribed from mRNAs of HEK293T cells and subcloned into the pCMV-Flag-5a vector using EcoRI/BamHI restriction sites. The Hrd1-C291S mutation was generated by site-directed mutagenesis using the PCR and DpnI method. Hemagglutinin (HA)-tagged, His-tagged, and GST fusion proteins of Nrf2-WT and Nrf2 domain deletion mutants have been previously described (Sun et al. 2009). To construct the fluorescent-tagged proteins for live-cell imaging, Hrd1 and Nrf2 were cloned into CFP and RFP vectors, respectively. The following restriction enzyme cutting sites were used to generate the fluorescently tagged proteins: XhoI/BamHI (Nrf2-RFP) and Hind III/BamHI (Hrd1-CFP). Plasmids expressing wild-type HA-Nrf2 proteins have been previously described (Zhang and Hannink 2003). Plasmids for the Nrf2 domain deletion mutants were originally generated by PCR and three-way ligation into the pCMV-HA vector (Clontech) using SalI/KpnI and KpnI/NotI cutting sites. The primers used for Nrf2 domain deletion mutants are listed in Table 1.
Table 1.
Primers used for Nrf2 domain deletion mutants
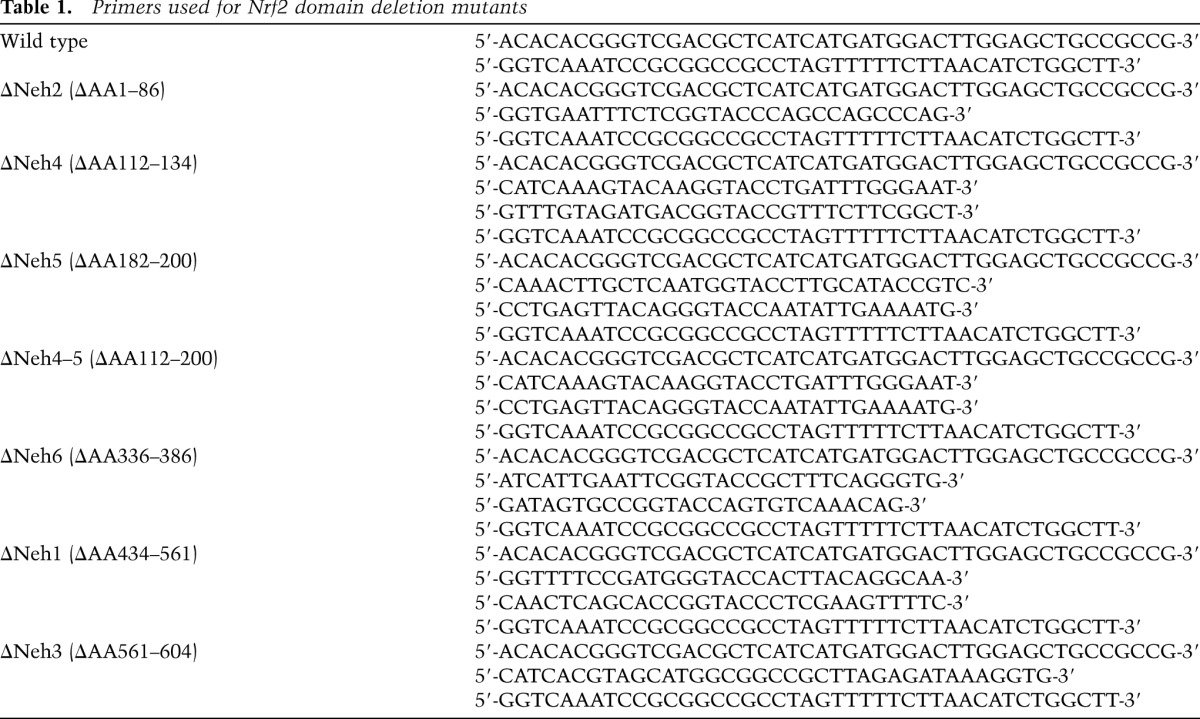
These plasmids were then used as templates for subcloning the GST-Nrf2 by PCR and ligation into the pGEX-5X-3 vector using BamHI and XhoI cutting sites.
Cell culture, transfection, and RNAi
HEK293T and MDA-MB-231 cells were purchased from American Type Culture Collection (ATCC). XBP1+/+ and XBP1−/− MEF cells were a generous gift from Dr. Laurie H. Glimcher. Hrd1+/+ and Hrd1−/− MEF cells were generated by our team (in the laboratory of T.N.). HEK293T cells were maintained in minimum essential medium Eagle's medium (MEM) (Cellgro) in the presence of 10% fetal bovine serum (FBS), 1% L-glutamine (Life Technologies), 1.0 mM sodium pyruvate, 0.1 mM nonessential amino acids (Hyclone), and 0.1% gentamycin (Life Technologies). MDA-MB-231 cells were maintained in MEM (Cellgro) in the presence of 10% FBS, 1% L-glutamine (Life Technologies), 6 ng/mL insulin (Sigma), and 0.1 mM HEPES (Life Technologies). All MEF cell lines were maintained in Dulbecco's modified Eagle's medium (DMEM) in the presence of 10%–20% FBS and 0.1% gentamycin. All cells were incubated at 37°C in a humidified incubator containing 5% CO2. All cell culture dishes used for HEK293T cells were coated with 0.1 mg/mL poly-D-lysine (Sigma). Transfections of plasmid DNA were performed with Lipofectamine Plus reagent (Invitrogen) according to the manufacturer's instructions. siRNA against Hrd1 and scrambled control siRNA were purchased from Thermo Scientifics. The four Hrd1-siRNAs (used as a mixture) were 5′-CAACAAGGCUGUGUACAUG, 5′-UGUCUGGCCUUCACCGUUU-3′, 5′-GGAGAUGCCUGAGGAUGGA-3′, and 5′-CCAAGAGACUGCCCUGCAA-3′ (Thermo Scientific catalog nos. siGENOME SMARTpool siRNA D-007090-01, D-007090-02, D-007090-03, and D-007090-04). Transfection of siRNA was performed with Lipofectamine 2000 (Invitrogen) according to the manufacturer's instructions. In general, concentrations of 20 pmol and 40 pmol or siRNA gave the best silencing results and thus were used in this study.
Antibodies, immunoprecipitation, and immunoblot analysis
Rabbit anti-Nrf2 (Santa Cruz Biotechnology), anti-Hrd1 (Santa Cruz Biotechnology), anti-HO-1 (Santa Cruz Biotechnology); mouse anti-tubulin (Santa Cruz Biotechnology), anti-GAPDH (glyceraldehyde-3-phosphate dehydrogenase; Santa Cruz Biotechnology), anti-NQO1 (Santa Cruz Biotechnology), anti-8-oxo-dG (Trevigen), anti-His epitope (Santa Cruz Biotechnology), anti-HA epitope (Covance), and mouse anti-Flag (Sigma) were purchased from commercial sources. To detect protein expression in total cell lysates, cells were lysed in sample buffer (50 mM Tris-HCl at pH 6.8, 2% sodium dodecyl sulfate [SDS], 10% glycerol, 100 mM dithiothreitol [DTT], 0.1% bromophenol blue) 24–48 h after transfection.
For immunoprecipitation, cell lysates were collected at 48 h post-transfection in radio immunoprecipitation assay (RIPA) buffer containing 10 mM sodium phosphate (pH 8.0), 150 mM NaCl, 1% Triton X-100, 1% sodium deoxycholate, and 0.1% SDS in the presence of 1 mM DTT, 1 mM phenylmethylsulfonyl-fluoride (PMSF), and a protease inhibitor cocktail (PIC) (Sigma). Cell lysates were precleared with protein A beads and then incubated with either HA beads (Sigma) for ectopically expressed proteins or 1 μg of antibodies against specific endogenous proteins with protein A-agarose beads on a rotator overnight at 4°C. After three washes with RIPA buffer, immunoprecipitated complexes were eluted in sample buffer by boiling, electrophoresed through SDS–polyacrylamide gels, and subjected to immunoblot analysis.
For the in vitro pull-down assay, the purified His-tagged Nrf2 protein was incubated with the Flag-tagged wild-type or truncated forms of Hrd1 and anti-Flag M2 beads in binding buffer containing 50 mM Tris-HCl (pH 7.4), 150 mM NaCl, 1mM EDTA, and 1% Triton X-100 in the presence of 1 mM PMSF and PIC (Sigma) on a rotator for 12 hat 4°C. After five washes with washing buffer (50 mM Tris-HCl, 150 mM NaCl, 1 mM PMSF, 0.1 mM PIC), complexes that were pulled down were eluted in sample buffer by boiling, electrophoresed through SDS–polyacrylamide gels, and subjected to immunoblot analysis.
Luciferase reporter gene assay
For the dual-luciferase reporter gene assay, HEK293T cells were transfected with the NQO1 ARE-luciferase plasmid along with the Renilla luciferase expression plasmid pGL4.74 (hRluc/TK) (Promega) and different amounts of expression vectors for Flag-XBP1s. At 24 h post-transfection, cells were treated with a known inducer of Nrf2, tBHQ (Sigma), for 16 h. The transfected cells were then lysed with passive lysis buffer (Promega), and both firefly and Renilla luciferase activities were measured with the dual-luciferase reporter assay system (Promega). Firefly luciferase activity was normalized to Renilla luciferase activity. The experiment was repeated three times with triplicate samples, and the data are expressed as mean ± standard deviation (SD).
Intracellular glutathione level
The intracellular glutathione concentration was measured using a QuantiChrom glutathione assay kit (BioAssay Systems) according to the manufacturer's instructions (Chen et al. 2009). All of the experiments were repeated three times with triplicate samples. The results are presented as mean ± SD.
NQO1 activity assay
Cells were washed with PBS twice, harvested in 0.5 mL of homogenization buffer (20 mM Tris-HCl, 2 mM EDTA at pH 7.4), and subjected to three cycles of freezing in a −80°C freezer and thawing. Cell debris was removed by centrifugation at 12,000g for 5 min at 4°C. The supernatants were transferred to new microcentrifuge tubes for determination of protein concentration using the BCA protein assay kit (Thermo Scientific) following the manufacturer's instructions. NQO1 activity was determined by the continuous spectrophotometric assay to quantitate the dicumarol-inhibitable reduction of its substrate, DCPIP (Sigma). The rate of DCPIP reduction was monitored over 1.0 min at 600 nm with an extinction coefficient of 2.1 mM−1cm−1. The NQO1 activity was calculated as the decrease in absorbance per minute per microgram of total protein of the sample in the presence or absence of the NQO1 enzyme inhibitor dicumarol (Sigma).
Ubiquitylation of Nrf2
To detect ubiquitylated Nrf2 in cultured cells, HEK293T cells transfected with expression plasmids for HA-Ub and the indicated proteins for 48 h were treated for 4 h with 10 μM MG132 (Sigma) to block protein degradation. Cells were then lysed in a buffer containing 2% SDS, 150 mM NaCl, 10 mM Tris-HCl, and 1 mM DTT. The cell lysates were boiled immediately for 10 min to inactivate cellular ubiquitin hydrolases to preserve ubiquitin–protein conjugates. The heated lysates were then cooled and diluted five times with a Tris-buffered salt (TBS) solution without SDS and used for immunoprecipitation with an antibody against Nrf2 (C-20) or normal rabbit IgG. Immunoprecipitated proteins were subjected to immunoblot analysis with an antibody against HA.
For ubiquitylation of Nrf2 in vitro, HEK293T cells were transfected with HA-Nrf2 and either Flag-Hrd1 or Flag-Hrd1(C291S). The transfected cells were lysed in lysis buffer (50 mM Tris-HCl at pH 7.4, 150 mM NaCl, 1 mM EDTA, 1% Triton X-100) containing 1 mM DTT, 1 mM PMSF, and protease inhibitor cocktail. The lysates were precleared with protein A beads prior to incubation with Flag M2 beads (Sigma) for 12 h. Flag M2 beads were washed three times with TBS wash buffer (50 mM Tris-HCl, 150 mM NaCl at pH 7.4) containing 1 mM DTT, 1 mM PMSF, and protease inhibitor cocktail. The pellets were incubated with 300 pmol of ubiquitin, 2 pmol of E1, and 10 pmol of E2-UbcH5c in 1× reaction buffer (20 mM Tris-HCl at pH 7.4, 5 mM MgCl2, 2 mM ATP) in a total volume of 40 μL for 90 min at 37°C. Ubiquitin, E1, and E2-UbcH5c were purchased from Boston Biochem. The Flag M2 was centrifuged at 3000g, and the pellets were resuspended in 2% SDS, and 150 mM Tris-HCl (pH 8.0) and boiled for 5 min to release bound proteins and disrupt protein–protein interactions. The supernatant was diluted with buffer lacking SDS prior to immunoprecipitation with anti-Nrf2 antibodies. Immunoprecipitated proteins were subjected to immunoblot analysis with anti-ubiquitin antibodies.
Protein half-life measurement
To measure the half-life of Nrf2, 50 μM cycloheximide (Sigma) was added to block protein synthesis. Total cell lysates were collected at different time points and subjected to immunoblot analysis with anti-Nrf2 and anti-tubulin antibodies. The intensity of the bands was quantified using the ChemiDoc CRS gel documentation system and Quantity One software (Bio-Rad). Relative intensity (Nrf2 vs. tubulin) was plotted using a semilogarithmic scale.
Protein radiolabeling and in vitro binding assay
Hrd1-WT and its mutants were radiolabeled with [35S]methionine using the in vitro TNT Quick PCR transcription/translation system (Promega). GST-tagged Nrf2 and domain deletion proteins were expressed in Escherichia coli Rosetta (DE3) LysS cells and purified with glutathione sepharose 4B matrix (Amersham Biosciences). For the in vitro binding assay, radiolabeled proteins and purified proteins were incubated in binding buffer (4.2 mM Na2HPO4, 2 mM KHPO4, 140 mM NaCl, 10 mM KCl, 0.2% bovine serum albumin [BSA], 0.02% Triton X-100, 1 mM DTT) in the presence of sepharose beads for 4–6 h at 4°C. The beads were then washed six times with binding buffer. The proteins were eluted by boiling in SDS sample buffer followed by SDS-PAGE and autoradiography analysis.
Fluorescently tagged proteins and immunofluorescence
Cells were grown on 35-mm glass-bottom dishes (In Vivo Scientific) for live-cell imaging. Cells were transfected with the indicated fluorescent-labeled proteins. At 24 h post-transfection, the medium was replaced with phenol red-free DMEM supplemented with 10% FBS. All images were taken with the Zeiss Observer using the Slidebook 4.2.0.11 computer program (Intelligent Imaging Innovations, Inc.).
mRNA extraction and quantitative real-time PCR (qRT-PCR)
Total mRNA was extracted from cells using TRI reagent (Sigma). Equal amounts of RNA were used for reverse transcription using a Transcriptor first strand cDNA synthesis kit (Roche). The following TaqMan probes from the universal probe library (Roche) were used: human Nrf2 (no.70), human NQO1 (no. 87), human HO-1 (no. 25), human Hrd1 (no. 25), human GAPDH (no. 25), mouse Nrf2 (no. 56), mouse Hrd1 (no. 2), mouse NQO1 (no. 50), mouse HO-1 (no. 25), and mouse β-actin (no. 56). The following primers were synthesized by Integrated DNA Technologies: hNrf2, forward (5′-ACACGGTCCACAGCTCATC-3′) and reverse (5′-TGTCAATCAAATCCATGTCCTG-3′); hNQO1, forward (5′-ATGTATGACAAAGGACCCTTCC-3′) and reverse (5′-TCCCTTGCAGAGAGTACATGG-3′); hHO-1, forward (5′-AACTTTCAGAAGGGCCAGGT-3′) and reverse (5′-CTGGGCTCTCCTTGTTGC-3′); hHrd1, forward (5′-CCAGTACCTCACCGTGCTG-3′) and reverse (5′-GCCTCTGAGCTAGGGATGC-3′); hGAPDH, forward (5′-CTGACTTCAACAGCGACACC-3′) and reverse (5′-TGCTGTAGCCAAATTCGTTGT-3′); mNrf2, forward (5′-TTTTCCATTCCCGAATTACAGT-3′) and reverse (5′-AGGAGATCGATGAGTAAAAATGGT-3′); and mNQO1, forward (5′-AGGGTTCGGTATTACGATCC-3′) and reverse (5′-AGTACAATCAGGGCTCTTCTCG-3′). qRT-PCR was performed on the LightCycler 480 system (Roche) as follows: one cycle of initial denaturation (4 min at 95°C), 45 cycles of amplification (10 sec at 95°C and 30 sec at 60°C), and a cooling period. The data presented are relative mRNA levels normalized to the level of GAPDH, and the value from the untreated cells was set as 1. PCR assays were performed three times with duplicate samples, which were used to determine the means ± standard deviations. Student's t-test was used to evaluate statistically significant differences.
XBP1 splicing assay
The XBP1 splicing assay was performed as previously described (Calfon et al. 2002). In brief, RNA from XBP1+/+ and XBP1−/− MEF cells were reverse-transcribed, followed by PCR using the sense primer (5′-AAACAGAGTAGCAGCGCAGACTGC-3′) and the antisense primer (5′-TCCTTCTGGGTAGACCTCTGGGAG-3′). PCR products were resolved on 2.5% (w/v) agarose gels, stained with ethidium bromide, and visualized.
Analysis of lipid peroxidation
Liver samples were analyzed in an indirect assessment for lipid peroxidation using the thiobarbituric acid-reactive substances (TBARS) assay kit (Cayman Chemical). Liver samples were homogenized in RIPA buffer (50 mM Tris-HCl at pH 7.6, containing 150 mM sodium chloride, 1% NP-40, 0.5% sodium deoxycholate, 0.1% SDS) with protease inhibitors. The assay was then carried out according to the manufacturer's instructions and analyzed by reading absorbance at 540 nm.
Terminal dUTP nick end-labeling (TUNEL) staining
Apoptotic cell death in liver tissues was detected using TUNEL, an in situ cell death detection kit (Roche), according to the manufacturer's instruction. Images were taken using a fluorescence microscope (Zeiss Observer Z1, Marianas digital microscopy workstation).
Statistical analysis
Data are presented as means ± SD. Differences were determined by two-tailed Student's t-test. A P-value <0.05 was considered significant.
Acknowledgments
This study was funded by ES015010 and CA154377 (to D.D.Z.), AI079056 (to D.F.), and ES006694 (a center grant).
Footnotes
Supplemental material is available for this article.
Article published online ahead of print. Article and publication date are online at http://www.genesdev.org/cgi/doi/10.1101/gad.238246.114.
References
- Amano T, Yamasaki S, Yagishita N, Tsuchimochi K, Shin H, Kawahara K, Aratani S, Fujita H, Zhang L, Ikeda R, et al. 2003. Synoviolin/Hrd1, an E3 ubiquitin ligase, as a novel pathogenic factor for arthropathy. Genes Dev 17: 2436–2449 [DOI] [PMC free article] [PubMed] [Google Scholar]
- Calfon M, Zeng H, Urano F, Till JH, Hubbard SR, Harding HP, Clark SG, Ron D 2002. IRE1 couples endoplasmic reticulum load to secretory capacity by processing the XBP-1 mRNA. Nature 415: 92–96 [DOI] [PubMed] [Google Scholar]
- Carvalho P, Goder V, Rapoport TA 2006. Distinct ubiquitin-ligase complexes define convergent pathways for the degradation of ER proteins. Cell 126: 361–373 [DOI] [PubMed] [Google Scholar]
- Chen W, Sun Z, Wang XJ, Jiang T, Huang Z, Fang D, Zhang DD 2009. Direct interaction between Nrf2 and p21(Cip1/WAF1) upregulates the Nrf2-mediated antioxidant response. Mol Cell 34: 663–673 [DOI] [PMC free article] [PubMed] [Google Scholar]
- Chen S, Zou L, Li L, Wu T 2013. The protective effect of glycyrrhetinic acid on carbon tetrachloride-induced chronic liver fibrosis in mice via upregulation of Nrf2. PLoS ONE 8: e53662. [DOI] [PMC free article] [PubMed] [Google Scholar]
- Chowdhry S, Zhang Y, McMahon M, Sutherland C, Cuadrado A, Hayes JD 2013. Nrf2 is controlled by two distinct β-TrCP recognition motifs in its Neh6 domain, one of which can be modulated by GSK-3 activity. Oncogene 32: 3765–3781 [DOI] [PMC free article] [PubMed] [Google Scholar]
- Cross BC, Bond PJ, Sadowski PG, Jha BK, Zak J, Goodman JM, Silverman RH, Neubert TA, Baxendale IR, Ron D, et al. 2012. The molecular basis for selective inhibition of unconventional mRNA splicing by an IRE1-binding small molecule. Proc Natl Acad Sci 109: E869–E878 [DOI] [PMC free article] [PubMed] [Google Scholar]
- Gao B, Lee SM, Chen A, Zhang J, Zhang DD, Kannan K, Ortmann RA, Fang D 2008. Synoviolin promotes IRE1 ubiquitination and degradation in synovial fibroblasts from mice with collagen-induced arthritis. EMBO Rep 9: 480–485 [DOI] [PMC free article] [PubMed] [Google Scholar]
- Hasegawa D, Fujii R, Yagishita N, Matsumoto N, Aratani S, Izumi T, Azakami K, Nakazawa M, Fujita H, Sato T, et al. 2010. E3 ubiquitin ligase synoviolin is involved in liver fibrogenesis. PLoS ONE 5: e13590. [DOI] [PMC free article] [PubMed] [Google Scholar]
- Hernandez-Gea V, Friedman SL 2011. Pathogenesis of liver fibrosis. Annu Rev Pathol 6: 425–456 [DOI] [PubMed] [Google Scholar]
- Itoh K, Wakabayashi N, Katoh Y, Ishii T, Igarashi K, Engel JD, Yamamoto M 1999. Keap1 represses nuclear activation of antioxidant responsive elements by Nrf2 through binding to the amino-terminal Neh2 domain. Genes Dev 13: 76–86 [DOI] [PMC free article] [PubMed] [Google Scholar]
- Jaramillo MC, Zhang DD 2013. The emerging role of the Nrf2–Keap1 signaling pathway in cancer. Genes Dev 27: 2179–2191 [DOI] [PMC free article] [PubMed] [Google Scholar]
- Jiang T, Huang Z, Chan JY, Zhang DD 2009. Nrf2 protects against As(III)-induced damage in mouse liver and bladder. Toxicol Appl Pharmacol 240: 8–14 [DOI] [PMC free article] [PubMed] [Google Scholar]
- Kawata K, Kobayashi Y, Souda K, Kawamura K, Sumiyoshi S, Takahashi Y, Noritake H, Watanabe S, Suehiro T, Nakamura H 2010. Enhanced hepatic Nrf2 activation after ursodeoxycholic acid treatment in patients with primary biliary cirrhosis. Antioxid Redox Signal 13: 259–268 [DOI] [PubMed] [Google Scholar]
- Kensler TW, Wakabayashi N, Biswal S 2007. Cell survival responses to environmental stresses via the Keap1–Nrf2–ARE pathway. Annu Rev Pharmacol Toxicol 47: 89–116 [DOI] [PubMed] [Google Scholar]
- Kobayashi A, Kang MI, Okawa H, Ohtsuji M, Zenke Y, Chiba T, Igarashi K, Yamamoto M 2004. Oxidative stress sensor Keap1 functions as an adaptor for Cul3-based E3 ligase to regulate proteasomal degradation of Nrf2. Mol Cell Biol 24: 7130–7139 [DOI] [PMC free article] [PubMed] [Google Scholar]
- Kurzawski M, Dziedziejko V, Urasinska E, Post M, Wojcicki M, Mietkiewski J, Drozdzik M 2012. Nuclear factor erythroid 2-like 2 (Nrf2) expression in end-stage liver disease. Environ Toxicol Pharmacol 34: 87–95 [DOI] [PubMed] [Google Scholar]
- Lotersztajn S, Julien B, Teixeira-Clerc F, Grenard P, Mallat A 2005. Hepatic fibrosis: molecular mechanisms and drug targets. Annu Rev Pharmacol Toxicol 45: 605–628 [DOI] [PubMed] [Google Scholar]
- Ma Q, He X 2012. Molecular basis of electrophilic and oxidative defense: promises and perils of Nrf2. Pharmacol Rev 64: 1055–1081 [DOI] [PMC free article] [PubMed] [Google Scholar]
- Magesh S, Chen Y, Hu L 2012. Small molecule modulators of Keap1–Nrf2–ARE pathway as potential preventive and therapeutic agents. Med Res Rev 32: 687–726 [DOI] [PMC free article] [PubMed] [Google Scholar]
- McMahon M, Thomas N, Itoh K, Yamamoto M, Hayes JD 2006. Dimerization of substrate adaptors can facilitate cullin-mediated ubiquitylation of proteins by a ‘tethering’ mechanism: a two-site interaction model for the Nrf2–Keap1 complex. J Biol Chem 281: 24756–24768 [DOI] [PubMed] [Google Scholar]
- More VR, Cheng Q, Donepudi AC, Buckley DB, Lu ZJ, Cherrington NJ, Slitt AL 2013. Alcohol cirrhosis alters nuclear receptor and drug transporter expression in human liver. Drug Metab Dispos 41: 1148–1155 [DOI] [PMC free article] [PubMed] [Google Scholar]
- Mu YP, Ogawa T, Kawada N 2010. Reversibility of fibrosis, inflammation, and endoplasmic reticulum stress in the liver of rats fed a methionine-choline-deficient diet. Lab Invest 90: 245–256 [DOI] [PubMed] [Google Scholar]
- Nair S, Xu C, Shen G, Hebbar V, Gopalakrishnan A, Hu R, Jain MR, Liew C, Chan JY, Kong AN 2007. Toxicogenomics of endoplasmic reticulum stress inducer tunicamycin in the small intestine and liver of Nrf2 knockout and C57BL/6J mice. Toxicol Lett 168: 21–39 [DOI] [PMC free article] [PubMed] [Google Scholar]
- Qiu Q, Zheng Z, Chang L, Zhao YS, Tan C, Dandekar A, Zhang Z, Lin Z, Gui M, Li X, et al. 2013. Toll-like receptor-mediated IRE1α activation as a therapeutic target for inflammatory arthritis. EMBO J 32: 2477–2490 [DOI] [PMC free article] [PubMed] [Google Scholar]
- Rada P, Rojo AI, Chowdhry S, McMahon M, Hayes JD, Cuadrado A 2011. SCF/β-TrCP promotes glycogen synthase kinase 3-dependent degradation of the Nrf2 transcription factor in a Keap1-independent manner. Mol Cell Biol 31: 1121–1133 [DOI] [PMC free article] [PubMed] [Google Scholar]
- Rada P, Rojo AI, Evrard-Todeschi N, Innamorato NG, Cotte A, Jaworski T, Tobon-Velasco JC, Devijver H, Garcia-Mayoral MF, Van Leuven F, et al. 2012. Structural and functional characterization of Nrf2 degradation by the glycogen synthase kinase 3/β-TrCP axis. Mol Cell Biol 32: 3486–3499 [DOI] [PMC free article] [PubMed] [Google Scholar]
- Ramani K, Tomasi ML, Yang H, Ko K, Lu SC 2012. Mechanism and significance of changes in glutamate-cysteine ligase expression during hepatic fibrogenesis. J Biol Chem 287: 36341–36355 [DOI] [PMC free article] [PubMed] [Google Scholar]
- Steffen J, Seeger M, Koch A, Kruger E 2010. Proteasomal degradation is transcriptionally controlled by TCF11 via an ERAD-dependent feedback loop. Mol Cell 40: 147–158 [DOI] [PubMed] [Google Scholar]
- Sun Z, Zhang S, Chan JY, Zhang DD 2007. Keap1 controls postinduction repression of the Nrf2-mediated antioxidant response by escorting nuclear export of Nrf2. Mol Cell Biol 27: 6334–6349 [DOI] [PMC free article] [PubMed] [Google Scholar]
- Sun Z, Chin YE, Zhang DD 2009. Acetylation of Nrf2 by p300/CBP augments promoter-specific DNA binding of Nrf2 during the antioxidant response. Mol Cell Biol 29: 2658–2672 [DOI] [PMC free article] [PubMed] [Google Scholar]
- Sykiotis GP, Bohmann D 2010. Stress-activated cap'n'collar transcription factors in aging and human disease. Sci Signal 3: re3. [DOI] [PMC free article] [PubMed] [Google Scholar]
- Tanabe C, Maeda T, Zou K, Liu J, Liu S, Nakajima T, Komano H 2012. The ubiquitin ligase synoviolin up-regulates amyloid β production by targeting a negative regulator of γ-secretase, Rer1, for degradation. J Biol Chem 287: 44203–44211 [DOI] [PMC free article] [PubMed] [Google Scholar]
- Tong KI, Kobayashi A, Katsuoka F, Yamamoto M 2006. Two-site substrate recognition model for the Keap1–Nrf2 system: a hinge and latch mechanism. Biol Chem 387: 1311–1320 [DOI] [PubMed] [Google Scholar]
- Travers KJ, Patil CK, Wodicka L, Lockhart DJ, Weissman JS, Walter P 2000. Functional and genomic analyses reveal an essential coordination between the unfolded protein response and ER-associated degradation. Cell 101: 249–258 [DOI] [PubMed] [Google Scholar]
- Tsang KY, Chan D, Bateman JF, Cheah KS 2010. In vivo cellular adaptation to ER stress: survival strategies with double-edged consequences. J Cell Sci 123: 2145–2154 [DOI] [PubMed] [Google Scholar]
- Tsuchiya Y, Morita T, Kim M, Iemura S, Natsume T, Yamamoto M, Kobayashi A 2011. Dual regulation of the transcriptional activity of Nrf1 by β-TrCP- and Hrd1-dependent degradation mechanisms. Mol Cell Biol 31: 4500–4512 [DOI] [PMC free article] [PubMed] [Google Scholar]
- Wang JQ, Chen X, Zhang C, Tao L, Zhang ZH, Liu XQ, Xu YB, Wang H, Li J, Xu DX 2013. Phenylbutyric acid protects against carbon tetrachloride-induced hepatic fibrogenesis in mice. Toxicol Appl Pharmacol 266: 307–316 [DOI] [PubMed] [Google Scholar]
- Wynn TA, Ramalingam TR 2012. Mechanisms of fibrosis: therapeutic translation for fibrotic disease. Nat Med 18: 1028–1040 [DOI] [PMC free article] [PubMed] [Google Scholar]
- Yagishita N, Ohneda K, Amano T, Yamasaki S, Sugiura A, Tsuchimochi K, Shin H, Kawahara K, Ohneda O, Ohta T, et al. 2005. Essential role of synoviolin in embryogenesis. J Biol Chem 280: 7909–7916 [DOI] [PubMed] [Google Scholar]
- Yagishita N, Aratani S, Leach C, Amano T, Yamano Y, Nakatani K, Nishioka K, Nakajima T 2012. RING-finger type E3 ubiquitin ligase inhibitors as novel candidates for the treatment of rheumatoid arthritis. Int J Mol Med 30: 1281–1286 [DOI] [PMC free article] [PubMed] [Google Scholar]
- Yamamoto K, Suzuki N, Wada T, Okada T, Yoshida H, Kaufman RJ, Mori K 2008. Human HRD1 promoter carries a functional unfolded protein response element to which XBP1 but not ATF6 directly binds. J Biochem 144: 477–486 [DOI] [PMC free article] [PubMed] [Google Scholar]
- Yamasaki S, Yagishita N, Sasaki T, Nakazawa M, Kato Y, Yamadera T, Bae E, Toriyama S, Ikeda R, Zhang L, et al. 2007. Cytoplasmic destruction of p53 by the endoplasmic reticulum-resident ubiquitin ligase ‘synoviolin’. EMBO J 26: 113–122 [DOI] [PMC free article] [PubMed] [Google Scholar]
- Yoshida H, Matsui T, Yamamoto A, Okada T, Mori K 2001. XBP1 mRNA is induced by ATF6 and spliced by IRE1 in response to ER stress to produce a highly active transcription factor. Cell 107: 881–891 [DOI] [PubMed] [Google Scholar]
- Zhang DD, Hannink M 2003. Distinct cysteine residues in Keap1 are required for Keap1-dependent ubiquitination of Nrf2 and for stabilization of Nrf2 by chemopreventive agents and oxidative stress. Mol Cell Biol 23: 8137–8151 [DOI] [PMC free article] [PubMed] [Google Scholar]
- Zhang DD, Lo SC, Cross JV, Templeton DJ, Hannink M 2004. Keap1 is a redox-regulated substrate adaptor protein for a Cul3-dependent ubiquitin ligase complex. Mol Cell Biol 24: 10941–10953 [DOI] [PMC free article] [PubMed] [Google Scholar]
- Zhang Y, Crouch DH, Yamamoto M, Hayes JD 2006. Negative regulation of the Nrf1 transcription factor by its N-terminal domain is independent of Keap1: Nrf1, but not Nrf2, is targeted to the endoplasmic reticulum. Biochem J 399: 373–385 [DOI] [PMC free article] [PubMed] [Google Scholar]
- Zheng H, Whitman SA, Wu W, Wondrak GT, Wong PK, Fang D, Zhang DD 2011a. Therapeutic potential of Nrf2 activators in streptozotocin-induced diabetic nephropathy. Diabetes 60: 3055–3066 [DOI] [PMC free article] [PubMed] [Google Scholar]
- Zheng Z, Zhang C, Zhang K 2011b. Measurement of ER stress response and inflammation in the mouse model of nonalcoholic fatty liver disease. Methods Enzymol 489: 329–348 [DOI] [PubMed] [Google Scholar]