

Abstract
Resting state electroencephalogram (EEG) abnormalities in schizophrenia and bipolar disorder patients suggest alterations in neural oscillatory activity. However, few studies directly compare these anomalies between patient groups, and none have examined EEG coherence. Therefore, this study investigated whether these electrophysiological characteristics differentiate clinical populations from one another, and from non-psychiatric controls. To address this question, resting EEG power and coherence were assessed in 76 bipolar patients (BP), 132 schizophrenia patients (SZ), and 136 non-psychiatric controls (NC). We conducted separate repeated-measures ANOVAs to examine group differences within seven frequency bands across several brain regions. BP showed significantly greater power relative to SZ at higher frequencies including Beta and Gamma across all regions. In terms of intra-hemispheric coherence, while SZ generally exhibited higher coherence at Delta compared to NC and BP, both SZ and BP showed higher coherence at Alpha1 and Alpha2. In contrast, BP and HC showed higher coherence within hemispheres compared to SZ at Beta 1. In terms of inter-hemispheric coherence, SZ displayed higher coherence compared to NC at temporal sites at both Alpha1 and Alpha2. Taken together, BP exhibited increased high frequency power with few disruptions in neural synchronization. In contrast, SZ generally exhibited enhanced synchronization within and across hemispheres. These findings suggest that resting EEG can be a sensitive measure for differentiating between clinical disorders.
Keywords: resting state, EEG, power, neural synchronization, bipolar disorder, schizophrenia
Introduction
Electrophysiological activity at rest reliably differentiates healthy individuals from neuropsychiatric populations, including SZ and BP (Barry et al. 2003; Thibodeau et al. 2006). Importantly, resting state EEG has been indirectly linked to variations in cognitive task performance (Stam et al. 2002; Finnigan and Robertson 2011); moreover, EEG synchronization appears to support the communication between distinct neural regions which may facilitate coherent cognition and behaviour (Varela et al. 2001; Ward 2003). Therefore, disruptions in resting EEG may indicate disturbances in neural interactions that support cognition and arousal in the absence of task-related activity. In this study, the utility of resting EEG measures in characterizing and distinguishing SZ and BP was evaluated.
Resting EEG Power and Coherence
Oscillations of electrical activity recorded by EEG reflect synchronized neuronal activity (Nuñez et al. 2000). Power within specified frequency bands indexes the average magnitude of oscillations over a specified time range, and coherence measures the extent of oscillatory coupling between two signals independent of their power. Both power and coherence of electrical activity during rest have been associated with fMRI measures of Default Mode Network (DMN) functioning (Britz et al. 2010; Laufs 2008). The DMN is a resting state network that includes the precuneus, posterior cingulate cortex, medial prefrontal cortex and temporoparietal junction (Gusnard and Raichle 2001; Hlinka et al. 2010), and is generally more active at rest than during task performance (Greicius et al. 2003; Li et al. 2002). DMN is thought to be involved in self-referential thought (Northoff et al. 2006; van der Meer et al. 2010; Fingelkurts and Fingelkurts 2011; Kim 2012) and autobiographical memory retrieval (Svoboda et al. 2006; Kim 2012), both of which are disturbed in psychotic disorders (Iqbal et al. 2004; Fisher et al. 2008; Holt et al. 2011). While fMRI studies have characterized the spatial distribution of resting state networks, EEG measures offer unique information on the strength and synchronization of neuronal activity at high temporal frequencies.
EEG Power and Coherence Abnormalities in Schizophrenia
A consistent EEG finding during rest in SZ is augmented low-frequency power at delta and theta (Gattaz et al. 1992; Clementz et al. 1994; Sponheim et al. 1994, 2000). This anomaly has been observed in medication-free patients (Miyauchi et al. 1996), across medication status (Gattaz et al. 1992) and regardless of duration of illness (Sponheim et al. 1994). EEG studies of patients and their relatives have reported increased low-frequency power in patients only (Clementz et al. 1994; Venables et al. 2009), indicating increased low frequency power could be associated with psychotic symptoms rather than familial risk.
Studies investigating EEG coherence in SZ are less consistent. On one hand, several studies have reported increased coherence at rest (Merrin et al. 1989; Nagase et al. 1992; Mann et al. 1997; Wada et al. 1998). Specifically, delta oscillations at rest were increased in SZ both within a hemisphere (Wada et al. 1998) and across hemispheres (Nagase et al. 1992). Likewise, increased intra-hemispheric coherence during rest across all frequency bands was observed in patients and their relatives (Mann et al. 1997). However, Yeragani and colleagues reported reduced inter-hemispheric coherence in the beta and gamma range in SZ (Yeragani et al. 2006). Taken together, increased low-frequency power and coherence may characterize resting EEG in SZ.
EEG Power and Coherence Abnormalities in Bipolar Disorder
Evidence for EEG abnormalities in BP is less well characterized than in SZ. With respect to spectral power, El Badri and colleagues found increased power at all frequencies (although markedly in the beta band) in BP relative to NC (El-Badri et al. 2001), whereas Başar and colleagues reported reduced alpha power in euthymic patients (Başar et al. 2012). Further, dysfunctional long-range connectivity appears to be more consistently observed in BP. For example, reduced long-range alpha coherence between frontal-temporal regions was found during rest in manic patients (Bhattacharya 2001), and in the beta band during rest in euthymic patients (Chen et al. 2008).
The Current Study
Despite the potential for EEG abnormalities to provide insight into the neurophysiology of disease processes, studies that measure EEG power and coherence in both SZ and BP are rare (for exceptions, see (Clementz et al. 1994). The one study that directly compared these two populations restricted their analyses to frequency amplitudes (i.e. the square root of power) at central electrodes (Clementz et al. 1994). Another study compared SZ with their first-degree biological relatives, and BP with their relatives on frequency amplitudes, but did not directly contrast the two patient groups (Venables et al. 2009). The current study evaluated whether resting EEG power and coherence measures across a wide frequency range can differentiate BP and SZ from NC, and whether EEG measures can distinguish these two psychiatric disorders. Given previous findings, we predicted that both 1) low-frequency EEG power and 2) coherence across frequency bands would be increased in SZ, and 3) inter-hemispheric coherence at alpha and beta would be reduced in BP.
Methods
Participants
76 BP (40 females, 18 unmedicated), 132 SZ (41 females, 19 unmedicated1), and 136 NC (76 females) participated in the study. Table 1 presents demographic, medication, and clinical information. NC were recruited by public advertisements, and patients were recruited through physician referrals. Exclusion criteria included serious head injury (with loss of consciousness > 5 minutes), neurological disorders, and intoxication (either drug or alcohol use assessed via urine screen) at the time of testing. NC were free of Axis I disorders, did not have a first-degree biological relative with either schizophrenia or bipolar disorder, and were not taking psychotropic medication. All participants provided written informed consent. This study was approved by the Indiana University Internal review board.
Table 1.
Demographic, clinical, neuropsychological, and illness characteristics of BP, SZ and NC.
| Bipolar Patients (n=76) | Schizophrenia Patients (n=132) | Nonpsychiatric Controls (n=136) | |
|---|---|---|---|
| Age a | 41 | 40 | 39 |
| Female gender (N, %) b | 40, 53% | 40, 30% | 76, 56% |
| Level of education c | Some college | High school | Some college |
|
| |||
| Clinical Measures d | |||
|
| |||
| YMRS (mean, SD) | 14.4 (10.3) | - | - |
| MADRS (mean, SD) | 12.0 (9.5) | - | - |
| PANSS (mean, SD) | - | 62.1 (16.7) | - |
|
| |||
| Medication Status and Type | |||
|
| |||
| Currently taking medication (N) e | 55 | 112 | 0 |
| Atypical Antipsychotics f | 31 | 95 | - |
| Typical Antipsychotics | 6 | 25 | - |
| Antidepressants | 20 | 46 | - |
| Anticonvulsants | 27 | 31 | - |
| Anticholinergics | 2 | 24 | - |
| Benzodiazepine | 17 | 21 | - |
| Lithium | 15 | 5 | - |
| Antiparkisonians | 1 | 4 | - |
Age of participants did not significantly differ across groups (F(2,341)=0.94, p=.390).
The number of female participants significantly differed across groups (χ2(2)=19.77, p<.001).
Educational level significantly differed across the three groups (F(2,299)=36.82, p<.001).
YMRS scores of 15 BP were missing, MADRS scores of 14 BP were missing, and PANSS scores of 37 SZ were missing.
The number of patients taking medication between the two clinical groups significantly differed from each other (χ2(4)=228.92, p<.001).
Some patients were prescribed more than one type of medication, as such the sum across the various medication types exceeds the number of subjects currently on medication.
The mood and psychosis disorders sections of the Structured Clinical Interview for DSM Disorders Research Edition (SCID-IP Modules A-D) were administered to each participant by two of the authors (C.A.B. & A.R.B.) or a trained research assistant. In addition, BP also completed the Young Mania Rating Scale (YMRS) and the Montgomery-Asberg Depression Rating Scale (MADRS), whereas the SZ completed the Positive and Negative Syndrome Scale (PANSS). Diagnoses were made on the basis of the structured interviews in conjunction with medical records.
Electrophysiological Data Collection and Processing
Participants sat in a dimly lit room and were instructed to sit still with their eyes closed for 3 minutes (Clementz et al. 1994; Sponheim et al. 1994, 2000). 32 channels of EEG were recorded using Ag/AgCl electrodes with a nose reference (Falk-Minow Services, Munich, Germany) and Neuroscan SYNAMPS recording system (Neuroscan, Inc., El Paso, TX, USA). EEG signals were digitized at the rate of 1000 Hz with a 0.10 Hz high-pass filter and a 200 Hz low-pass filter. Electrode impedances were kept below 10 kΩ Vertical and horizontal electrooculograms (EOGs) were monitored by an electrode located inferior to the right eye, and two electrodes on the right and left outer canthus, respectively.
EEG data were processed offline using BrainVision Analyzer software (Brain Products, GmbH, Gilching, Germany). A 0.5 Hz high-pass digital filter with a 24dB/octave roll-off was used to attenuate low frequency artifacts, as well as a 60 Hz notch filter to remove line noise. Activity that exceeded +/− 100 μV was removed and blinks were initially corrected using an algorithm (Gratton et al. 1983). Participants were included in subsequent analyses only if they had at least 50 s of artifact-free EEG data (Lund et al. 1995). There were no significant differences in the average duration of artifact-free EEG data segments across patient groups (SZ: M=149s, SD=35.75, BP: M=146s, SD=39.20, NC: M=151s, SD=34.16; p>.50).
Corrected EEG data was then transformed into reference-free current source density (CSD) estimates using a spherical Laplacian algorithm (Nunez et al. 1997; Mima and Hallett 1999), which addressed several issues that may confound coherence between two scalp electrodes. For one, many of the commonly used referencing approaches, namely nose reference, linked earlobe or mastoid reference, and average reference, have all been shown to result in incorrect coherence estimates to a varying degrees (e.g., Fein et al. 1988; Nunez et al. 1997; Mima and Hallett 1999; Schiff 2005). Using this reference-free measure would thus circumvent problems associated with the choice of reference (Nunez et al. 1997; Mima and Hallett 1999). Further, this step removed volume conduction effects, which ensures the observed local coherence was not the consequence of two neighboring electrodes receiving signals from the same source (Nunez et al. 1997). In other words, CSD estimates more accurately index the source of neuronal activity from the underlying generators (Nunez et al. 1997; Tenke and Kayser 2012). Given minimal effects of reference and volume conduction on CSD estimates, coherence measures based on these estimates would more truthfully capture the relationship between two electrodes. CSD estimates were computed using the 4th order spherical spline interpolation, and a maximal degree of Legendre polynomials of 10 (Perrin et al., 1989).
Finally, we used independent component analysis (ICA) to further correct for ocular artifacts, such as microsaccades. ICA provides a more stringent method for correcting artifact, and it appears to effectively eliminate ocular artifacts that may have been overlooked in the aforementioned conventional threshold-based artifact rejection procedure (Keren et al. 2010; McMenamin et al. 2010; Shackman et al. 2010; Delorme et al. 2012). The ocular correction ICA was performed using the value trigger algorithm in semiautomatic mode to detect components associated with eye movements (Makeig et al. 1997). Decomposition of components was performed with the biased, extended Infomax method on whole data with all the channels included. All subsequent computations were performed on the reference-free CSD estimates that were corrected for artifacts.
Power (μV2)
The corrected data were segmented into non-overlapping 2.048 s epochs, and fast-Fourier transforms were conducted using a Hanning window with 10% taper length. Each participant’s data were averaged across the epochs for each electrode, and the mean absolute power was computed for each of the following frequency bands: Delta (0.5–4 Hz), Theta (4–8 Hz), Alpha1 (8–10 Hz), Alpha2 (10–12 Hz), Beta1 (12–20 Hz), Beta2 (20–30 Hz), and Gamma (30–50 Hz). A natural log transform was computed for all EEG power variables and individual electrodes were aggregated to create an average for the following regions: frontal (F7, F3, Fz, F4, F8), central (C3, Cz, C4), parietal (P7, P3, Pz, P4, P8), and temporal (FT7, T7, FT8, T8).
Coherence
Coherence was calculated within BrainVision Analyzer using the following equation: , where CS(c1, c2)(f) = Σ c1, i (f) c2, i (f). For the same frequency bands as above, coherence values were computed from the cross spectrum of selected electrode pairs. Specifically, intrahemipsheric coherence was examined through electrode pairs F3-C3, F3-P3, F3-T7, C3-P3, C3-T7, P3-T7 on the left hemisphere, and F4-C4, F4-P4, F4-T8, C4-P4, C4-T8, P4-T8 on the right hemisphere. In addition, inter-hemispheric coherence was calculated between electrode pairs F3-F4, C3-C4, P3-P4, and T7-T8. All EEG coherence variables were transformed using an arcsin transform (Jelic et al. 2000) to better approximate a normal distribution.
Statistical Analysis
Preliminary analyses revealed that age, gender, and medication status showed systematic relationships with one or both diagnostic groups (see Table 1), therefore they were included as covariates in all power and coherence analyses. Participants with power values exceeding 3 times the interquartile range of the grand average within each diagnostic group for a particular frequency band at any region were excluded from the corresponding analysis. Significant main effects were followed up with post-hoc pairwise comparisons, which were adjusted using a Bonferroni correction. When assumption of sphericity was violated, the Greenhouse-Geisser estimates were reported. All statistical analyses were conducted in SPSS 16.0 (SPSS Inc., Chicago, IL, USA).
Power
Group differences in resting EEG power and topography were examined via repeated-measures ANOVA for each of the 7 frequency bands. Each omnibus ANOVA included one between-subject factor (Diagnosis: BD, SZ, and NC), and one within-subject factor (Regions: frontal, central, parietal, and temporal). To follow up significant interactions, we conducted one-way ANOVAs for each region.
Coherence
Separate repeated measures ANOVAs were conducted for the intra-hemispheric and inter-hemispheric electrode pairs for each of the 7 frequency bands. To examine coherence within hemisphere, we conducted omnibus ANOVAs with intra-hemispheric pairs that included one between-subject factor (Diagnosis), and two within-subject factors (Hemisphere: left, right; Region: fronto-central, fronto-parietal, fronto-temporal, centro-parietal, centro-temporal, parieto-temporal). To examine coherence across hemisphere, we conducted omnibus ANOVAs with inter-hemispheric pairs that included one between-subject factor (Diagnosis), and one within-subject factor (Region: frontal, central, parietal, temporal). To follow up significant interactions, we conducted one-way or two-way ANOVAs for each region or hemisphere.
Results
Demographics and Medical Characteristics
Analyses revealed age and gender effects on EEG power. Age was negatively correlated with Delta, Theta and Alpha2 power in the frontal region (all p<.05), but positively correlated with Beta1 and Beta2 power in the central region (all p<.05). There were also significant differences between genders in EEG power across all regions at Theta and both Alpha and Beta frequency ranges (all p<.05), with females displaying higher EEG power than men.
We conducted repeated measures ANOVAs to examine medication effects on EEG power. In BP, no significant effects of Medication were detected at any frequency. In SZ, there was a significant effect of Medication (F(1,129)=6.25, p=.014) at Alpha2, with unmedicated patients exhibiting greater power than medicated patients. There was also a significant Region by Medication interaction (F(3,387)=3.46, p=.024), driven by parietal (p=.002) and temporal regions (p=.014) only, whereby unmedicated patients showed greater power than patients on medication. At Beta1, there was a significant Region × Medication interaction (F(3,387)=3.15, p=.034) that was driven by the parietal region only (p=.009), with unmedicated patients displaying greater power. To account for these effects on our EEG variables, we included age, gender, and medication status as covariates in all subsequent analyses.
Power
The results of the omnibus repeated measures ANOVAs at each frequency band are presented in Table 2. There was a significant main effect of Region at every frequency band. Accordingly, one omnibus ANOVA was calculated that included all frequencies, and found a significant main effect of Region (F(3,1014)=19.91, p<.001). EEG power at the temporal region was highest, followed by parietal, frontal then central region (all p<.001, except for parietal vs. temporal). The average EEG power of each region for each frequency for each of the three subject groups is presented in Table 3.
Table 2.
Repeated measures ANOVAs of resting EEG frequency power among BP, SZ and NC.
| Frequency Band | ANOVA
|
||
|---|---|---|---|
| Df | F | p value | |
| Delta | |||
| Diagnosis | 2,338 | 1.16 | .314 |
| Diagnosis × Region | 6,1014 | 1.18 | .318 |
| Theta | |||
| Diagnosis | 2,338 | 0.52 | .597 |
| Diagnosis × Region | 6,1014 | 1.83 | .102 |
| Alpha 1 | |||
| Diagnosis | 2,338 | 0.21 | .808 |
| Diagnosis × Region | 6,1014 | 2.37 | .036 |
| Alpha 2 | |||
| Diagnosis | 2,338 | 1.27 | .282 |
| Diagnosis × Region | 6,1014 | 3.17 | .007 |
| Beta 1 | |||
| Diagnosis | 2,338 | 4.61 | .011 |
| Diagnosis × Region | 6,1014 | 3.84 | .002 |
| Beta 2 | |||
| Diagnosis | 2,338 | 6.06 | .003 |
| Diagnosis × Region | 6,1014 | 0.82 | .525 |
| Gamma | |||
| Diagnosis | 2,338 | 3.62 | .028 |
| Diagnosis × Region | 6,1014 | 1.24 | .291 |
Table 3.
Mean EEG power (and standard deviation) by Region and Frequency Band for BP, SZ and NC.
| EEG Frequency Power | Region | Bipolar Patients (n=76) | Schizophrenia Patients (n=132) | Controls Subjects (n = 136) |
|---|---|---|---|---|
| Delta | ||||
| Frontal | 8.40 (11.20) | 10.07 (16.92) | 7.29 (6.78) | |
| Central | 5.60 (8.13) | 5.72 (8.96) | 4.60 (5.81) | |
| Parietal | 6.93 (8.45) | 8.14 (8.46) | 5.76 (4.82) | |
| Temporal | 9.21 (13.77) | 9.26 (12.20) | 7.12 (7.75) | |
| Theta | ||||
| Frontal | 1.31 (1.22) | 1.81 (1.91) | 1.42 (1.10) | |
| Central | 1.27 (1.14) | 1.52 (2.25) | 1.34 (1.76) | |
| Parietal | 2.16 (2.58) | 2.73 (3.68) | 2.08 (2.20) | |
| Temporal | 1.54 (1.39) | 1.86 (2.00) | 1.46 (1.31) | |
| Alpha 1 | ||||
| Frontal | 1.66 (1.47) | 1.83 (1.99) | 1.76 (1.88) | |
| Central | 2.61 (3.05) | 2.39 (3.35) | 2.78 (4.13) | |
| Parietal | 7.22 (8.51) | 6.84 (8.69) | 7.49 (10.97) | |
| Temporal | 3.39 (3.16) | 3.48 (4.95) | 3.69 (5.33) | |
| Alpha 2 | ||||
| Frontal | 1.26 (1.33) | 1.12 (1.18) | 1.26 (1.26) | |
| Central | 2.44 (2.44) | 1.75 (2.03) | 2.89 (3.80) | |
| Parietal | 7.71 (10.98) | 4.74 (6.02) | 8.08 (11.30) | |
| Temporal | 2.87 (2.97) | 2.33 (2.97) | 3.06 (6.09) | |
| Beta 1 | ||||
| Frontal | 0.70 (0.70) | 0.51 (0.45) | 0.61 (0.47) | |
| Central | 0.82 (0.70) | 0.49 (0.44) | 0.69 (0.69) | |
| Parietal | 1.09 (1.00) | 0.70 (0.66) | 0.99 (1.03) | |
| Temporal | 0.82 (0.60) | 0.59 (0.42) | 0.77 (0.73) | |
| Beta 2 | ||||
| Frontal | 0.61 (0.77) | 0.38 (0.50) | 0.59 (0.84) | |
| Central | 0.47 (0.43) | 0.28 (0.24) | 0.43 (0.49) | |
| Parietal | 0.38 (0.33) | 0.26 (0.23) | 0.39 (0.61) | |
| Temporal | 0.59 (0.59) | 0.40 (0.37) | 0.65 (0.94) | |
| Gamma | ||||
| Frontal | 0.39 (0.69) | 0.25 (0.33) | 0.37 (0.56) | |
| Central | 0.18 (0.21) | 0.13 (0.18) | 0.14 (0.17) | |
| Parietal | 0.16 (0.22) | 0.14 (0.13) | 0.14 (0.17) | |
| Temporal | 0.54 (0.66) | 0.38 (0.44) | 0.53 (0.74) | |
There were no significant Diagnostic effects for Delta or Theta power. While both Alpha1 and Alpha2 showed a significant Region by Diagnosis interaction, follow-up analyses revealed no significant effect of Diagnosis for Alpha1 or Alpha2 at any region (all p>.05). There were no consistent patterns of Alpha1 power across groups and regions, while Alpha2 power was numerically lower in SZ than BP and NC across regions.
There was a significant main effect of Diagnosis at Beta1, with BP exhibiting greater power than SZ (p=.008), as shown in Figure 1. The significant Region by Diagnosis interaction indicated increased power for BP relative to SZ at central (p<.001) and parietal (p=.018) regions.
Figure 1.
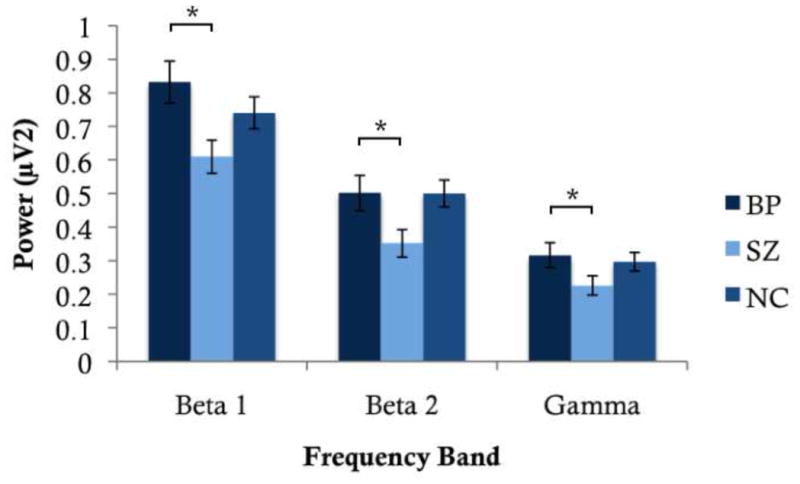
Average EEG power at Beta 1, Beta 2 and Gamma for BP, SZ, and NC. BP showed significantly greater power at all three frequency bands relative to SZ.
At higher frequencies, a significant main effect of Diagnosis was observed, with pairwise comparisons revealing increased power in BP relative to SZ at Beta2 (p=.002) and Gamma (p=.025).
Coherence
The results of the omnibus ANOVAs are presented in Table 4. Similar to the power analyses, we conducted one overall omnibus ANOVA that included all frequencies to examine differences among regions. For intra-hemispheric coherence, this revealed a significant main effect of Region (F(5,1690)=4.50, p=.004). Pairwise contrasts revealed that intra-hemispheric coherence was maximal between central-parietal and minimal between frontal-parietal regions. For inter-hemispheric coherence, the main effect of Region was also significant (F(3,1014)=4.83, p=.004), with maximal inter-hemispheric coherence in the temporal region, and minimal coherence in the central region. Figure 2 depicts the strength of coherence within and across hemispheres for each group.
Table 4.
Repeated measures ANOVAs of resting EEG intra-hemispheric and inter-hemispheric coherence among BP, SZ and NC.
| Frequency Band | ANOVA
|
||
|---|---|---|---|
| df | F | p value | |
| Delta | |||
| Intra-hemispheric | |||
| Diagnosis | 2,272 | 6.62 | .002 |
| Diagnosis × Hemisphere | 2,272 | 3.96 | .020 |
| Diagnosis × Region | 10,1360 | 1.95 | .053 |
| Inter-hemispheric | |||
| Diagnosis | 2,320 | 0.19 | .827 |
| Diagnosis × Region | 6,960 | 4.11 | .001 |
| Theta | |||
| Intra-hemispheric | |||
| Diagnosis | 2,282 | 0.11 | .900 |
| Diagnosis × Hemisphere | 2,282 | 1.35 | .260 |
| Diagnosis × Region | 10,1410 | 1.56 | .127 |
| Inter-hemispheric | |||
| Diagnosis | 2,322 | 2.60 | .076 |
| Diagnosis × Region | 6,966 | 2.70 | .015 |
| Alpha 1 | |||
| Intra-hemispheric | |||
| Diagnosis | 2,316 | 2.21 | .112 |
| Diagnosis × Hemisphere | 2,316 | 1.00 | .368 |
| Diagnosis × Region | 10,1580 | 2.76 | .005 |
| Inter-hemispheric | |||
| Diagnosis | 2,329 | 1.01 | .364 |
| Diagnosis × Region | 6,987 | 2.55 | .020 |
| Alpha 2 | |||
| Intra-hemispheric | |||
| Diagnosis | 2,316 | 2.78 | .063 |
| Diagnosis × Hemisphere | 2,316 | 0.16 | .855 |
| Diagnosis × Region | 10,1580 | 3.46 | .000 |
| Inter-hemispheric | |||
| Diagnosis | 2,330 | 0.44 | .645 |
| Diagnosis × Region | 6,990 | 3.61 | .002 |
| Beta 1 | |||
| Intra-hemispheric | |||
| Diagnosis | 2,292 | 6.78 | .001 |
| Diagnosis × Hemisphere | 2,292 | 0.53 | .587 |
| Diagnosis × Region | 10,1460 | 1.25 | .252 |
| Inter-hemispheric | |||
| Diagnosis | 2,320 | 3.32 | .038 |
| Diagnosis × Region | 6,960 | 1.29 | .263 |
| Beta 2 | |||
| Intra-hemispheric | |||
| Diagnosis | 2,255 | 0.17 | .848 |
| Diagnosis × Hemisphere | 2,255 | 4.23 | .016 |
| Diagnosis × Region | 10,1275 | 1.52 | .142 |
| Inter-hemispheric | |||
| Diagnosis | 2,309 | 1.91 | .151 |
| Diagnosis × Region | 6,927 | 0.60 | .725 |
| Gamma | |||
| Intra-hemispheric | |||
| Diagnosis | 2,292 | 0.09 | .912 |
| Diagnosis × Hemisphere | 2,292 | 1.21 | .299 |
| Diagnosis × Region | 10,1460 | 0.92 | .476 |
| Inter-hemispheric | |||
| Diagnosis | 2,304 | 0.14 | .869 |
| Diagnosis × Region | 6,912 | 0.35 | .889 |
Figure 2.
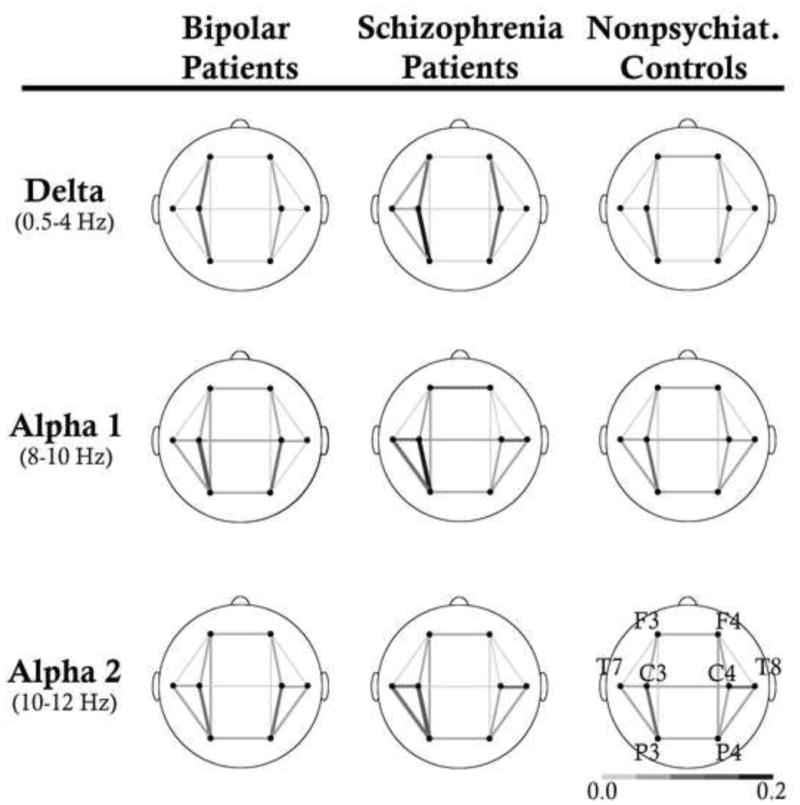
Average EEG coherence within and across hemispheres at Delta, Alpha 1, and Alpha 2 for BP, SZ and NC are shown. SZ showed higher coherence within hemisphere at delta compared to BP and NC. They also generally exhibited higher intra- and inter-hemispheric coherence across alpha compared to NC.
Intra-hemispheric Coherence
At Delta, there was a significant main effect of Diagnosis (Table 4). SZ exhibited greater coherence than BP (p=.023) and NC (p=.003). There was also a significant Diagnosis by Region interaction. A main effect of Diagnosis was found in central-parietal (p<.001) and central-temporal (p=.019) regions. In pairwise comparison, SZ exhibited greater coherence relative to BP (p=.028) and NC (p<.001) at the central-parietal region, but only relative to NC (p=.035) at the central-temporal region. Follow-up analyses to a Diagnosis by Hemisphere interaction revealed a significant effect of Diagnosis over the left hemisphere only (p<.001), with SZ showing greater coherence than BP (p=.039) and NC (p<.001). There were no significant effects involving Diagnosis at Theta.
Alpha1 and Alpha2 showed a significant Diagnosis by Region interaction. For Alpha1, there was a main effect of Diagnosis at the central-temporal region (p=.004), whereby SZ exhibited greater coherence than NC (p=.003). A main effect of Diagnosis at the parietal-temporal region (p=.050) was also found, whereby BP exhibited greater coherence than NC (p=.05). At Alpha2, a significant effect of Diagnosis was found in both central-parietal (p=.005) and parietal-temporal regions (p=.001). Pairwise comparisons at both regions revealed greater coherence by SZ and BP compared to NC (all p<.05).
A significant main effect of Diagnosis was found at Beta1, with SZ displaying lower coherence relative to NC (p=.006) and BP (p=.009).
While Beta2 showed a significant Hemisphere by Diagnosis interaction, there were no main effects of Diagnosis at either hemisphere (all p>.05). Nevertheless, NC showed numerically lower coherence on the left hemisphere but higher coherence on the right hemisphere than both patient groups, which may have driven the interaction. Gamma showed no significant effects of Diagnosis.
Inter-hemispheric Coherence
At Delta, there was a significant Region by Diagnosis interaction, driven by a significant main effect of Diagnosis in the frontal region (p = .008), with NC showing greater coherence compared to BP (p=.009) and SZ (p = .015).
Theta showed a significant Region by Diagnosis interaction, driven by a main effect of Diagnosis at central (p=.035) and parietal (p=.035) regions. While NC showed higher coherence across hemispheres than SZ (p=.039) at the central region, SZ showed higher coherence than BP (p=.035) at the parietal region.
There was a significant Region by Diagnosis interaction across both Alpha frequency bands. A main effect of Diagnosis was observed in the temporal region at both Alpha1 (p=.019) and Alpha2 (p=.006), with SZ showing greater coherence than NC (Alpha1: p=.027; Alpha2: p=.004).
At Beta1, there was a main effect of Diagnosis; while coherence was numerically lower in SZ relative to NC, this pairwise comparison was not significant (p=.081). Beta2 and Gamma showed no significant effects of Diagnosis.
Clinical Characteristics
To examine whether clinical symptoms predicted EEG power and coherence, we ran separate univariate regression analyses for each frequency band that showed significant effects of Diagnosis for the two groups of patients. Given the large number of regression analyses conducted, we performed a Sidak correction for each measure of EEG (i.e. FFT, intra-hemispheric and inter-hemispheric coherence). For BP, the predictors included both YMRS and MADRS, whereas for SZ, the predictors included the positive, negative and disorganized factors of the PANSS. We found that YMRS significantly predicted power in the frontal region at Beta2 (F(2,58)=4.73, p=.013; β=.376, p=.004) for BP. Nevertheless, the regression model did not survive Sidak correction once age, gender, and medication were included (F(5,55)=2.70, p=.030; β=.372, p=.005). Clinical symptoms as measured by the PANSS did not significantly predict power nor coherence in our sample of SZ.
Discussion
The present study examined whether resting EEG power and coherence abnormalities in BP are distinct from those in SZ. Beta and gamma power were increased in BP relative to SZ (which may be associated with mania symptoms), as well as higher intra-hemispheric coherence at beta. In contrast, SZ exhibited a general increase in coherence at delta within hemispheres, and theta across hemispheres compared to BP. They also showed greater intra- and inter-hemispheric coherence relative to NC at alpha. Together, the distinct patterns of resting EEG abnormalities in these two clinical populations suggest the potential for EEG to differentiate between the neurophysiological processes affected by the two disorders.
Given the absence of an external task during recording, the functional interpretation of EEG power and coherence at rest has posed a challenge for researchers. One approach has been to establish a relationship between EEG and MRI or cognitive measures. For example, DMN activation and resting EEG across frequencies are positively correlated, (Laufs et al. 2003; Mantini et al. 2007; Jann et al. 2010; Fingelkurts and Fingelkurts 2011), and EEG band power predicts variance in functional connectivity within the DMN (Hlinka et al. 2010). The convergence of findings from EEG and fMRI studies indicate that synchronization of neural activity may provide the scaffolding for mental activity and cognitive processing (Varela et al. 2001; Ward, 2003). Of relevance, aberrant activation of several regions in the DMN and resting state networks have been shown in SZ (Whitfield-Gabrieli et al. 2009; Ongür et al. 2010; Chai et al. 2011; Wolf et al. 2011) and BP (Ongür et al. 2010; Chai et al. 2011). Given these findings, we now discuss several key issues within our data.
First, increased beta power at high frequencies was found in BP relative to SZ. In terms of EEG signatures of network activation, several studies have converged on the finding that beta power positively correlates with activity in the DMN (Hlinka et al., Laufs et al., 2003; Mantini et al., 2008). Given the association between the DMN and mind wandering (Christoff et al., 2009; Kirschner et al., 2011; Mason et al., 2007), this may suggest that BP more frequently attend to internal thoughts. In terms of the functional interpretation, beta power may index the detection of novel stimuli (Brenner et al. 2009; Kopell et al. 2011). Interestingly, novel stimuli induce significantly more activation in the parietal region (Arbabshirani et al. 2012), and this region also shows greater synchronous activity with the DMN found in BP relative to SZ and NC (Ongür et al. 2010). Given this pair of results, the robust increase in beta power at rest observed in our study may indicate that BP are more responsive to novel stimuli in the environment, an effect that corresponds to recent findings (Minassian et al. 2011). Importantly, that mania symptoms predicted beta power in BP in our study suggests that perhaps these symptoms are driven by erratic oscillations between internal trains of thought and distraction by novel stimuli. This notion of spontaneous fluctuation in attentional allocation is supported by recent findings of increased EEG fractal dimension in mania, which indexes the extent of irregularity of a signal (Bahrami et al. 2005).
A second and related issue concerns the potential confound of muscle artifacts in high frequency abnormalities observed in our clinical populations. While muscle and ocular artifacts have been shown to bias high frequency activity (e.g., Whitham et al. 2007; Yuval-Greenberg et al. 2008; Shackman et al. 2009), this explanation seems unlikely in our data for several reasons. For one, ICA has been shown to effectively eliminate ocular artifacts that may have been overlooked in the traditional threshold-based artifact rejection procedure especially in the low and high frequencies (Keren et al. 2010; Shackman et al. 2010). This step would thus minimize residual effects of artifacts on our EEG variables. Further, if artifacts were the cause of high frequency abnormalities, they would be more likely to manifest in SZ since this clinical population has been associated with higher levels of ocular artifacts (Chan and Chen 2004; Chan et al. 2010). However, we observed greater beta power in BP instead. Collectively, that muscle artifacts alone led to the high frequency abnormalities observed in our sample appears to be an unlikely explanation.
Third, there was an absence of significantly increased low frequency power in our sample of SZ, a finding that was commonly reported in previous studies (Clementz et al. 1994; Gattaz et al. 1992; Sponheim et al. 1994; 2000). Of note, the mean power values for delta and theta activity were both increased in the SZ group, but this difference did not reach significance. There are several possible explanations that may account for this disparity. First, we assessed power using CSD rather than voltage values. Second, while we employed ICA to correct for artifacts, many previous studies performed traditional threshold-based ocular artifact correction (Clementz et al. 1994; Gattaz et al. 1992; Sponheim et al. 1994). Third, our samples may differ in terms of clinical characteristics from other studies. For example, several previous studies recruited drug-free SZ (Gattaz et al. 1992; Miyauchi et al. 1996), whereas the current study recruited SZ regardless of their medication status but statistically accounted for medication use in analyses. Future studies are necessary to determine whether increased low frequency power is a unique characteristic of schizophrenia or a function of either methodology or medication effects.
A fourth key issue pertains to our finding that SZ exhibit greater connectivity at rest compared to not only NC but also BP. Given that EEG was recorded during rest as opposed to a cognitive task, the increased coherence suggests that SZ tend to expend energy in potentially excessive or inefficient neural processing. Although overall coherence values in our study were low, our finding of differences in resting connectivity between SZ and NC are consistent with previous reports (e.g. Mann et al. 1997; Nagase et al. 1992; Wada et al. 1998; Yeragani et al. 2006). Also in line with our results, a recent study showed greater coherence activity within the frontal regions of the DMN in SZ relative to BP (Ongür et al. 2010). Of importance, the electrophysiological abnormalities in neural connectivity we report are consistent with the structural and functional anomalies observed in SZ. For example, an increased number of long distance white matter tracts (Hubl et al. 2004) as well as greater functional connectivity within the DMN at rest (Whitfield-Gabrieli et al. 2009; Wolf et al. 2011) have been found in SZ. Together, this pattern of increased neural synchronization may reflect network activity in the resting state that is less selectively organized, consistent with suggestions that SZ may be associated with inefficient neural processing (Macdonald et al. 2005; Ragland et al. 2008; Karch et al. 2009).
In conclusion, we found that both clinical populations exhibited increased alpha coherence within hemisphere relative to controls. However, BP was uniquely characterized by increased high frequency power while SZ was uniquely characterized by increased low frequency connectivity within and across hemispheres. This study highlights the value of resting EEG in providing a sensitive measure for differentiating clinical diagnostic groups.
Acknowledgments
Role of Funding Source
ARB was supported by
-
NARSAD Young Investigator Award (Principal Investigator) 7/1/11 - 6/30/13
“Effect of Secretin on Cerebellar Function and Cortical Synchronization in Schizophrenia”
Description: This study examines the effects of secretin on cerebellar-dependent eyeblink conditioning and frontal EEG gamma synchronization in schizophrenia.
-
Indiana University Collaborative Research Grant (Co-Investigator) 2/1/12 to 1/31/13
“Identifying Effects of Chronic Cannabis Abuse on Associative learning and Neuroplasticity”
Description: The proposed research will examine the effects of the 2 primary components of cannabis sativa, specifically THC and cannabidiol, on associative learning in rats.
-
Cerebellar Timing Dysfunction in Schizophrenia (Co-Principal Investigator), R01 PA-10-067 (2R01MH074983) 11/01/2012 to 10/31/2017
Description: This grant proposal is a renewal of our previous R01. We propose to investigate the functional connectivity of the cerebellum in schizophrenia and first-degree relatives using temporal processing, associative learning and cognitive tasks designed to probe cerebellum and related circuits
BFO was supported by
-
Faculty Research Support Program, Indiana University, Principal Investigator, 2010–2012
“Human Brain Connectivity Analysis: Application to Clinical Populations,”
This project uses graph theoretic analytic procedures to mathematically characterize human brain connectivity based on DTI derived white matter tractography in healthy adults and individuals with schizophrenia or autism.
-
1 R21 MH091774-01, Principal Investigator, 2010–2012
“Neural Oscillations in Schizophrenia and a Rat Model”.
This project examines electrophysiological biomarkers in persons with schizophrenia and in a NMDA antagonist rat model.
-
1 T32 DA024628-01, Core Faculty, 2008–2013
“Integrative Predoctoral Training in Drug Abuse,”
This project supports integrative predoctoral training in the neuroscience of drug abuse at Indiana
-
Stanley Foundation (Investigator), 2010–2013,
“The Effect of N-Acetyl Cysteine on Cortical Erosion in Early Stage Schizophrenia”
Role: Evaluate effects of N-Acetyl cysteine on electrophysiological measures in an add-on treatment trial for schizophrenia.
WFH was supported by
-
Cerebellar Timing Dysfunction in Schizophrenia (Co-Principal Investigator), R01 PA-10-067 (2R01MH074983) 11/01/2012 to 10/31/2017
Description: This grant proposal is a renewal of our previous R01. We propose to investigate the functional connectivity of the cerebellum in schizophrenia and first-degree relatives using temporal processing, associative learning and cognitive tasks designed to probe cerebellum and related circuits
CRB was supported by
University of British Columbia Start-Up funds (Principle Investigator) 2008-present
-
NSERC Discovery Grant 12R65319 (Principle Investigator) 2010–2014
“The Foundations of Memory: A Study of Neural Synchrony”
We sincerely thank Sonia Terhaag for her help with processing the electrophysiological data. We also thank all our participants for their time and participation in our study, and the clinical research team at Larue D. Carter Memorial Hospital and the Indiana University Neuroscience Clinical Research Center for their support. ARB was supported by the NARSAD Young Investigator Award and the Indiana University Collaborative Research Grant. Both ARB and WPH are supported by the grant (2-R01-MH074983) exploring Cerebellar Timing Dysfunction in Schizophrenia (R01 PA-10-067). BFO is supported by the Faculty Research Support Program at Indiana University, a grant exploring the Neural Oscillations in Schizophrenia and a Rat Model (1-R21-MH091774-01), a grant supporting predoctoral training in the neuroscience of drug abuse at Indiana University (1 T32 DA024628-01), and a grant from the Stanley Foundation. CAB was supported by the University of British Columbia Start-Up funds and the Natural Science and Engineering Research Council Discovery Grant (12R65319).
Footnotes
The medication status of one schizophrenia patient was unknown.
Conflict of Interest and Financial Disclosure
The authors declare no conflict of interest.
Contributors
Authors BFO, WPH designed the study and wrote the protocol, while ARB and CAB conducted clinical interviews and assisted with data collection. Authors CAB and JWYK managed the literature searches and undertook the statistical analysis, as well as wrote the first draft of the manuscript. All authors contributed to and have approved the final manuscript.
References
- Arbabshirani MR, Havlicek M, Kiehl K a, Pearlson GD, Calhoun VD. Functional network connectivity during rest and task conditions: A comparative study. Human brain mapping. 2012 doi: 10.1002/hbm.22118. DOI: 10.10. [DOI] [PMC free article] [PubMed] [Google Scholar]
- Barry RJ, Clarke AR, Johnstone SJ. A review of electrophysiology in attention-deficit / hyperactivity disorder : I. Qualitative and quantitative electroencephalography. Clinical Neurophysiology. 2003;114:171–83. doi: 10.1016/s1388-2457(02)00362-0. [DOI] [PubMed] [Google Scholar]
- Başar E, Güntekin B, Atagün ü, Turp Gölbaşı B, Tülay E, Özerdem A. Brain’s alpha activity is highly reduced in euthymic bipolar disorder patients. Cognitive Neurodynamics. 2012;6(1):11–20. doi: 10.1007/s11571-011-9172-y. [DOI] [PMC free article] [PubMed] [Google Scholar]
- Bhattacharya J. Reduced degree of long-range phase synchrony in pathological human brain. Acta neurobiologiae experimentalis. 2001;61(4):309–18. doi: 10.55782/ane-2001-1406. [DOI] [PubMed] [Google Scholar]
- Brenner C a, Kieffaber PD, Clementz B a, Johannesen JK, Shekhar A, O’Donnell BF, et al. Event-related potential abnormalities in schizophrenia: a failure to “gate in” salient information? Schizophrenia research. 2009;113(2–3):332–8. doi: 10.1016/j.schres.2009.06.012. [DOI] [PMC free article] [PubMed] [Google Scholar]
- Britz J, Van De Ville D, Michel CM. BOLD correlates of EEG topography reveal rapid resting-state network dynamics. NeuroImage. 2010;52(4):1162–70. doi: 10.1016/j.neuroimage.2010.02.052. [DOI] [PubMed] [Google Scholar]
- Buckner RL, Andrews-Hanna JR, Schacter DL. The brain’s default network: anatomy, function, and relevance to disease. Annals of the New York Academy of Sciences. 2008;1124:1–38. doi: 10.1196/annals.1440.011. [DOI] [PubMed] [Google Scholar]
- Chai XJ, Whitfield-Gabrieli S, Shinn AK, Gabrieli JDE, Nieto Castañón A, McCarthy JM, et al. Abnormal medial prefrontal cortex resting-state connectivity in bipolar disorder and schizophrenia. Neuropsychopharmacology. 2011;36(10):2009–17. doi: 10.1038/npp.2011.88. [DOI] [PMC free article] [PubMed] [Google Scholar]
- Chan KKS, Hui CLM, Lam MML, Tang JYM, Wong GHY, Chan SKW, et al. A three-year prospective study of spontaneous eye-blink rate in first-episode schizophrenia: relationship with relapse and neurocognitive function. East Asian archives of psychiatry. 2010;20(4):174–9. [PubMed] [Google Scholar]
- Chan RCK, Chen EYH. Blink Rate Does Matter. The Journal of Nervous and Mental Disease. 2004;192(11):781–3. doi: 10.1097/01.nmd.0000144697.48042.eb. [DOI] [PubMed] [Google Scholar]
- Chen S-S, Tu P-C, Su T-P, Hsieh J-C, Lin Y-C, Chen L-F. Impaired frontal synchronization of spontaneous magnetoencephalographic activity in patients with bipolar disorder. Neuroscience letters. 2008;445(2):174–8. doi: 10.1016/j.neulet.2008.08.080. [DOI] [PubMed] [Google Scholar]
- Christoff K, Gordon AM, Smallwood J, Smith R, Schooler W, Posner MI, et al. fMRI reveals default Experience sampling during and executive network contributions system to mind wandering. Proceedings of the National Academy of Sciences of the United States of America. 2009;106:8719–24. doi: 10.1073/pnas.0900234106. [DOI] [PMC free article] [PubMed] [Google Scholar]
- Clementz BA, Sponheim SR, Iacono WG, Beiser M. Resting EEG in first-episode schizophrenia patients, bipolar psychosis patients, and their first-degree relatives. Psychophysiology. 1994;31:486–94. doi: 10.1111/j.1469-8986.1994.tb01052.x. [DOI] [PubMed] [Google Scholar]
- Delorme A, Palmer J, Onton J, Oostenveld R, Makeig S. Independent EEG sources are dipolar. PloS one. 2012;7(2):e30135. doi: 10.1371/journal.pone.0030135. [DOI] [PMC free article] [PubMed] [Google Scholar]
- El-Badri SM, Ashton CH, Moore PB, Marsh VR, Ferrier IN. Electrophysiological and cognitive function in young euthymic patients with bipolar affective disorder. Bipolar disorders. 2001 Apr;3(2):79–87. doi: 10.1034/j.1399-5618.2001.030206.x. [DOI] [PubMed] [Google Scholar]
- Fein G, Raz J, Brown FF, Merrin EL. Common reference coherence data are confounded by power and phase effects. Electroencephalography and clinical Neurophysiology. 1988;69:581–4. doi: 10.1016/0013-4694(88)90171-x. [DOI] [PubMed] [Google Scholar]
- Fingelkurts A a, Fingelkurts A a. Persistent operational synchrony within brain default-mode network and self-processing operations in healthy subjects. Brain and cognition. 2011;75(2):79–90. doi: 10.1016/j.bandc.2010.11.015. [DOI] [PubMed] [Google Scholar]
- Finnigan S, Robertson IH. Resting EEG theta power correlates with cognitive performance in healthy older adults. Psychophysiology. 2011;48(8):1083–7. doi: 10.1111/j.1469-8986.2010.01173.x. [DOI] [PubMed] [Google Scholar]
- Fisher M, McCoy K, Poole JH, Vinogradov S. Self and other in schizophrenia: a cognitive neuroscience perspective. The American journal of psychiatry. 2008;165(11):1465–72. doi: 10.1176/appi.ajp.2008.07111806. [DOI] [PMC free article] [PubMed] [Google Scholar]
- Gattaz WF, Mayer S, Ziegler P, Platz M, Gasser T. Hypofrontality of Topographic EEG in Schizophrenia. European Archives of Psychiatry and Clinical Neuroscience. 1992;241:328–32. doi: 10.1007/BF02191956. [DOI] [PubMed] [Google Scholar]
- Gratton G, Coles M, Donchin E. A new method for off-line removal of ocular artifact. Electroencephalography and clinical Neurophysiology. 1983;55:468–84. doi: 10.1016/0013-4694(83)90135-9. [DOI] [PubMed] [Google Scholar]
- Greicius MD, Krasnow B, Reiss AL, Menon V. Functional connectivity in the resting brain: a network analysis of the default mode hypothesis. Proceedings of the National Academy of Sciences of the United States of America. 2003;100(1):253–8. doi: 10.1073/pnas.0135058100. [DOI] [PMC free article] [PubMed] [Google Scholar]
- Gusnard DA, Raichle ME. Searching for a baseline: Functional imaging and the resting human brain. Nature Reviews: Neuroscience. 2001;2:685–94. doi: 10.1038/35094500. [DOI] [PubMed] [Google Scholar]
- Hlinka J, Alexakis C, Diukova A, Liddle PF, Auer DP. Slow EEG pattern predicts reduced intrinsic functional connectivity in the default mode network: an inter-subject analysis. NeuroImage. 2010;53(1):239–46. doi: 10.1016/j.neuroimage.2010.06.002. [DOI] [PubMed] [Google Scholar]
- Holt DJ, Cassidy BS, Andrews-Hanna JR, Lee SM, Coombs G, Goff DC, et al. An anterior-to-posterior shift in midline cortical activity in schizophrenia during self-reflection. Biological psychiatry. 2011;69(5):415–23. doi: 10.1016/j.biopsych.2010.10.003. [DOI] [PMC free article] [PubMed] [Google Scholar]
- Hubl D, Koenig T, Strik W, Federspiel A, Kries R, Boesch C, et al. Pathways That Make Voices: white matter changes in auditory hallucinations. Archives of general psychiatry. 2004;61:658–68. doi: 10.1001/archpsyc.61.7.658. [DOI] [PubMed] [Google Scholar]
- Iqbal Z, Birchwood M, Hemsley D, Jackson C, Morris E. Autobiographical memory and post-psychotic depression in first episode psychosis. British journal of Clinical Psychology. 2004;43:97–104. doi: 10.1348/014466504772812995. [DOI] [PubMed] [Google Scholar]
- Jann K, Kottlow M, Dierks T, Boesch C, Koenig T. Topographic electrophysiological signatures of FMRI Resting State Networks. PloS one. 2010;5(9):e12945. doi: 10.1371/journal.pone.0012945. [DOI] [PMC free article] [PubMed] [Google Scholar]
- Jelic V, Johansson S-E, Almkvist O, Shigeta M, Julin P, Nordberg a, et al. Quantitative electroencephalography in mild cognitive impairment: longitudinal changes and possible prediction of Alzheimer’s disease. Neurobiology of Aging. 2000 Jul;21(4):533–40. doi: 10.1016/s0197-4580(00)00153-6. [DOI] [PubMed] [Google Scholar]
- Karch S, Leicht G, Giegling I, Lutz J, Kunz J, Buselmeier M, et al. Inefficient neural activity in patients with schizophrenia and nonpsychotic relatives of schizophrenic patients: evidence from a working memory task. Journal of psychiatric research. 2009;43(15):1185–94. doi: 10.1016/j.jpsychires.2009.04.004. [DOI] [PubMed] [Google Scholar]
- Keren AS, Yuval-Greenberg S, Deouell LY. Saccadic spike potentials in gamma-band EEG: characterization, detection and suppression. NeuroImage. 2010;49(3):2248–63. doi: 10.1016/j.neuroimage.2009.10.057. [DOI] [PubMed] [Google Scholar]
- Kim H. A dual-subsystem model of the brain’s default network: Self-referential processing, memory retrieval processes, and autobiographical memory retrieval. NeuroImage. 2012;61(4):966–77. doi: 10.1016/j.neuroimage.2012.03.025. [DOI] [PubMed] [Google Scholar]
- Kopell N, Whittington M a, Kramer M a. Neuronal assembly dynamics in the beta1 frequency range permits short-term memory. Proceedings of the National Academy of Sciences of the United States of America. 2011;108(9):3779–84. doi: 10.1073/pnas.1019676108. [DOI] [PMC free article] [PubMed] [Google Scholar]
- Laufs H. Endogenous brain oscillations and related networks detected by surface EEG-combined fMRI. Human brain mapping. 2008;29(7):762–9. doi: 10.1002/hbm.20600. [DOI] [PMC free article] [PubMed] [Google Scholar]
- Laufs H, Krakow K, Sterzer P, Eger E, Beyerle A, Salek-Haddadi A, et al. Electroencephalographic signatures of attentional and cognitive default modes in spontaneous brain activityfluctuations at rest. Proceedings of the National Academy of Sciences of the United States of America. 2003;100:11053–8. doi: 10.1073/pnas.1831638100. [DOI] [PMC free article] [PubMed] [Google Scholar]
- Li S-J, Li Z, Wu G, Zhang M-J, Franczak M, Antuono PG. Alzheimer Disease: evaluation of a functional MR imaging index as a marker. Radiology. 2002;225(1):253–9. doi: 10.1148/radiol.2251011301. [DOI] [PubMed] [Google Scholar]
- Lund TR, Sponheim SR, Iacono WG, Clementz B a. Internal consistency reliability of resting EEG power spectra in schizophrenic and normal subjects. Psychophysiology. 1995 Jan;32(1):66–71. doi: 10.1111/j.1469-8986.1995.tb03407.x. [DOI] [PubMed] [Google Scholar]
- Macdonald AW, Carter CS, Kerns JG, Ursu S, Barch DM, Holmes AJ, et al. Specificity of Prefrontal Dysfunction and Context Processing Deficits to Schizophrenia in Never-Medicated Patients With First-Episode Psychosis. American Journal of Psychiatry. 2005;162:475–84. doi: 10.1176/appi.ajp.162.3.475. [DOI] [PubMed] [Google Scholar]
- Makeig S, Jung TP, Bell a J, Ghahremani D, Sejnowski TJ. Blind separation of auditory event-related brain responses into independent components. Proceedings of the National Academy of Sciences of the United States of America. 1997;94(20):10979–84. doi: 10.1073/pnas.94.20.10979. [DOI] [PMC free article] [PubMed] [Google Scholar]
- Mann K, Maier W, Franke P, Röschke J, Gänsicke M. Intra- and interhemispheric electroencephalogram coherence in siblings discordant for schizophrenia and healthy volunteers. Biological psychiatry. 1997;42(8):655–63. doi: 10.1016/s0006-3223(96)00497-0. [DOI] [PubMed] [Google Scholar]
- Mantini D, Perrucci MG, Del Gratta C, Romani GL, Corbetta M. Electrophysiological signatures of resting state networks in the human brain. Proceedings of the National Academy of Sciences of the United States of America. 2007;104(32):13170–5. doi: 10.1073/pnas.0700668104. [DOI] [PMC free article] [PubMed] [Google Scholar]
- McMenamin BW, Shackman AJ, Maxwell JS, Bachhuber DRW, Koppenhaver AM, Greischar LL, et al. Validation of ICA-based myogenic artifact correction for scalp and source-localized EEG. NeuroImage. 2010;49(3):2416–32. doi: 10.1016/j.neuroimage.2009.10.010. [DOI] [PMC free article] [PubMed] [Google Scholar]
- van der Meer L, Costafreda S, Aleman A, David AS. Self-reflection and the brain: a theoretical review and meta-analysis of neuroimaging studies with implications for schizophrenia. Neuroscience and biobehavioral reviews. 2010;34(6):935–46. doi: 10.1016/j.neubiorev.2009.12.004. [DOI] [PubMed] [Google Scholar]
- Merrin EL, Floyd TC, Fein G. EEG coherence in unmedicated schizophrenic patients. Biological psychiatry. 1989;25(1):60–6. doi: 10.1016/0006-3223(89)90147-9. [DOI] [PubMed] [Google Scholar]
- Mima T, Hallett M. Electroencephalographic analysis of cortico-muscular coherence: reference effect, volume conduction and generator mechanism. Clinical neurophysiology : official journal of the International Federation of Clinical Neurophysiology. 1999;110(11):1892–9. doi: 10.1016/s1388-2457(99)00238-2. [DOI] [PubMed] [Google Scholar]
- Minassian A, Henry BL, Young JW, Masten V, Geyer M a, Perry W. Repeated assessment of exploration and novelty seeking in the human behavioral pattern monitor in bipolar disorder patients and healthy individuals. PloS one. 2011;6(8):e24185. doi: 10.1371/journal.pone.0024185. [DOI] [PMC free article] [PubMed] [Google Scholar]
- Miyauchi T, Endo S, Kajiwara S, Ishii M, Okajima J. Computerized electroencephalogram in untreated schizophrenics: a comparison between disorganized and paranoid types. Psychiatry and clinical neurosciences. 1996;50(2):71–8. doi: 10.1111/j.1440-1819.1996.tb01666.x. [DOI] [PubMed] [Google Scholar]
- Nagase Y, Okubo Y, Matsuura M, Kojima T, Toru M. EEG coherence in unmedicated schizophrenic patients: topographical study of predominantly never medicated cases. Biological psychiatry. 1992;32(11):1028–34. doi: 10.1016/0006-3223(92)90064-7. [DOI] [PubMed] [Google Scholar]
- Northoff G, Heinzel A, de Greck M, Bermpohl F, Dobrowolny H, Panksepp J. Self-referential processing in our brain--a meta-analysis of imaging studies on the self. NeuroImage. 2006;31(1):440–57. doi: 10.1016/j.neuroimage.2005.12.002. [DOI] [PubMed] [Google Scholar]
- Nunez PL, Srinivasan R, Westdorp a F, Wijesinghe RS, Tucker DM, Silberstein RB, et al. EEG coherency. I: Statistics, reference electrode, volume conduction, Laplacians, cortical imaging, and interpretation at multiple scales. Electroencephalography and clinical neurophysiology. 1997;103(5):499–515. doi: 10.1016/s0013-4694(97)00066-7. [DOI] [PubMed] [Google Scholar]
- Nuñez A, Panetsos F, Avendaño C. Rhythmic neuronal interactions and synchronization in the rat dorsal column nuclei. Neuroscience. 2000 Jan;100(3):599–609. doi: 10.1016/s0306-4522(00)00305-5. [DOI] [PubMed] [Google Scholar]
- Ongür D, Lundy M, Greenhouse I, Shinn AK, Menon V, Cohen BM, et al. Default mode network abnormalities in bipolar disorder and schizophrenia. Psychiatry research. 2010;183(1):59–68. doi: 10.1016/j.pscychresns.2010.04.008. [DOI] [PMC free article] [PubMed] [Google Scholar]
- Qin P, Northoff G. How is our self related to midline regions and the default-mode network? NeuroImage. 2011;57(3):1221–33. doi: 10.1016/j.neuroimage.2011.05.028. [DOI] [PubMed] [Google Scholar]
- Ragland JD, Moelter ST, Bhati MT, Valdez JN, Kohler CG, Siegel SJ, et al. Effect of retrieval effort and switching demand on fMRI activation during semantic word generation in schizophrenia. Schizophrenia research. 2008;99(1–3):312–23. doi: 10.1016/j.schres.2007.11.017. [DOI] [PMC free article] [PubMed] [Google Scholar]
- Schiff SJ. Dangerous Phase. 2005:315–7. doi: 10.1385/NI:03:04:315. [DOI] [PMC free article] [PubMed] [Google Scholar]
- Shackman AJ, McMenamin BW, Maxwell JS, Greischar LL, Davidson RJ. Identifying robust and sensitive frequency bands for interrogating neural oscillations. NeuroImage. 2010;51(4):1319–33. doi: 10.1016/j.neuroimage.2010.03.037. [DOI] [PMC free article] [PubMed] [Google Scholar]
- Shackman AJ, McMenamin BW, Slagter H a, Maxwell JS, Greischar LL, Davidson RJ. Electromyogenic artifacts and electroencephalographic inferences. Brain topography. 2009;22(1):7–12. doi: 10.1007/s10548-009-0079-4. [DOI] [PMC free article] [PubMed] [Google Scholar]
- Sponheim SR, Clementz B a, Iacono WG, Beiser M. Clinical and biological concomitants of resting state EEG power abnormalities in schizophrenia. Biological psychiatry. 2000;48:1088–97. doi: 10.1016/s0006-3223(00)00907-0. [DOI] [PubMed] [Google Scholar]
- Sponheim SR, Clementz BA, Iacono WG, Beiser M. Resting EEG in first episode and chronic schizophrenia.pdf. Psychophysiology. 1994;31:37–43. doi: 10.1111/j.1469-8986.1994.tb01023.x. [DOI] [PubMed] [Google Scholar]
- Stam CJ, van Cappellen van Walsum A-M, Micheloyannis S. Variability of EEG synchronization during a working memory task in healthy subjects. International journal of psychophysiology. 2002;46(1):53–66. doi: 10.1016/s0167-8760(02)00041-7. [DOI] [PubMed] [Google Scholar]
- Svoboda E, McKinnon MC, Levine B. The functional neuroanatomy of autobiographical memory: a meta-analysis. Neuropsychologia. 2006;44(12):2189–208. doi: 10.1016/j.neuropsychologia.2006.05.023. [DOI] [PMC free article] [PubMed] [Google Scholar]
- Tenke CE, Kayser J. Generator localization by current source density (CSD): implications of volume conduction and field closure at intracranial and scalp resolutions. Clinical neurophysiology Neurophysiology. 2012;123(12):2328–45. doi: 10.1016/j.clinph.2012.06.005. [DOI] [PMC free article] [PubMed] [Google Scholar]
- Thibodeau R, Jorgensen RS, Kim S. Depression, anxiety, and resting frontal EEG asymmetry: a meta-analytic review. Journal of abnormal psychology. 2006;115(4):715–29. doi: 10.1037/0021-843X.115.4.715. [DOI] [PubMed] [Google Scholar]
- Varela F, Lachaux J, Rodriguez E, Martinerie J. The brainweb: Phase synchronization and large-scale integration. Nature Reviews: Neuroscience. 2001;2(April):229–39. doi: 10.1038/35067550. [DOI] [PubMed] [Google Scholar]
- Venables NC, Bernat EM, Sponheim SR. Genetic and disorder-specific aspects of resting state EEG abnormalities in schizophrenia. Schizophrenia bulletin. 2009;35(4):826–39. doi: 10.1093/schbul/sbn021. [DOI] [PMC free article] [PubMed] [Google Scholar]
- Wada Y, Nanbu Y, Kikuchi M, Koshino Y, Hashimoto T. Aberrant functional organization in schizophrenia: analysis of EEG coherence during rest and photic stimulation in drug-naive patients. Neuropsychobiology. 1998 Jan;38(2):63–9. doi: 10.1159/000026518. [DOI] [PubMed] [Google Scholar]
- Ward LM. Synchronous neural oscillations and cognitive processes. Trends in Cognitive Sciences. 2003;7(12):553–9. doi: 10.1016/j.tics.2003.10.012. [DOI] [PubMed] [Google Scholar]
- Whitfield-Gabrieli S, Thermenos HW, Milanovic S, Tsuang MT, Faraone SV, McCarley RW, et al. Hyperactivity and hyperconnectivity of the default network in schizophrenia and in first-degree relatives of persons with schizophrenia. Proceedings of the National Academy of Sciences of the United States of America. 2009;106(4):1279–84. doi: 10.1073/pnas.0809141106. [DOI] [PMC free article] [PubMed] [Google Scholar]
- Whitham EM, Pope KJ, Fitzgibbon SP, Lewis T, Clark CR, Loveless S, et al. Scalp electrical recording during paralysis: quantitative evidence that EEG frequencies above 20 Hz are contaminated by EMG. Clinical neurophysiology : official journal of the International Federation of Clinical Neurophysiology. 2007;118(8):1877–88. doi: 10.1016/j.clinph.2007.04.027. [DOI] [PubMed] [Google Scholar]
- Wolf ND, Sambataro F, Vasic N, Frasch K, Schmid M, Schönfeldt-Lecuona C, et al. Dysconnectivity of multiple resting-state networks in patients with schizophrenia who have persistent auditory verbal hallucinations. Journal of psychiatry & neuroscience. 2011;36(6):366–74. doi: 10.1503/jpn.110008. [DOI] [PMC free article] [PubMed] [Google Scholar]
- Yeragani VK, Cashmere D, Miewald J, Tancer M, Keshavan MS. Decreased coherence in higher frequency ranges (beta and gamma) between central and frontal EEG in patients with schizophrenia: A preliminary report. Psychiatry research. 2006;141(1):53–60. doi: 10.1016/j.psychres.2005.07.016. [DOI] [PubMed] [Google Scholar]
- Yuval-Greenberg S, Tomer O, Keren AS, Nelken I, Deouell LY. Transient induced gamma-band response in EEG as a manifestation of miniature saccades. Neuron. 2008;58(3):429–41. doi: 10.1016/j.neuron.2008.03.027. [DOI] [PubMed] [Google Scholar]