

Abstract
Aims/Introduction: The polyol pathway has long been involved in the pathogenesis of diabetic nephropathy. It remains still unclear, however, how the polyol pathway is implicated in this process. We explored the effects of the enhanced polyol pathway on renocortical tubular cells and glomeruli in experimentally‐induced diabetes.
Materials and Methods: Transgenic mice (Tg) overexpressing human aldose reductase were made diabetic by streptozotocin and followed for 8 weeks. Renocortical pathology, expressions of tonicity‐responsive enhancer binding protein (TonEBP) and carboxymethyllysine of advanced glycation end‐products, were examined. Wild‐type non‐transgenic mice (Wt) were also made diabetic and served as controls.
Results: Diabetic Tg showed augmented expression of TonEBP in renocortical tubular cells with vacuolated degenerative changes. These structural changes were associated with pronounced deposition of carboxymethyllysine. There was a significant increase in kidney weight, glomerular size, and mesangial area in diabetic animals and there was a trend for more severe changes in these measures in diabetic transgenic mice compared with those in control diabetic mice. Treatment with aldose reductase inhibitor significantly prevented polyol accumulation, mesangial expansion and expressions of TonEBP and carboxymethyllysine in diabetic Tg, but its effects on the renal structure were equivocal in control diabetic Wt.
Conclusions: Our findings suggest that tubuloglomerular change might contribute to early diabetic nephropathy under the influence of the enhanced polyol pathway. (J Diabetes Invest, doi: 10.1111/j.2040‐1124.2010.00071.x, 2010)
Keywords: Diabetic nephropathy, Tubuloglomerular feedback system, Aldose reductase
Introduction
The polyol pathway has long been considered as one of the important initiating factors for functional and structural changes in the diabetic kidney1–3. Mesangial cells accumulate polyols and produce excessive matrix proteins under high glucose milieu4,5. Inhibition of aldose reductase (AR), a key regulating enzyme of the polyol pathway, has been shown to prevent the development of proteinuria, or thickening of glomerular basement membranes, in diabetic animal models6,7 and humans8,9. In humans, AR gene polymorphism10 and high activities or protein levels of AR in erythrocytes11,12 are reported to be associated with a high incidence of diabetic nephropathy. However, despite the fact that tubular cells are intimately related to glomerular function, little attention has been paid to the relationship between tubular cell changes and glomerular pathology in early diabetes.
Transgenic mice (Tg) overexpressing human AR (hAR) are established to be useful for the evaluation of the effect of the enhanced polyol pathway on the development of diabetic complications1,13,14. This model expresses high levels of hAR mRNA and protein in a variety of tissues and accumulates polyols under galactosemia. Tg develop severe neuropathic changes under both galactosemic and diabetic conditions15,16. More recently, this model has been shown to cause augmented tissue damage in the ischemic heart17,18. It is therefore intriguing to explore the effects of overexpression of hAR on early kidney lesions in streptozotocin (STZ)‐induced hyperglycemic mice to know how the enhanced polyol pathway influences renal tubular cells and glomeruli.
Materials and Methods
Animals
Female Tg that express hAR were used in the present study. Mice negative for the hAR gene were used as wild‐type control animals (Wt). After birth, all animals were maintained in plastic cages in rooms with a constant temperature of 25°C and 12‐h light and dark cycle. All animals were given free access to rodent standard chow (Oriental MF, Tokyo, Japan) and water.
Production of Diabetic Mice and Laboratory Testing
Both Tg and Wt at the age of 8 weeks were made diabetic by an intraperitoneal injection of streptozotocin (180 mg/kg; Sigma, St. Louis, MO, USA, Lot. 55H1503). After a couple of days, they became severely polyuric and polydipsic. Mice with glycemic levels more than 19.25 mmol/L and with constant glycosuria were identified as diabetic. For comparison, non‐diabetic Tg and non‐diabetic Wt served as controls. After the onset of diabetes, bodyweight and blood glucose levels from the tail blood were measured serially. Blood glucose of the tail was measured by reflectance meter using a paper strip (Antsense; Sankyo, Tokyo, Japan).
Half of the animals in both the diabetic Tg and diabetic Wt groups were given AR inhibitor (ARI; ONO 2235, 100 mg/kg per day; kindly provided by ONO Pharmaceutical, Osaka, Japan) daily by gavage after the onset of diabetes.
Tissue Carbohydrate Levels
After exsanguination, bilateral kidneys were extirpated and the left kidney was processed for biochemical analysis. The right kidney was weighed and processed for structural analysis. For biochemical analysis, the kidney was separated into the cortex and medulla and stored at −20°C until measurement. Sorbitol and fructose contents in tissues were measured by liquid chromatography with tandem mass spectrometry (LC/MS/MS) methods described previously15,16. The concentrations were expressed as nanomoles per milligrams per protein.
Kidney Morphometry
For the evaluation of glomerular size and mesangial areas at light microscopic levels, kidney samples fixed in 4% formaldehyde were dehydrated and embedded in paraffin. Then, 4‐μ thick sections were stained with hematoxylin–eosin and periodic acid‐Schiff (PAS).
Only the surface cortical area on PAS stained sections were used for the analysis of glomeruli. Total glomerular surface area (TGSA), glomerular tuft surface area (GTSA) and mesangial surface area (MSA) were measured on at least 50 randomly chosen glomeruli, and mean values were obtained as a representative of an individual21. For the measurement of glomerular basement membrane (GBM) thickness, small pieces of renal cortex in each animal were fixed in 2.5% glutaraldehyde, postfixed in 1% osmium tetroxide and embedded in epon. Ultrathin sections were stained with uranyl acetate and lead citrate. A total of 20 electron micrographs were randomly taken on the peripheral capillaries in each glomerulus at a magnification of ×20,000. The basement membrane thickness was then measured on at least 200 points in each glomerulus by the orthogonal intercept method22. All the morphometric analyses were carried out in a double‐blinded manner.
Western Blotting and Immunohistochemistry
To explore the expression of hAR and mouse AR (mAR) by western blot analysis, renal cortical tissues from Wt and Tg with or without 8‐week diabetic duration were homogenized in Tris‐saline‐acid (TSA)‐ phenylmethylsulfonylfluoride (PMSF) buffer (pH 8.0) and centrifuged (13,000 g). SDS‐PAGE was carried out using the Xcell SureLock system (Invitrogen, San Diego, CA, USA) in the reducing condition. The membrane was reacted with antibodies to hAR19,20 or mAR23 and β‐actin‐specific antibody (Santa Cruz). A final incubation was carried out with peroxidase‐conjugated anti‐rabbit or anti‐goat IgG (Santa Cruz Biotech, Santa Cruz, CA, USA) for 45 min at room temperature. Immunodetection was carried out by enhanced chemiluminescence (Amersham‐Pharmacia, Buckinghamshire, UK).
To identify the localization of AR and tonicity‐responsive enhancer binding protein (TonEBP) expressions in the renal cortex and explore the topology of pathological changes, deparaffinized sections of formalin‐fixed renal cortical tissues from Wt and Tg with or without diabetes were immunostained with antibodies to hAR, mAR, TonEBP, Na,K‐ATPase α1 (Novus Biologicals, Littleton, CO, USA) as a marker of distal convoluted tubule (DCT), and aquaporin 2 (Almone Labs, Jerusalem, Israel) as a marker of CCD24. Immunohistochemical staining based on the streptavidin‐biotin method was carried out on deparaffinized sections using antibodies against hAR19, mAR23, TonEBP24 and carboxymethyllysine (CML)25. Specificity was confirmed by the control staining carried out by omitting the first antibodies or sections were incubated with preabsorbed immune sera with excessive antigens when available.
The staining reactions of TonEBP and CML were semiquantitatively expressed as 0 (negative), 1 (faintly or only focally positive), 2 (clearly positive on <50% cells or strongly positive on <20% cells), 3 (clearly positive on ≥50% cells or strongly positive on ≥20% cells). The average scores were obtained from at least three stained slides for each animal and the average value in each group was compared among the group.
Statistical Analysis
Statistical comparison was made on the differences in mean values among multiple groups by using one‐way analysis of variance with post hoc Scheffe’s test. Statistical significance was achieved if P‐values were <0.05.
Results
Clinical Data
Diabetes caused a significant reduction in bodyweight in both Tg and Wt, and there was no significant difference in the decrease between diabetic Tg and diabetic Wt (Table 1). Hyperglycemic levels were comparable between these two groups. Kidney weight was significantly greater in diabetic groups than those in non‐diabetic groups (P < 0.01 for both). The average kidney weight value was the greatest in diabetic Tg, but there was no significant difference between diabetic Tg and diabetic Wt. Treatment with ARI did not have an influence on the changes in bodyweight or blood glucose levels. Reduction of kidney weight approached near non‐diabetic levels in diabetic Tg when treated with ARI (P = 0.08), whereas ARI effects on kidney weight in diabetic Wt were not clear.
Table 1. Bodyweight, blood glucose levels and kidney weight in experimental mice.
| Bodyweight (g) | Blood glucose (mmol/L) | Left kidney weight (mg) | ||||
|---|---|---|---|---|---|---|
| Before | After diabetes | Before | After diabetes | After diabetes | ||
| Non‐diabetic Wt | n = 5 | 23.3 ± 2.6 | 28.8 ± 3.7 | 5.78 ± 0.88 | 6.38 ± 0.49 | 143 ± 17 |
| Diabetic Wt | n = 5 | 23.8 ± 2.1 | 20.0 ± 2.0† | 6.42 ± 0.55 | 26.9 ± 0.9† | 238 ± 23† |
| Diabetic Wt + ARI | n = 5 | 22.6 ± 1.9 | 20.0 ± 1.8† | 6.02 ± 0.41 | 27.2 ± 0.84† | 220 ± 47† |
| Non‐diabetic Tg | n = 5 | 23.5 ± 3.6 | 29.3 ± 6.0 | 5.72 ± 0.83 | 6.32 ± 0.50 | 124 ± 15 |
| Diabetic Tg | n = 5 | 23.0 ± 1.9 | 19.7 ± 2.7‡ | 6.11 ± 0.77 | 26.4 ± 1.62‡ | 265 ± 54‡ |
| Diabetic Tg + ARI | n = 5 | 22.6 ± 2.8 | 19.8 ± 2.4‡ | 5.88 ± 0.71 | 19.8 ± 2.42‡ | 221 ± 33§ |
Values are mean ± SD. †P < 0.01 versus non‐diabetic Wt, ‡P < 0.01 vs non‐diabetic Tg, §P < 0.02 vs non‐diabetic Tg.
ARI, aldose reductase inhibitor; Tg, transgenic expressing human aldose reductase; Wt, control wild‐type mice.
Tissue Carbohydrate Levels
Tissue concentrations of glucose in the renal cortex were significantly increased in both diabetic Tg and diabetic Wt compared with those in non‐diabetic animals (Table 2). Sorbitol was increased by 55% in Tg compared with non‐diabetic Wt (P < 0.02). Although glucose levels of diabetic Tg were similar to those in diabetic Wt, sorbitol was increased 3.0‐fold in diabetic Wt and 3.7‐fold in diabetic Tg compared with the non‐diabetic groups (P < 0.01 for both). Fructose was also increased 3.2‐fold in diabetic Wt and 4.5‐fold in diabetic Tg compared with their non‐diabetic groups (both P < 0.01).
Table 2. Carbohydrate levels in the kidney cortex of experimental mice.
| Glucose (g) (nmol/mg wet weight) | Sorbitol (nmol/mg wet weight) | Fructose (nmol/mg wet weight) | ||
|---|---|---|---|---|
| Non‐diabetic Wt | n = 5 | 2.29 ± 0.14 | 0.036 ± 0.006 | 0.031 ± 0.001 |
| Diabetic Wt | n = 5 | 19.82 ± 3.95† | 0.109 ± 0.021† | 0.098 ± 0.031† |
| Diabetic Wt + ARI | n = 5 | 20.11 ± 2.94† | 0.108 ± 0.005† | 0.160 ± 0.019†‡ |
| Tg | n = 5 | 2.29 ± 0.14 | 0.056 ± 0.011† | 0.034 ± 0.002 |
| Diabetic Tg | n = 5 | 20.86 ± 1.86§ | 0.207 ± 0.057§¶ | 0.153 ± 0.022§¶ |
| Diabetic Tg + ARI | n = 5 | 20.90 ± 2.52§ | 0.080 ± 0.015* | 0.145 ± 0.005§ |
Values are mean ± SD. †P < 0.01 vs non‐diabetic Wt, ‡P < 0.01 vs diabetic Wt, §P < 0.01 vs non‐diabetic Tg, ¶P < 0.01 vs diabetic Wt, *P < 0.01 vs diabetic Tg.
ARI, aldose reductase inhibitor; Tg, transgenic mice expressing human aldose reductase; Wt, control wild‐type mice.
ARI treatment significantly inhibited the increase in sorbitol in diabetic Tg (P < 0.01), but not in diabetic Wt. In contrast, there was no influence of ARI on fructose in diabetic Tg and the level was rather increased in ARI‐treated diabetic Wt compared with untreated diabetic Wt (P < 0.01).
Kidney Structure and Morphometry of Glomeruli
In the renal cortex, both diabetic Tg and diabetic Wt showed enlargement of glomeruli in addition to typical Ebstein–Armanni lesions, showing watery vacuolation of tubular cells of the cortical collecting duct (CCD). Glomerular capillary walls and the mesangial area appeared to be expanded in both diabetic Tg and diabetic Wt when compared with non‐diabetic groups (Figure 1). There was no apparent difference in the vacuolar changes of tubular cells between diabetic Tg and diabetic Wt. Treatment with ARI appeared to suppress the vacuolar changes of tubular cells, swelling of glomeruli and expansion of mesangial areas to a similar extent in both diabetic Tg and diabetic Wt.
Figure 1.
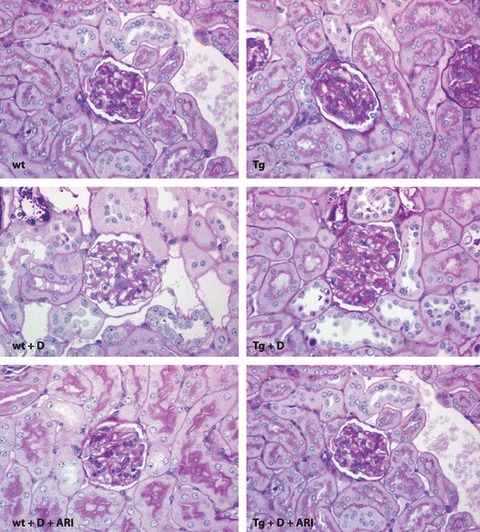
Microscopic features of the renal cortex in experimental mice stained with periodic acid‐Schiff reaction. Both control wild‐type (Wt) mice (upper left) and transgenic mice expressing human aldose reductase (Tg; upper right) showed normal appearance. An 8‐week diabetic condition caused increased glomerular size and vacuolar degeneration of tubular cells both in Wt (left middle) and Tg (right middle). Treatment with aldose reductase inhibitor (ARI) suppressed these changes in diabetic Wt (lower left) and diabetic Tg (lower right). Tg + D, diabetic transgenic mice; Tg + D + ARI, ARI‐treated diabetic Tg; Wt + D, diabetic control mice; Wt + D + ARI, diabetic control mice treated with ARI.
Morphometric analysis showed that TGSA, GTSA and MSA were all greater in diabetic groups than in non‐diabetic groups (Table 3). Average values of these parameters were the greatest in diabetic Tg, but the differences from diabetic Wt were not statistically significant. ARI treatment significantly suppressed the increase in MSA in diabetic Tg compared with the untreated state (P < 0.05), but other measures were not affected. Effects of ARI on the glomerular structure were also unremarkable in diabetic Wt.
Table 3. Morphometric data of the renal glomeruli in experimental mice.
| Total glomerular surface area (mm2) | Glomerular tuft surface area (mm2) | Mesangial thickness (mm2) | Basement membrane (nm) | ||
|---|---|---|---|---|---|
| Non‐diabetic Wt | n = 5 | 3406 ± 321 | 2625 ± 242 | 474 ± 43 | 218 ± 13 |
| Diabetic Wt | n = 5 | 4921 ± 704† | 3594 ± 488† | 737 ± 152† | 218 ± 8 |
| Diabetic Wt + ARI | n = 5 | 4765 ± 374† | 3480 ± 447† | 607 ± 130 | 205 ± 18 |
| Non‐diabetic Tg | n = 5 | 3307 ± 321 | 2477 ± 270 | 484 ± 46 | 249 ± 8‡ |
| Diabetic Tg | n = 5 | 5600 ± 836§ | 3980 ± 515§ | 803 ± 119§ | 221 ± 25 |
| Diabetic Tg + ARI | n = 5 | 5043 ± 368§ | 3523 ± 366§ | 619 ± 83¶* | 216 ± 12§ |
Values are mean ± SD. †P < 0.01 vs non‐diabetic Wt, ‡P < 0.01 vs non‐diabetic Wt and diabetic Tg + ARI, §P < 0.01 vs non‐diabetic Tg, ¶P < 0.02 vs non‐diabetic Tg, *P < 0.05 vs diabetic Tg.
ARI, aldose reductase inhibitor; Tg, transgenic mice expressing human aldose reductase; Wt; control wild‐type mice.
At the ultrastructural levels, diabetic Wt showed dilated capillaries with a thin glomerular basement membrane (GBM), and dilated capillaries were also found in diabetic Tg, which often showed an accumulation of basement membrane‐like materials near the mesangial area. ARI‐treatment did not alter the appearance of the ultrastructure in either diabetic Wt or diabetic Tg. Quantitatively, although GBM in non‐diabetic Tg was thickened compared with that in Wt, the diabetic groups did not show thickening of GBM at this stage and there was no difference in the GBM thickness between diabetic Tg and diabetic Wt. ARI‐treatment did not influence the thickness of GBM.
Western Blot Analysis of AR
As expected, hAR expressions were constantly shown in both the renal medulla and cortex in Tg (Figure 2), whereas hAR was absent in Wt. In contrast, mAR was weakly expressed in the cortical tissues in either Tg or WT in contrast to strong reactions in the medulla. The diabetic condition enhanced the hAR expression in Tg, but the effect on the expression of mAR was uncertain.
Figure 2.
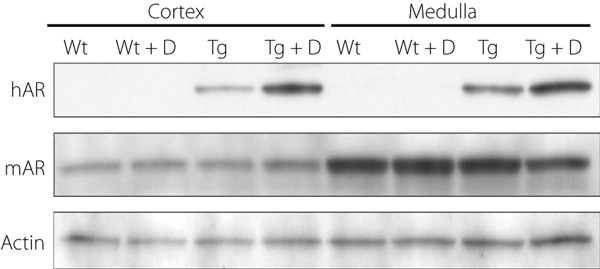
Expressions of human aldose reductase (hAR) and murine aldose reductase (mAR) in experimental mice. hAR was expressed in both the cortex and medulla in transgenic mice expressing hAR (Tg), but not in control wild‐type mice (Wt). In contrast, mAR was expressed strongly in the medulla and less so in the cortex. Diabetic condition (D) enhanced hAR expressions in both the cortex and medulla, whereas the effects of diabetes (D) on the mAR expression were uncertain. Tg + D, diabetic transgenic mice; Tg + D + ARI, aldose reductase inhibitor‐treated diabetic Tg; Wt + D, diabetic control mice; Wt + D + ARI, diabetic control mice treated with aldose reductase inhibitor.
Immunohistochemistry of AR, TonEBP and CML
There was a weakly positive reaction of constitutive mAR in the cortical convoluted duct (CCD) and distal convoluted tubule (DCT) in the cortex to a similar extent between Tg and Wt (Figure 3). Diabetes for 8 weeks slightly enhanced the immunoreactions in the tubular cells of CCD and DCT, but the difference between diabetic Tg and diabetic Wt was not apparent. A portion of mAR‐positive cells were identified as CCD, which were positive for aquaporin 2. TonEBP expressions were also detected in cortical tubular cells and the diabetic condition appeared to increase the expressions in both Tg and Wt (Figure 4). The localization of TonEBP was identified to be DCT and CCD by staining of Na,K‐ATPase α1, similar to the site of mAR positive reactions. hAR was negative in the cortex of control Wt and expressed in tubular cells only in Tg. The expression of hAR was further enhanced in diabetic Tg in which positive reactions were also found in the glomeruli as well as tubular cells. Diabetic mice showed marked vacuolar degenerative changes in CCD that were positive for TonEBP, particularly in diabetic Tg. By treatment with ARI, the expression of TonEBP was suppressed both in diabetic Tg and diabetic Wt.
Figure 3.
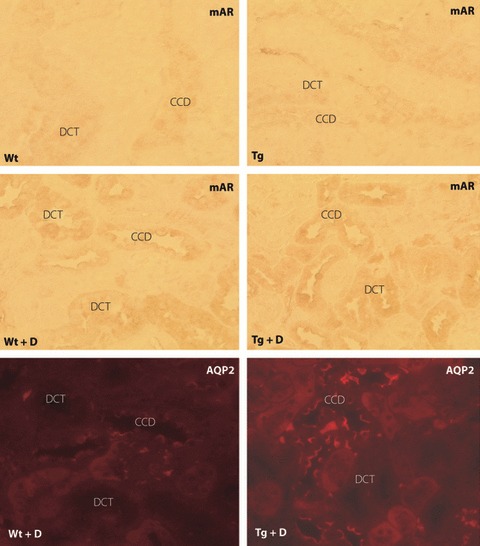
Expression of murine aldose reductase (mAR) in experimental mice. Both control wild‐type mice (Wt) and transgenic mice expressing human aldose reductase (Tg) showed weak expression of mAR in tubular cells of distal convoluted tubules (DCT) and the cortical convoluted duct (CCD). The expression of mAR was enhanced. In both diabetic Wt and diabetic Tg, the location of mAR was identified to be DCT and CCD by positive reactions to aquaporin 2 (AQP2) in serial sections. Tg + D, diabetic transgenic mice; Tg + D + ARI, aldose reductase inhibitor‐treated diabetic Tg; Wt + D, diabetic control mice; Wt + D + ARI, diabetic control mice treated with aldose reductase inhibitor.
Figure 4.
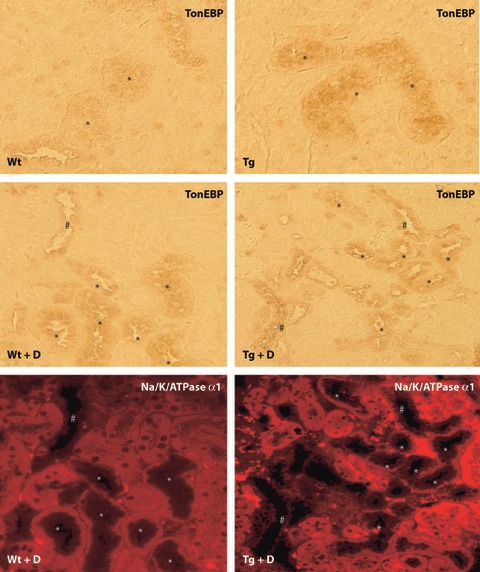
Expression of tonicity‐responsive enhancer binding protein (TonEBP) in experimental mice. Similar to the expression of murine aldose reductase, TonEBP expression was found in distal convoluted tubules (DCT) in both control wild mice (Wt) and transgenic mice expressing human aldose reductase (Tg). The expression of TonEBP appeared to be intensified in diabetic Wt (Wt + D) and diabetic Tg (Tg + D). Na,K‐ATPase α1 immunostaining identified the TonEBP positive cells to be DCT and the cortical collecting duct (CCD). *DCT; #CCD. PT; proximal tubule.
Although there was no immunoreaction of CML in non‐diabetic animals, expressions of CML were shown in tubular cells, particularly of CCD and DCT, but not in the glomeruli in both diabetic Wt and diabetic Tg (Figure 5). The expression of CML was intensified in diabetic Tg compared with that in diabetic Wt, and ARI treatment significantly suppressed the expressions in diabetic Tg. In a similar manner, although there were only weak reactions of TonEBP in cortical tubular cells in non‐diabetic Wt and non‐diabetic Tg (Figure 4), the reactions of TonEBP were enhanced in diabetic Wt and diabetic Tg, the latter of which showed more intensified reactions (Figure 6). Treatment with ARI significantly suppressed the expression of TonEBP. The deposition of CML in tubular cells of CCD and DCT underwent severe vacuolar degenerative changes and also stained positive with hAR and TonEBP (Figure 7).
Figure 5.
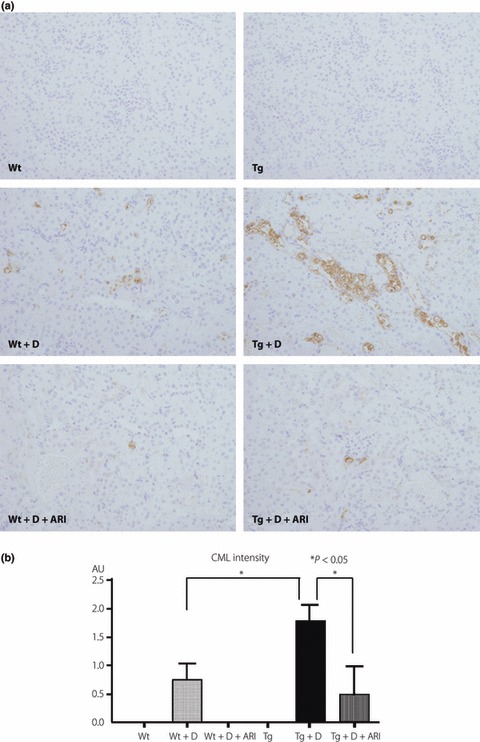
Comparison of immunohistochemical expressions of carboxymethyllysine (CML), an advanced glycation end‐product, in control and diabetic mice. (a) In non‐diabetic conditions, no positive reactions were detected in either control wild‐type mice (Wt) or transgenic mice expressing human aldose reductase (Tg). In diabetic conditions, positive reactions were detected in mainly distal convoluted tubules (DCT) as well as the cortical collecting duct (CCD), and diabetic Tg (Tg + D) showed enhanced expressions compared with diabetic Wt (Wt + D). Treatment with aldose reductase inhibitor (ARI) suppressed these reactions. (b) Semiquantitative evaluation confirmed the augmented expression of CML in diabetic Tg compared with diabetic Wt. Treatment with ARI suppressed the expression of CML. Tg + D + ARI, ARI‐treated diabetic Tg; Wt + D + ARI; diabetic control mice treated with ARI.
Figure 6.
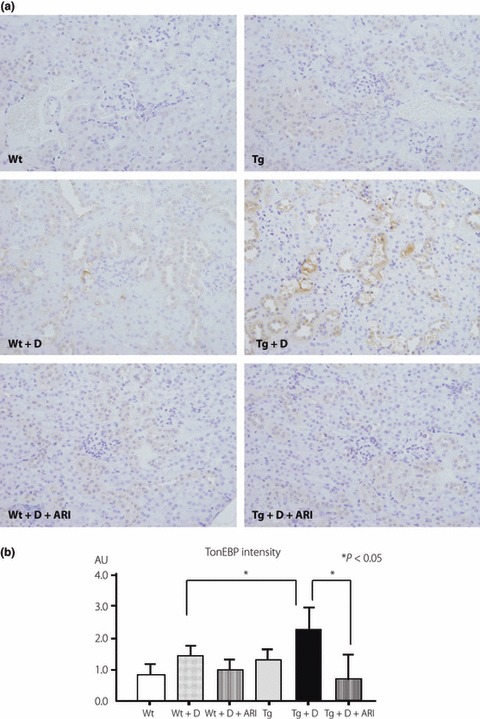
Comparison of immunohistochemical expressions of tonicity‐responsive enhancer binding protein (TonEBP) in control and diabetic mice. (a) In non‐diabetic conditions, only faint reactions were detected in either control wild‐type mice (Wt) or transgenic mice expressing human aldose reductase (Tg). In diabetic conditions, positive reactions were clearly detected in mainly distal convoluted tubules (DCT) as well as the cortical collecting duct (CCD). Diabetic Tg (Tg + D) showed enhanced expressions of TonEBP compared with diabetic Wt (Wt + D). Treatment with aldose reductase inhibitor (ARI) suppressed these reactions. (b) Semiquantitative evaluation confirmed the augmented expression of carboxymethyllysine (CML) in diabetic Tg compared with diabetic Wt. Treatment with ARI suppressed the expression of TonEBP. Tg + D + ARI, ARI‐treated diabetic Tg; Wt + D + ARI, diabetic control mice treated with ARI.
Figure 7.
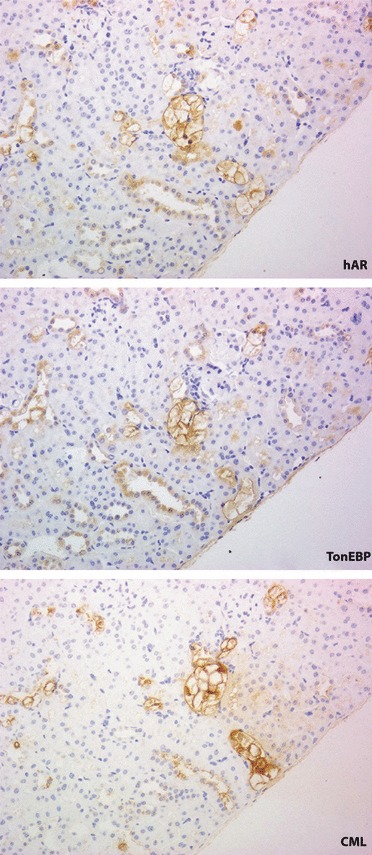
Topographic relationship of human aldose reductase (hAR) with the expressions of tonicity‐responsive enhancer binding protein (TonEBP) and carboxymethyllysine (CML) on the serial sections in diabetic transgenic mouse expressing hAR. Marked vacuolar degeneration was found in distal convoluted tubules and cortical collecting ducts that expressed TonEBP. The affected cells corresponded to those that strongly reacted with CML.
Discussion
In the present study, 8 weeks of diabetic duration caused a significant accumulation of sorbitol and fructose in both Tg and Wt, but to a greater extent in Tg than in Wt. Although there was not as much AR in the renal cortex of mouse tissues compared with the medulla, our results clearly showed the expression of mAR in tubular cells of CCD and DCT, and polyol accumulation in the murine diabetic kidney. hAR expression was widely distributed in Tg, including some proximal tubular cells as well as glomerular cells. It is noteworthy that the diabetic condition enhanced the expression of hAR and TonEBP in tubular cells of DCT and CCD in both diabetic Wt and diabetic Tg, but more prominently in the latter. Concurrently, CCD cells showed increased expressions of CML associated with vacuolar degenerative changes. The tubular changes of CCD and DCT were accompanied by increased mesangial expansion in diabetic Tg. Because CML represents advanced glycation end‐products (AGE) that mainly result from modification of proteins by oxidative stress25, increased flux of the polyol pathway might exert the release of free radicals, perhaps by downregulating glutathione synthesis through the consumption of niconinamide adenine diphosphate (NADPH), resulting in cellular injury16,17. The fact that ARI suppressed such pathological changes in renal tubular cells together with the reduction of the expanded mesangial area in diabetic Tg might support the contention that the enhanced polyol pathway might have a causal role in the development of early diabetic nephropathy through alterations of tubuloglomerular feedback systems26,27.
Immunohistochemical staining clearly disclosed the predominant site of constitutive mAR in CCD and DCT with the expression of TonEBP. The localization of mAR was in keeping with the site of osmoregulation for the transport of electrolytes and proteins27,28. In the present study, 8‐week diabetes enhanced the expression of AR and TonEBP in DCT and CCD, which showed vacuolated cytoplasm, indicating that these cells are a major target for the cellular injury by diabetes. Interestingly, forced expression of hAR in the renal cortex further enhanced the expression of TonEBP only at the site of CCD, although the hAR expressions were more widely distributed. The CML reactions were further enhanced in CCD and DCT in diabetic Tg. It is therefore likely that vacuolar degenerative changes might be related not simply to the hAR‐induced flux of polyol pathway, but depend on the induction of TonEBP‐mediated osmotic imbalance or impaired electrolyte transport. Upregulation of TonEBP in the cortex in response to diabetes might be a result of increased local tonicity, which might in turn augment expression of AR. In this setting, increased delivery of tubular fluid to the distal tubule might result in an increase in interstitial tonicity as a result of elevated sodium reabsorption. However, non‐osmotic factors might also be involved in the upregulation of TonEBP, because sorbitol accumulation is shown to lower cellular potassium concentration and reduce TonEBP expression in in vitro experiments29.
In previous studies, little attention has been paid to early tubular changes as the cause of development of diabetic nephropathy. Most studies on the role of the polyol pathway concentrated on only early glomerulopathy in diabetes, which has been ascribed to intraglomerular metabolic abnormalities30,31. Excessive flux from glucose to sorbitol in the vessel wall, associated with an altered redox state, was proposed to cause glomerular hyperfiltration, and structurally glomerular hypertrophy and mesangial expansion32,33. In this setting, alterations of diacylglycerol and protein kinase C activity in the glomerular vasculature were considered to cause increased capillary permeability and structural changes34,35. In addition, an increase in inducible nitric oxide synthase (NOS) might also lead to altered glomerular hemodynamics in diabetes36. In contrast to these hypotheses, the present study is the first to examine the relationship between renal tubular cells and glomerular alterations by observing both glomerular structure and renal tubular cells. In our previous study, we showed early vacuolar alterations of macula densa and the reduction of constitutive NOS activity in STZ diabetic rats from 6‐week diabetes duration37. With activation of polyol flux, competitive consumption of NADPH through conversion of glucose to sorbitol by AR in tubular cells results in depletion of constitutive NOS, altering the poor regulation of vascular tone at the site of the juxtaglomerular apparatus37. Our current findings of early vacuolar degeneration of CCD and DCT found in diabetic Tg might therefore underlie the strong causal relationship between early tubular changes and the enhanced polyol pathway at the site of the juxtaglomerular area where the changes of CCD and DCT contribute to glomerular alterations.
Our morphometric studies on renal glomeruli showed that the diabetic condition led to increased kidney weight, and enlargement of glomerular size and the mesangial area. In the STZ diabetic model, early glomerular hypertrophy is characteristic. Compared with diabetic Wt, diabetic Tg showed a trend of exaggerated glomerular pathology. ARI treatment significantly suppressed the increase in the mesangial area in diabetic Tg. It is not clear, however, from our results whether tubular changes precede glomerular pathology or vice versa, because we only examined a single time‐point. In the present study, we could only study a limited number of animals with 8‐week diabetic duration. A longer duration of more than 6 months with milder hyperglycemia to examine the effects of the polyol pathway on the structural glomerulopathy in diabetes in our model would be of interest.
In the present study, we could not find significant thickening of the GBM in diabetic groups, although its thickness was greater in Tg than Wt in the non‐diabetic condition. Thickening of the capillary basement membrane is characteristic in the retina or glomeruli in animal models when the polyol pathway is activated under prolonged galactosemia (6–10 months)38 or diabetic condition39. Because early diabetes causes glomerular hyperfiltration with increased intraluminar pressure of glomerular capillaries33,40, GBM might be thinned as a result of capillary dilatation with increased intraluminal pressure, and the thickening was not apparent at this early stage of diabetes.
The effects of ARI on tubular and glomerular changes were not remarkable in diabetic Wt. This finding shows that nephropathic changes in diabetic animals develop in part under polyol‐independent metabolic abnormalities. Non‐enzymatic glycation30, excessive oxidative stress31 as well as altered protein kinase C activities34,35 can be listed as other causative factors. AGE are now established to comprise a variety of glucose‐derived or aldehyde‐derived addicts of proteins41. CML, a glucose‐derived prototype of AGE, was deposited in renal tubular cells in diabetic Tg and diabetic Wt, and its expression was inhibited by ARI‐treatment. Thus, non‐glucose derived AGE might also be implicated in the causation of diabetic glomerulopathy, because pentosidine or pyrraline‐type AGE were shown to deposit in nodular lesions in the human diabetic kidney42,43.
In conclusion, diabetic Tg were found to show marked tubular cell degeneration and CML deposition with polyol accumulation, together with glomerular hypertrophy and mesangial expansion. ARI treatment was partially effective to prevent mesangial expansion only in diabetic Tg.
Acknowledgements
The present study was supported by grants to SY from the Japanese Ministry of Education, Science, Sports and Culture (#10470054) and The Japan Diabetes Foundation, and to HMK from NIH (RO1DK42479). There is no conflict of interest for all listed authors. The excellent technical help of Ms Yuko Sasaki, Nozomi Masuta and Kaori Okamoto is greatly acknowledged.
References
- 1.Greene DA, Lattimer SA, Sima AA. Sorbitol, phosphoinositides, and sodium‐potassium‐ATPase in the pathogenesis of diabetic complications. N Engl J Med 1987; 316: 599–606 [DOI] [PubMed] [Google Scholar]
- 2.Kinoshita JH, Nishimura C. The involvement of aldose reductase in diabetic complications. Diabetes Metab Rev 1988; 4: 323–337 [DOI] [PubMed] [Google Scholar]
- 3.Larkins RG, Dunlop ME. The link between hyperglycaemia and diabetic nephropathy. Diabetologia 1992; 35: 499–504 [DOI] [PubMed] [Google Scholar]
- 4.Pugliese G, Pricci F, Pugliese F, et al. Mechanisms of glucose‐enhanced extracellular matrix accumulation in rat glomerular mesangial cells. Diabetes 1994; 43: 478–490 [DOI] [PubMed] [Google Scholar]
- 5.Jiang T, Che Q, Lin Y, et al. Aldose reductase regulates tgf‐beta1‐induced production of fibronectin and type iv collagen in cultured rat mesangial cells. Nephrology (Carlton) 2006; 11: 105–112 [DOI] [PubMed] [Google Scholar]
- 6.Goldfarb S, Ziyadeh FN, Kern EF, et al. Effects of polyol‐pathway inhibition and dietary myo‐inositol on glomerular hemodynamic function in experimental diabetes mellitus in rats. Diabetes 1991; 40: 465–471 [DOI] [PubMed] [Google Scholar]
- 7.Beyer‐Mears A, Mistry K, Diecke FP, et al. Zopolrestat prevention of proteinuria, albuminuria and cataractogenesis in diabetes mellitus. Pharmacology 1996; 52: 292–302 [DOI] [PubMed] [Google Scholar]
- 8.Mauer SM, Steffes MW, Azar S, et al. Effects of sorbinil on glomerular structure and function in long‐term‐diabetic rats. Diabetes 1989; 38: 839–846 [DOI] [PubMed] [Google Scholar]
- 9.Pedersen MM, Christiansen JS, Mogensen CE. Reduction of glomerular hyperfiltration in normoalbuminuric IDDM patients by 6 mo of aldose reductase inhibition. Diabetes 1991; 40: 527–531 [DOI] [PubMed] [Google Scholar]
- 10.Shah VO, Scavini M, Nikolic J, et al. Z‐2 microsatellite allele is linked to increased expression of the aldose reductase gene in diabetic nephropathy. J Clin Endocrinol Metab 1998; 83: 2886–2891 [DOI] [PubMed] [Google Scholar]
- 11.Hamada Y, Kitoh R, Raskin P. Crucial role of aldose reductase activity and plasma glucose level in sorbitol accumulation in erythrocytes from diabetic patients. Diabetes 1991; 40: 1233–1240 [DOI] [PubMed] [Google Scholar]
- 12.Maeda S, Haneda M, Yasuda H, et al. Diabetic nephropathy is not associated with the dinucleotide repeat polymorphism upstream of the aldose reductase (alr2) gene but with erythrocyte aldose reductase content in Japanese subjects with type 2 diabetes. Diabetes 1999; 48: 420–422 [DOI] [PubMed] [Google Scholar]
- 13.Yagihashi S, Wada R, Yamagishi S‐I, et al. Polyol‐related pathway and its pathological abnormality: evaluation of the transgenic mice which express human aldose reductase In: Baba S, Kaneko T (eds). Diabetes 1994. Elsevier Sci Publ BV, Amsterdam, Netherland: 1995; 326–330 [Google Scholar]
- 14.Yamaoka T, Nishimura C, Yamashita K, et al. Acute onset of diabetic pathological changes in transgenic mice with human aldose reductase cDNA. Diabetologia 1995; 38: 255–261 [DOI] [PubMed] [Google Scholar]
- 15.Yagihashi S, Yamagishi S, Wada R, et al. Galactosemic neuropathy in transgenic mice for human aldose reductase. Diabetes 1996; 45: 56–59 [DOI] [PubMed] [Google Scholar]
- 16.Uehara K, Yamagishi S, Otsuki S, et al. Effects of polyol pathway hyperactivity on protein kinase c activity, nociceptive peptide expression, and neuronal structure in dorsal root ganglia in diabetic mice. Diabetes 2004; 53: 3239–3247 [DOI] [PubMed] [Google Scholar]
- 17.Hwang YC, Kaneko M, Bakr S, et al. Central role for aldose reductase pathway in myocardial ischemic injury. FASEB J 2004; 18: 1192–1199 [DOI] [PubMed] [Google Scholar]
- 18.Iwata K, Matsuno K, Nishinaka T, et al. Aldose reductase inhibitors improve myocardial reperfusion injury in mice by a dual mechanism. J Pharmacol Sci 2006; 102: 37–46 [DOI] [PubMed] [Google Scholar]
- 19.Nishimura C, Yamaoka T, Mizutani M, et al. Purification and characterization of the recombinant human aldose reductase expressed in baculovirus system. Biochim Biophys Acta 1991; 1078: 171–178 [DOI] [PubMed] [Google Scholar]
- 20.Hogan B, Constantini F, Lacy E. Manipulating the Mouse Embryo: A Laboratory Manual. Cold Spring Harbor Laboratory, Cold Spring Harbor, NY, 1986. [Google Scholar]
- 21.Sassy‐Prigent C, Heudes D, Jouquey S, et al. Morphometric detection of incipient glomerular lesions in diabetic nephropathy in rats. Protective effects of ace inhibition. Lab Invest 1995; 73: 64–71 [PubMed] [Google Scholar]
- 22.Jensen EB, Gundersen HJ, Osterby R. Determination of membrane thickness distribution from orthogonal intercepts. J Microsc 1979; 115: 19–33 [DOI] [PubMed] [Google Scholar]
- 23.Terubayashi H, Sato S, Nishimura C, et al. Localization of aldose and aldehyde reductase in the kidney. Kidney Int 1989; 36: 843–851 [DOI] [PubMed] [Google Scholar]
- 24.Cha JH, Woo SK, Han KH, et al. Hydration status affects nuclear distribution of transcription factor tonicity responsive enhancer binding protein in rat kidney. J Am Soc Nephrol 2001; 12: 2221–2230 [DOI] [PubMed] [Google Scholar]
- 25.Nagai R, Unno Y, Hayashi MC, et al. Peroxynitrite induces formation of n(ε)‐(carboxymethyl) lysine by the cleavage of amadori product and generation of glucosone and glyoxal from glucose: Novel pathways for protein modification by peroxynitrite. Diabetes 2002; 51: 2833–2839 [DOI] [PubMed] [Google Scholar]
- 26.Zhang Z, Ferraris JD, Brooks HL, et al. Expression of osmotic stress‐related genes in tissues of normal and hyposmotic rats. Am J Physiol Renal Physiol 2003; 285: F688–F693 [DOI] [PubMed] [Google Scholar]
- 27.Thomas MC, Burns WC, Cooper ME. Tubular changes in early diabetic nephropathy. Adv Chronic Kidney Dis 2005; 12: 177–186 [DOI] [PubMed] [Google Scholar]
- 28.Ferraris JD, Williams CK, Jung KY, et al. ORE, a eukaryotic minimal essential osmotic response element. The aldose reductase gene in hyperosmotic stress. J Biol Chem 1996; 271: 18318–18321 [DOI] [PubMed] [Google Scholar]
- 29.Neuhofer W, Woo SK, Na KY, et al. Regulation of tonEBP transcriptional activator in mdck cells following changes in ambient tonicity. Am J Physiol Cell Physiol 2002; 283: C1604–C1611 [DOI] [PubMed] [Google Scholar]
- 30.Soulis‐Liparota T, Cooper ME, Dunlop M, et al. The relative roles of advanced glycation, oxidation and aldose reductase inhibition in the development of experimental diabetic nephropathy in the Sprague‐Dawley rat. Diabetologia 1995; 38: 387–394 [DOI] [PubMed] [Google Scholar]
- 31.Baynes JW, Thorpe SR. Role of oxidative stress in diabetic complications: A new perspective on an old paradigm. Diabetes 1999; 48: 1–9 [DOI] [PubMed] [Google Scholar]
- 32.Williamson JR, Chang K, Frangos M, et al. Hyperglycemic pseudohypoxia and diabetic complications. Diabetes 1993; 42: 801–813 [DOI] [PubMed] [Google Scholar]
- 33.Tilton RG, Chang K, Pugliese G, et al. Prevention of hemodynamic and vascular albumin filtration changes in diabetic rats by aldose reductase inhibitors. Diabetes 1989; 38: 1258–1270 [DOI] [PubMed] [Google Scholar]
- 34.Lynch JJ, Ferro TJ, Blumenstock FA, et al. Increased endothelial albumin permeability mediated by protein kinase c activation. J Clin Invest 1990; 85: 1991–1998 [DOI] [PMC free article] [PubMed] [Google Scholar]
- 35.Koya D, King GL. Protein kinase C activation and the development of diabetic complications. Diabetes 1998; 47: 859–866 [DOI] [PubMed] [Google Scholar]
- 36.Sugimoto H, Shikata K, Matsuda M, et al. Increased expression of endothelial cell nitric oxide synthase (ecNOS) in afferent and glomerular endothelial cells is involved in glomerular hyperfiltration of diabetic nephropathy. Diabetologia 1998; 41: 1426–1434 [DOI] [PubMed] [Google Scholar]
- 37.Yagihashi N, Nishida N, Seo HG, et al. Expression of nitric oxide synthase in macula densa in streptozotocin diabetic rats. Diabetologia 1996; 39: 793–799 [DOI] [PubMed] [Google Scholar]
- 38.Robinson WG Jr, Laver NM, Jacot JL, et al. Diabetic‐like retinopathy ameliorated with the aldose reductase inhibitor way‐121,509. Invest Ophthalmol Vis Sci 1996; 37: 1149–1156 [PubMed] [Google Scholar]
- 39.Chakrabarti S, Sima AA. Effect of aldose reductase inhibition and insulin treatment on retinal capillary basement membrane thickening in bb rats. Diabetes 1989; 38: 1181–1186 [DOI] [PubMed] [Google Scholar]
- 40.Hostetter TH, Rennke HG, Brenner BM. The case for intrarenal hypertension in the initiation and progression of diabetic and other glomerulopathies. Am J Med 1982; 72: 375–380 [DOI] [PubMed] [Google Scholar]
- 41.Sato T, Iwaki M, Shimogaito N, et al. TAGE (toxic ages) theory in diabetic complications. Curr Mol Med 2006; 6: 351–358 [DOI] [PubMed] [Google Scholar]
- 42.Suzuki D, Miyata T, Saotome N, et al. Immunohistochemical evidence for an increased oxidative stress and carbonyl modification of proteins in diabetic glomerular lesions. J Am Soc Nephrol 1999; 10: 822–832 [DOI] [PubMed] [Google Scholar]
- 43.Horie K, Miyata T, Maeda K, et al. Immunohistochemical colocalization of glycoxidation products and lipid peroxidation products in diabetic renal glomerular lesions. Implication for glycoxidative stress in the pathogenesis of diabetic nephropathy. J Clin Invest 1997; 100: 2995–3004 [DOI] [PMC free article] [PubMed] [Google Scholar]