Abstract
Bloch surface waves (BSWs) on one-dimensional photonic crystals (1DPC) have been used to beam the fluorescence emission from the dye molecules. All dielectric 1DPC displays its low propagating loss, narrow resonance and the absence of absorption or quenching. In this letter, back focal plane imaging reveals that in addition to the BSW mode, a guided mode and cavity mode also exist in the 1DPC which all couple with the excited dye molecules. The appearance of these modes is sensitive to the wavelength of the fluorescence and alters the beaming effect by the 1DPC. Numerical simulations verify the existence of these modes which are consistent with the experimental results. Comparisons between the Bloch surface wave-coupled emission (BWCE) and surface plasmon-coupled emission (SPCE) are also presented for a more clear understanding of the multilayered film-enabled directional emission.
Keywords: Bloch Surface waves, One-dimensional photonic crystals, Dye molecules, Fluorescence, Back focal plane imaging
1.Introduction
Fluorescence is widely used in the chemical and biological science. Fluorescence detection provides information on a wide range of molecular processes, including the interactions of solvent molecules with fluorophores, rotational diffusion of biomolecules, and distances between two interacting sites on biomolecules, conformational changes and binding interactions[1]. Fluorescence detection is also widely used in cell imaging, sequencing and in diagnostics. For these applications, the collection efficiency of the fluorescence signal is a highly important concern. It is well known that the spontaneous emission from fluorescence dye molecules or their aggregates is highly divergent, which is unfavorable for the signal collection efficiency. Efforts have been made to modulate the fluorescence emission direction. For example, optical nanoantennas made of metallic nano-structures have been used to beam the fluorescence emission from the fluorescent quantum dots which are within near-field distances from the antenna [2,3]. Gold nano-apertures surrounded by periodic corrugations were used to transform standard fluorescent molecules into bright unidirectional sources [4]. Unstructured planar silver or gold thin films have also been used to beam the fluorescence emission. This phenomenon is known as surface plasmon-coupled emission (SPCE) [5–7]. In SPCE some of the energy is dissipated by the metals and results in a modest angular divergence [8]. Inspired by the ideal features of SPCE, Bloch surface waves (BSWs) on one-dimensional photonic crystals (1DPC) are used to modulate the direction of light emission from the dye molecules [9,10]. The existence of BSWs on 1DPCs were originally introduced by Yeh [11,12]. These are the propagation modes localized at the surface of the 1DPC. The BSWs may be considered as the dielectric analogues of the surface plasmon waves (SPWs) on the surface of noble metallic films. In the same principle of SPCE, the dye molecules on the 1DPC can also couple with the BSWs and result in the Bloch surface wave-coupled emission (BWCE) [13]. Due to the lower loss of the dielectric films over that of metallic films, the BWCE presents clear advantages of smaller divergence of the direction emission, spectral and polarization tunability [10]. The fluorophores will not be quenched by the 1DPC when close to the surface as occurs near metallic films. Enhanced emission is possible for the entire evanescent field, not just the region beyond 5 nm from the surface[14]. Dielectric nanostructures can be fabricated on the 1DPC for further improving the fluorescence extraction from organic dyes molecules [15–17]. For example, a significant improvement in the total fluorescence collection is obtained when a circular grating is fabricated on the 1DPC [18]. Our experimental results revealed that the performance of the 1DPC enabled directional emission is very sensitive to the wavelengths of the fluorescence. By using the band-pass filters, single wavelengths from the fluorescence of the dye molecules or white light source is selected. Back focal plane imaging technology is used to investigate the optical modes in the 1DPC and also the fluorescence emission modulated by the 1DPC at selected wavelengths. The experimental results show that in addition to the BSWs, at certain wavelengths, other modes also exist in the 1DPC. These modes also simultaneously couple with the emitters (such as dye molecules) and result in the modulation of the fluorescence emission. Coupling of surface-localized fluorophores to the guided and cavity modes is surprising given their location within the 1DPC. The loss of these modes is larger than that of the BSWs and the directionality of this emission will not be as good as BWCE. Due to the existence of these modes, the fluorescence will not be completely directed into one direction. The beaming effect of the 1DPC will be more complex. However, coupling to these modes provides additional opportunities for using 1DPCs to control the spatial distribution of fluorescence. The consistency between the numerical simulation and experimental results reveals that these modes are the guided modes and cavity modes supported by the 1DPC. Fluorescence spectra of the dye molecules which are commonly used in biology are very broad, and the investigation of the wavelength's influence is necessary for the 1DPC's applications in fluorescence based biological sensing and imaging.
2.Methods
The 1DPC structure used in the present study was made by plasma-enhanced chemical vapor deposition (PECVD) of SiO2 and Si3N4 on cover glass (0.17mm thickness). This structure consisted of alternating layers of SiO2 (126nm thickness), as a low (L) refractive index, and Si3N4 (78 nm thickness) as the high (H) refractive index dielectric layer. There are fourteen layers in the structure as shown in Figure 1. The thickness of the top SiO2 layer is 152 nm (Figure 1). The targeted thicknesses were chosen because this structure was previously shown to display BSWs[13]. A rhodamine B (RhB) doped PMMA film was spin-coated on the upper surface of the 1DPC structure with a thickness near 60nm and much smaller than the wavelength of the fluorescence from RhB molecules. Hence the dye molecules RhB are within a near-field distance of the 1DPC. The concentration of the RhB molecules in the PMMA solution (A2, 2% PMMA in anisole, Micro Chem, German) is about 10−3 M.
Figure 1.
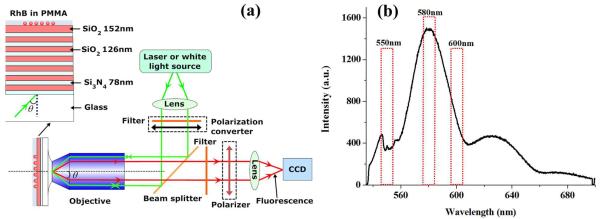
(a) Schematic of the experimental set up and the 1DPC layers construction. The filter, polarization converter and polarizer shown in the dash-line boxes will be used when needed. (b) fluorescence spectrum from the RhB molecules doped in the PMMA film on the 1DPC.
A schematic of the experimental set-up is shown in Figure 1. An oil-immersed objective (60X, N.A. 1.42) is used to focus the excitation laser beam or white light source onto the 1DPC. The same objective is also used to collect the fluorescence emission from the 1DPC. The wavelength of the excitation laser beam is 532 nm. A 532 nm long pass edge filter and a band-pass filter are used to reject the excitation laser beam and allow only the fluorescence at particular wavelength to reach the CCD detector. The emission spectrum from the RhB molecules is broad (Figure 1b). Three band-pass filter are used to select the particular wavelength regions of the fluorescence spectrum. The center wavelengths of the used band-pass filters are 550nm, 580nm and 600nm. The wavelength regions that are under observation using different filters are highlighted with red boxes in Figure 1(b). The full-width at half-maximum (FWHM) of the filters is 10nm. With the band-pass filters, the influence of the 1DPC on the fluorescence emission from a dye molecule at different wavelengths can be investigated. The spectrum in Figure 1(b) is measured with the set-up shown in Figure 1 (a), where the CCD is replaced with a spectrometer from Ocean Optics (QE 6500). An optional linear polarizer is placed after the filters to determine the polarization state of the emitting fluorescence. An optical lens is placed before the CCD detector to realize the back focal plane (BFP) imaging of the objective. The sample (1DPC) is placed on the focal plane (or imaging plane) of the objective. The intensity distribution of the fluorescence on the BFP images allows the emitting angle to be derived.
3.Experimental results
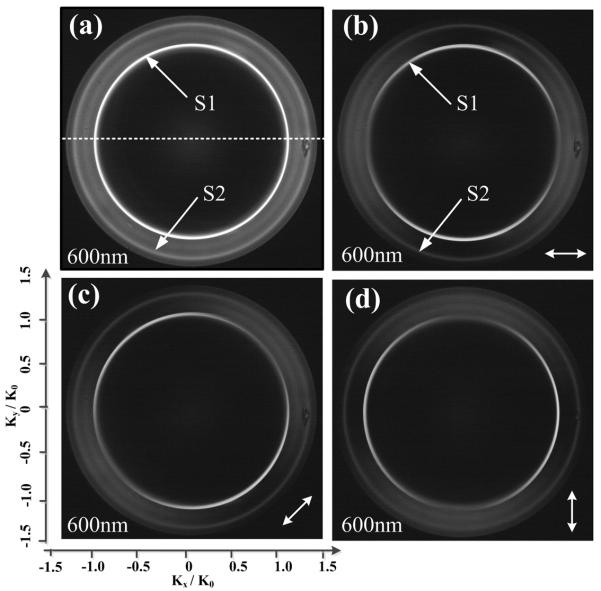
Figure 2 (a) presents the intensity distribution of the RhB fluorescence on the BFP of the objective. A similar observation was reported previously on Figure 3(a) of Ref [18]. The center wavelength of the band-pass filter used here is 600nm. On the BFP images, one distinct bright ring (S1) is noticed. As we know, every point on the BFP image corresponds to an emitting or leaky angle of the fluorescence [19,20,21]. The narrow bright ring on Figure 2 (a) shows the directional fluorescence emission to have a small angular divergence. Based on the known N.A of the objective, the emitting angle (θ) of 46.2° can be derived from the diameter of the ring. In addition to the S1 ring, ring (S2) also appeared in the BFP image. The fluorescence intensity of S2 ring is weaker than that of the S1 ring. The diameter of the S2 ring is larger than that of S1, which means a larger emitting angle. The derived angle for the S2 ring is 61.5°.
Figure 2.
BFP images of the fluorescence from the RhB doped PMMA film at 600 nm The thickness of the PMMA on the 1DPC is 60 nm. The white arrow lines shown in (b), (c) and (d) represent the direction of the polarizer. The center wavelength of the band-pass filter is 600nm.
Figure 3.
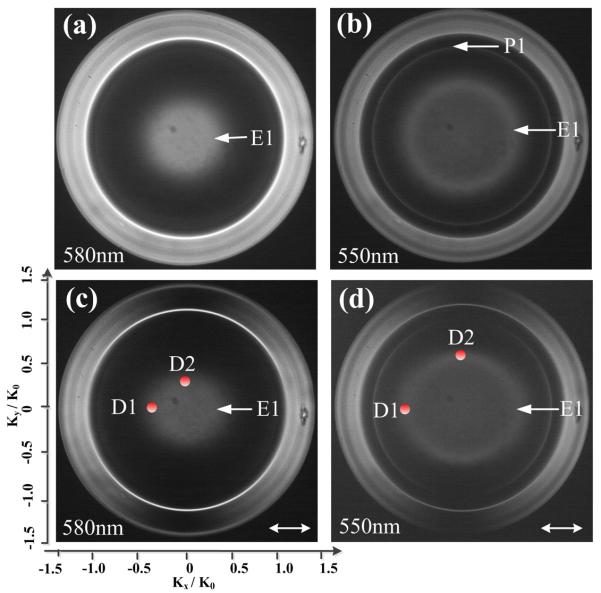
The BFP images of the fluorescence from the RhB doped PMMA film on the 1DPC. The center wavelengths of the band-pass filters are 580nm (a, c) and 550nm (b, d). The white arrow lines shown in (c) and (d) represent the direction of the polarizer.
The polarization state of the fluorescence on the bright rings can be determined by using a polarizer before the CCD detector. For different orientations of the linear polarizer, the corresponding BFP images of the fluorescence are captured and shown in Figure 2 (b), (c) and (d). Based on the intensity changes of the bright rings (S1 or S2) with rotation of the polarizer, we found that the bright rings (S1 or S2) are of azimuthally or S-polarized. In other words, the polarization direction of each light spot on the bright rings is along the tangential of ring [22]. Fluorescence from the RhB molecules randomly doped in the PMMA film is modulated to the azimuthally polarized beam by the 1DPC.
If other band-pass filters (center wavelength at 550nm and 580nm) are used, the beaming effect of the 1DPC on the fluorescence is more complex. Figure 3 (a) and (b), shows that the BSW ring has comparable intensities to a wider ring at larger angles, and further there are fluorescence signals appearing on the center of the images. When a polarizer is placed before the CCD, the BFP images are changed as shown in Figure 3 (c) and (d). The shape of the center fluorescence distribution becomes elongated, such as the ring E1 on Figure 3 (b) changed from circular to elliptical (Figure 3d). The center fluorescence signals may be associated with optical modes of different polarizations. To qualitatively represent the emitting angles of these fluorescence, four points (D1,D2) are selected on the edges of the center fluorescence as shown in Figure 3 (c) and (d). The corresponding radial angles of these two points on (c) can be derived as 14.99° (D1) and 12.02° (D2). The angles of the two points on (d) are 26.27 ° (D1), 21.68°(D2). This appearance of the fluorescence on the center of the BFP images means that there is fluorescence emitting at different angles except for the angles determined by the ring S1 or S2. In other word, the complex patterns on the BFP images (Figure 3) represent that the fluorescence coupled with the 1DPC radiates into various directions and has not been directed into one direction. The size of the center fluorescence on the BFP image is also not small which corresponds to the large angular divergence of the fluorescence emission. So when the wavelength is at 550nm or 580nm, the fluorescence has not been fully directed or beamed. Whereas, Figure 2 displays only two narrow bright rings (S1 and S2). The BFP images shown in Figure 2 and 3 reveal that the fluorescence beamed effect of the 1DPC is sensitive to the wavelength of the fluorescence.
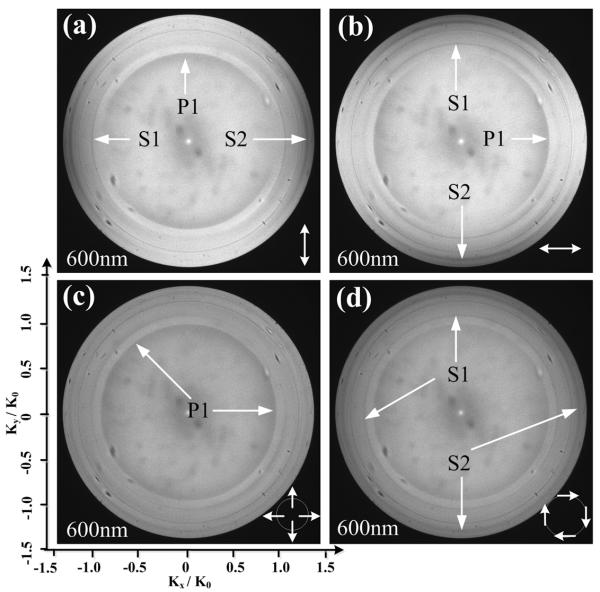
The above experiments represent an energy conversion from near-field to the far-field, where the near-field fluorescence coupled with the 1DPC resulted in the directional far-field radiation. For comparisons, experiments of the reverse process were also carried out, where the far-field optical light are used to interact with the optical modes on or inside 1DPC. This is an energy conversion from far-field radiation to optical modes in the 1DPC. For this purpose the laser in Figure 1(a) is replaced with a bromine tungsten lamp. A band-pass filter is placed after the white-light source to select light with a 600nm wavelength. A polarization converter (RPC, ARCoptix, Switzerland) is used to obtain different polarizations of the light, such as linearly, radially and azimuthally polarized light[23]. The light is then collimated and expanded to fill the oil-immersed objective as shown in Figure 1(a). Although the radially/azimuthally beam is of doughnut shape, the hollow area of the beam is much small. And also when they are focused by the high numerical aperture objective, a very tiny optical probe on the surface of the 1DPC may be generated, which is the same as focusing a radially polarized beam onto a thin silver film by high NA objective[24]. So the doughnut shape beam used here will not affect the BFP images which is also verified by our previous paper [25]. By this configuration, the light at 600nm wavelength can illuminate the 1DPC with all incident angles (θ) ranging from −69° to 69°. The BFP images of the reflected light from the 1DPC are captured and presented in Figure 4. When the incident light is linearly polarized, three pairs of dark arcs (P1, S1, S2) appear on the BFP images [Figure 4 (a) and (b)]. When the incident light is radially polarized, the P1 becomes a full ring [Figure 4 (c)]. In the case of azimuthally polarized light we see only S1 and S2 rings (Figure 4 (d)). Due to the axial symmetry of the objective, the radially polarization is equal to the P-polarization and the azimuthal polarization is S-polarization with respect to the plane of the 1DPC. From the relation between the position of these arcs and the polarization of the incident light, we can judge that the dark arcs P1 is associated with decreased reflectivity of P-polarized light, and the arcs S1 and S2 with decreased reflectivity of S-polarized light. The corresponding radial angles (θ) of the three pairs of arcs are about 40.3°, 45.9°, and 61.5° respectively. The angle values of the two pairs of dark arcs (S1, S2) are consistent with those of bright rings (S1, S2) on Figure 2, and also their polarizations are consistent. We assume that they are related with the same modes supported by the 1DPC, and are responsible for BWCE.
Figure 4.
BFP images of the reflected 600 nm light from 1DPC. A white light source with a 600 nm band-pass filter is used to illuminate the 1DPC structure. The incident light is linearly polarized (a) (b), or radially polarized (c) or azimuthally polarized (d). The white arrow lines represent the direction of the polarization. The dark arcs or rings (S1, S2, and P1) are the equivalents to the dips on the reflectivity curves.
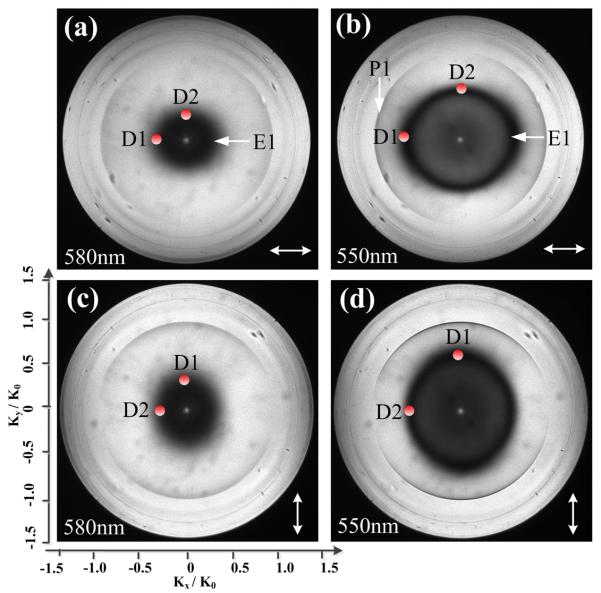
Subsequently, two other band-pass filters (with center wavelength at 550 nm and 580 nm) were used to select wavelengths from the white light source, the corresponding BFP images are shown in Figure 5. Compared with Figure 4 (a), we found that there is a very distinct and thick dark ring (E1 or E2) appearing on the center area of the Figure 5 (a) or (b). The dark rings are of elliptical shapes and rotate with the polarization direction of the incident light as illustrated in Figure 5 (c) and (d). In this experiment, the expanded incident light is linearly polarized and then focused by the axial symmetrical objective. As a result some of the spots on the expanded beam will be P-polarized and some S-polarized with respect to the plane of the 1DPC. The dark point D1 on the ring E1 Figure 5 is related with the incident light of P-polarization and the point D2 of the S-polarization with respect to the 1DPC. The elliptical shapes of the dark rings mean that the angle position of the reflectivity minimum are changed as the relative polarization direction of the incident light to the 1DPC. The corresponding angles of D1 and D2 points on Figure 5 (a) can be derived as 12.36° and 10.16° and those on Figure 5 (b) as 25.13° and 21.94°. These values are consistent with those of D1 and D2 on Figure 3 (c) and (d) and their respective polarizations are also consistent. It is worth noting that there is a distinct and narrow dark arc (P1) appearing on the Figure 5 (d), which is also consistent on the polarization and angle with bright arc (P1) on Figure 3 (b). Based on the consistency on the angle and polarization between the bright rings on Figure 3 and the dark rings on Figure 5, we can assume that the center fluorescence on Figure 3 and center dark rings on Figure 5 are related with the same optical modes of the 1DPC.
Figure 5.
BFP images of the reflected 580 nm (a, c) or 550nm (b, d) light from 1DPC. The incident light is linearly polarized. The white arrow lines represent the direction of the polarization.
4.Numerical simulations and discussion
We performed numerical simulations to reveal the optical modes of the 1DPC. It is now known that depending on geometry some 1DPCs have localized electromagnetic modes at its surface. In this case light is bound to the surface if its frequency or wavevector is below the light line and also overlaps with the photonic band gap (PBG) structure. These surface states are called Bloch surface waves (BSW), which have evanescent fields in both the air region and the layered material [12,13]. The BSWs are analogous to surface plasmons (SPs) that are also surface-trapped states. Based on the commonly investigated surface plasmon-coupled emission (SPCE), we can deduce that the 1DPC enabled directional emission is due to the BSWs. The Finite element method (FEM) is used to calculate the angle dependent reflectivity curves as presented in Figures 6(a) and (b). In the calculation, the wavelength of the incident light is 600 nm, which is the same as the wavelength of fluorescence in Figure 2. In these calculations we could not use the exact loss-free optical constants because the BSWs are extremely narrow if there are no optical losses. It is very likely that our 1DPC displays some optical losses due to imperfections in the multiple layers [26]. These losses would not be seen in our measurements of the optical constants using single layer dielectric films. We assumed small imaginary components that added finite widths to the BSWs. The refractive indexes of the air, PMMA, SiO2, Si3N4, and glass substrate are assumed to be 1.0, 1.49+10−5i, 1.46+10−5i, 2.14+3×10⁻⁴i and 1.52 respectively. The thickness of each layer is the same as presented in Figure 1.
Figure 6.
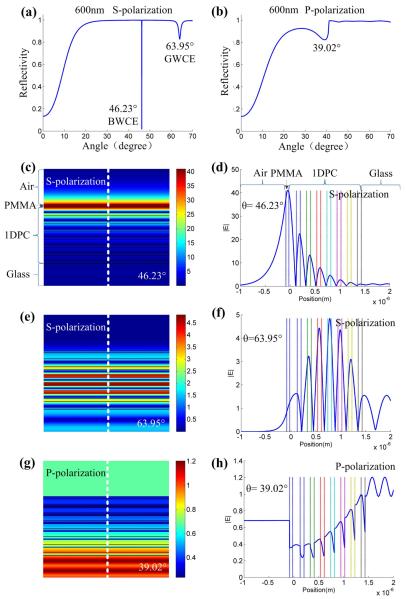
Calculated angle dependent reflectivity curves from the 1DPC structure shown in Figure 1. The incident light is S-polarized (a) or P-polarized (b) at 600nm wavelength. The electric field intensity distributions in the 1DPC structure with the incident angles fixed at 46.23° (c), 63.95° (d) and 39.02° (e). Panels (d) (f) and (h) show the corresponding intensity profiles along the white dash lines in (c), (e) and (g).
For the P-polarized incident light, there is a broad dip on the curve [Figure 6 (b)]. The angle of this dip is about 39.02°. While in the case of S-polarized, two dips are noticed [Figure 6 (a)]. The resonant angles are 46.23°, and 63.95°. The first dip is much more narrow. To clearly reveal the nature of these dips, we set the incident angles and polarization at these resonant positions, and plot the corresponding electric-field distribution (|E|) around the 1DPC as presented in Figure 6 (c), (e) and (g). The electric-field profiles across the 1DPC (along the white dash lines) are also plotted in Figure 6 (d), (f) and (h). From the field distribution, we can determine that the sharp dip at 46.23° is related to the BSWs, which are evanescent at the interface of the air and the 1DPC structure with the strong field in dye-doped PMMA film as shown in Figure 6 (c) and (d). The other dip (63.95°) corresponds to an oscillating mode or internal mode where the optical energy is oscillating within the 1PDC structure as shown in Figure 6 (e) and (f) [27]. This electric field distribution on Figure 6 (f) is the same as that of the guided modes in the planar waveguide, such as the TM1,2,3… or TE1,2,3,… modes [28–30]. This mode can also be classified as the guided modes. At these two incident angles, there is no light transmission directly through the 1DPC into the far-field of the upper space. On the other hand, Figure 6 (g) and (h) shows the electric field intensity above the 1DPC is uniform and non-zero, which means that the light transmits directly through the 1DPC and forms the homogeneous electric field on the upper space of the 1DPC. The optical field distribution inside the 1DPC here is different from that of guided modes or surface modes. The field intensity inside the 1DPC on Figure 6 (h) is also much smaller than that of BSWs or guided mode on Figure 6 (d) and (f).
The BFP images of the reflected light from the 1DPC, such as those shown in Figure 4 and Figure 5, experimentally represent the angle dependent reflectivity of the incident light. The dark arcs on these BFP images are the equivalent to the dips on the angle dependent reflectivity curves. Due to the axial symmetry of the objective, the angle dependent reflectivity at different polarizations (S-polarization or P-polarization) can be simultaneously displayed on the BFP images. The numerical results on Figure 6 can be compared with the experimental results on Figure 4. We found that the angles of the dark arcs on BFP images (Figure 4) are consistent with those dips on the calculated reflectivity curves (Figure 6). Their polarizations are consistent. So the dark arcs (S1, S2) on Figure 4 are related with the BSWs and guided modes of the 1DPC respectively. As discussed above, the bright rings on Figure 2 and dark arcs on Figure 4 are related with the same modes. Accordingly, the directional emission of the fluorescence can be attributed to the coupling with these optical modes of the 1DPC. The bright ring S1 is due to BSWs and can be named as Bloch surface wave coupled emission (BWCE) and the S2 is because of guided modes coupling and hence can be named as guided modes-coupled emission (GMCE) or internal mode-coupled emission (IMCE).
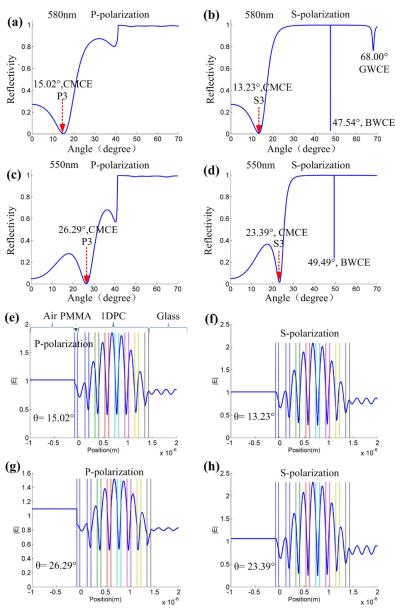
Similarly, the angle dependent curves of the 1DPC at 550 nm and 580 nm are also calculated and shown in Figure 7. These are different from the curves at 600 nm by the appearance of a new dip at smaller incident angle appeared on each curve. The width of these dips is very broad. The resonant angles of these dips are 15.02°, 13.23° for 580 nm incident light and 26.29° and 23.39° with 550nm incident light, respectively. To reveal the properties of these dips, electric field distribution along a line across the 1DPC are plotted as shown in Figure 7 (e), (f), (g) and (h). At these incident angles, the optical field is oscillating inside the 1DPC which is the similar as that of the guided modes. The difference is that the optical field above the 1DPC (in the air) is constant and homogenous, which means that some of the light has penetrated through the 1DPC. The light oscillating inside the 1DPC and transmitting through the 1DPC is the origin of the dips on the reflectivity curves. The field distribution of these optical modes inside the 1DPC is similar to that of cavity modes inside a Fabry-Pero (F-P) cavity. When the reflectivity of the two mirrors of a F-P cavity is smaller than 1, light will penetrate through the cavity and some of the light will oscillate inside the cavity. So these modes (P3, S3 on Figure 7) at small incident angles can be classified as the cavity modes of the 1DPC.
Figure 7.
Calculated angle dependent reflectivity curves from the 1DPC structure shown in Figure 1. The incident light is P-polarized (a, c) or S-polarized (b, d) at 580nm (a, b) and 550nm (c, d) wavelengths. The electric field intensity profiles along the lines vertically across the 1DPC are plotted in (e), (f), (g) and (h). The incident angles are fixed at 15.02° (e), 13.23° (f), 26.29° (g), and 23.39° (e).
When comparing Figure 5 and Figure 7, we find that the angles and polarizations of these dips on Figure 7 are consistent with the dark rings (E1) on Figure 5. For examples, at 550nm wavelength, the thick and dark rings on Figure 5 (b) are elliptical which means that the angles of the resonant dips are different for different polarizations of the incident light. The numerical results on Figure 7 (c) and (d) also display the angle position of the dips (P3, S3) which are different for different polarizations. The dark point D1 on Figure 5 is related with the incident light of P-polarization, corresponding to the dip (P3) on Figure 7 (c), and the D2 on Figure 5 is corresponding to the dip (S3) on Figure 7 (d). The angle values of these points and dips are also consistent. Based on the above comparison, we assume that the dark ring E1 on Figure 5 is caused by the cavity modes inside the 1DPC. The fluorescence on the center of the BFP image in Figure 3 is due to the coupling between the dye molecules and cavity modes of the 1DPC. This can be named as cavity mode coupled emission (CMCE). The angular divergence of the CMCE is large which is consistent with the broad dips (P3, S3) on Figure 7 and the elliptical rings (E1) on Figure 5. The broad dip of the reflectivity curves represents the high loss of this mode. The above experimental and numerical results reveal that the higher angular divergence of the 1DPC at 550 nm and 580 nm is due to the existence of the high loss cavity modes in the 1DPC. From the resonant angle of these modes (cavity modes), we can find that they are below the critical angle of glass/air, so these modes are leaky both in the air space and glass substrate. As a result, the loss is larger than that of the modes only leaky in the glass substrate. The higher loss of these kind leaky modes induces the larger divergence of the fluorescence emission and also broad resonant dips, which are consistent with the experimental results in Figure 3, 5 and numerical simulation in Figure 7. The appearance of the guided modes and cavity modes results in the fluorescence emitting into different directions. This is an unfavorable result if the goal is to obtain the maximum intensity at a single observation angle. This is a favorable result if the application requires a reference signal from a region that does not include the part of the sample exposed to the BSW field[31].
5.Comparision with SPCE
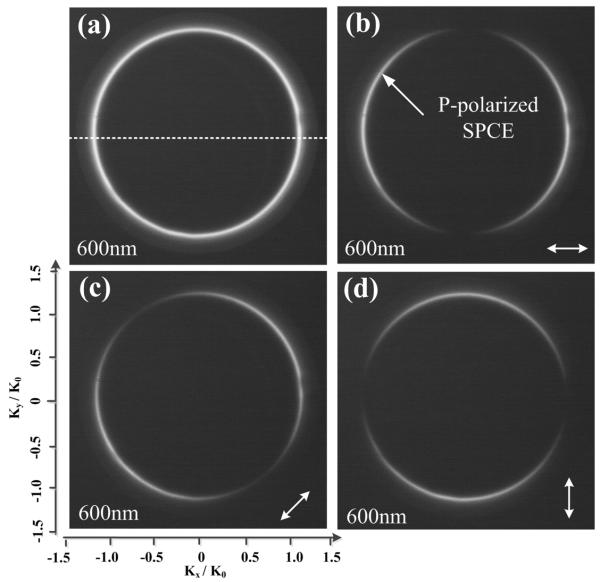
It is informative to compare photonic crystal-coupled emission (PCCE) with SPCE. A RhB doped PMMA film is spin-coated onto a silver film. The thickness of both the PMMA and Ag film is 45nm. The corresponding BFP images are shown in Figure 8. A band-pass filter with center wavelength of 600nm is used to filter the fluorescence. In contrast to the images shown in Figure 2, only one bright ring is observed. The emitting angle can be derived as 51.33° which is larger than that of the BWCE. A linear polarizer is placed before the CCD detector and rotated, which changes the intensity distribution of the bright ring as shown in Figure 5 (b), (c) and (d). It is easy to consider that the bright ring has radial polarization, which mean that the polarization direction of the light spots on the ring is along the diameter [32]. This is different from the 1DPC enabled directional emission which is found to be S-polarized.
Figure 8.
BFP images of the 600 nm fluorescence from the RhB doped PMMA film on the Ag film. The PMMA film (45 nm thickness) is spin-coated on an Ag film (45 nm thickness). The white arrows on (b) (c) and (d) demonstrate the direction of the polarizer before the CCD.
To have an understanding of the qualitative differences between BWCE and SPCE, we plotted the intensity distribution along the dash lines on Figure 2 (a) and Figure 8 (a) and shown in Figure 9. The FWHM of the 1DPC (BWCE) peak is about 15 pixels, and that of Ag (SPCE) peak is about 37 pixels. The corresponding angular divergence of the directed fluorescence beams can be derived as 1.99° and 5.73°. When the thickness of the PMMA film on the silver film is increased, such as to the 60 nm as that coated on the 1DPC, the angular divergence of the SPCE ring will be increased further [33]. The beaming effect on the fluorescence emission due to the BSW is better than that of the SPs in angular divergence.
Figure 9.
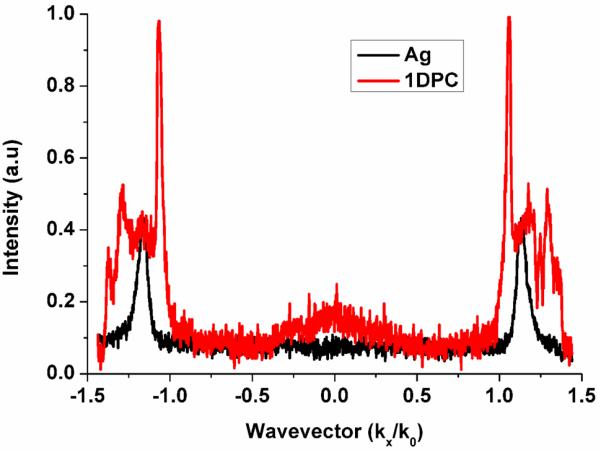
The Fluorescence intensity profiles along the dash lines on Figure 2 (a) and Figure 8 (a)
If other band-pass filters (with center wavelength at 550nm and 580nm) are used, the beaming effect by the Ag film appears to be better than that by the 1DPC (Figure 10). On Figure 10, the bright rings are still very distinct and there is no fluorescence on other parts of the BFP images, which means that the fluorescence has been fully beamed. The emitting angles can be derived as 56.64° and 53.49° at 550 nm and 580 nm, respectively. The comparisons reveal that although the 1DPC enabled directional emission has the advantages of smaller emitting angle and angular divergence, and it is sensitive to the fluorescence emission wavelength. On the contrary, the SPCE works well in broad wavelengths without additional bonds at other angles.
Figure 10.
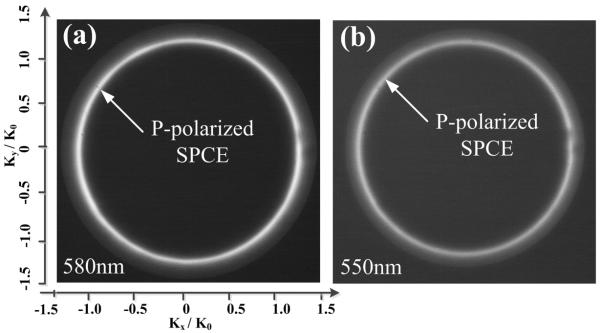
BFP images of the fluorescence from the RhB molecules doped in the PMMA film. The PMMA film (45nm thickness) is spin-coated on an Ag film (45 nm thickness). The center wavelength of the band-pass filters are 580 nm (a) and 550 nm (b).
The BFP images of the reflected light from the PMMA-Ag-glass multilayered film were also measured as shown in Figure 11. The incident light is of linear polarization. Three band-pass filters are used to select the wavelengths. Only one pair of dark arcs (surface plasmon resonance dips, SPR dips) appears on each BFP image at each wavelength, which is due to the excitation of the SPs on the Air-PMMA-Ag interface at the SPR angle. These dark arcs rotate with the direction of the polarization(not shown) because the SPs can only be excited with P-polarized light[7,34,35]. The radial angle of these dark arcs can be derived as 54.35°, 52.89° and 51.44°, which are consistent with the emitting angles of the SPCE shown in Figure 8 and Figure 10. The dark arcs are also thicker and deeper than the arcs on Figure 4 which represents the higher loss of the SPs than that of BSWs. The high loss of the SPs induces the larger angular divergence of the SPCE over that of BWCE as illustrated in Figure 9. For the thin Ag film, there are only the SPs modes so the fluorescence can be beamed into one radial direction as shown in Figure 8 and 10.
Figure 11.
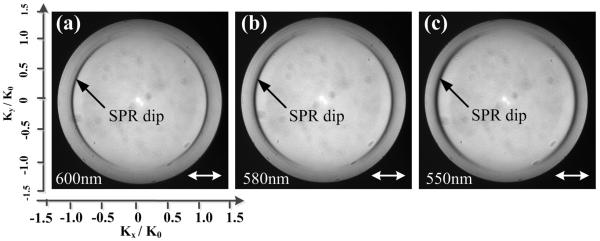
BFP images of the reflected 600 nm (a), or 580 nm (b) and 550 nm (c) light from the PMMA film coated Ag film. The incident light is linearly polarized. The white arrow lines represent the direction of the polarization.
6.Summary
In summary, back focal plane imaging technique is used to thoroughly investigate the optical properties of the 1DPC at different wavelengths inside the fluorescence spectrum of dye molecules. All the optical modes supported by the 1DPC have been clearly and directly revealed from the BFP images, including the BSWs, guided modes and also cavity modes. Due to the near field coupling with the low loss of the BSWs, the fluorescence from the dye molecules on the 1DPC will be beamed with a much narrower angular divergence than that by the silver film (SPCE). The angular composition of the coupled emission is sensitive to the wavelength of the fluorescence emission. At unfavorable wavelengths, the high loss cavity modes appear which result in the diverging emission of the fluorescence. In contrast, silver film (SPCE) can work in broad wavelengths but with a little larger angular divergence. The 1DPC also have the following advantages, for example, a wide variety of dielectrics can be used to fabricate the 1DPC to work at different wavelengths. The dielectric 1DPC are not as fragile as metal surfaces and can be cleaned and used multiple times. The thin Ag film enabled SPCE also has some advantages, such as easy fabrication of the substrate, only one layer of Ag film is sufficient, and the same Ag film can be used to excite SPs at both the excitation wavelength and the emission wavelength of the dye molecules. The directional emission enabled by the multilayer films including the 1DPC and thin Ag films have potential applications in fluorescence related bio-sensing, sequencing and bio-imaging.
Acknowledgements
This work was supported by NIH Grants RO1HG002655, RO1EB006521 and RO1HG005090. We thank UMCP Fab Lab. We also thank Mrs. Mary Rosenfeld for her help in preparation of this manuscript. The authors with USTC acknowledge the financial support by the National Key Basic Research Program of China under grant no. 2012CB922003, 2012CB921900, 2013CBA01703. National Natural Science Foundation of China under grant no. 11374286, 61177053. Douguo Zhang and Badugu Ramachandram contributed equally.
References
- 1.Lakowicz JR. Principles of fluorescence spectroscopy. third edition Springer; 2006. [Google Scholar]
- 2.Rui GH, Abeysinghe DC, Nelson RL, Zhan QW. Demonstration of beam steering via dipole-coupled plasmonic spiral antenna. Scientific Reports. 2013;3:2237. doi: 10.1038/srep02237. [DOI] [PMC free article] [PubMed] [Google Scholar]
- 3.Rui GH, Chen WB, Abeysinghe DC, Nelson RL, Zhan QW. Beaming circularly polarized photons from quantum dots coupled with plasmonic spiral antenna. Opt. Exp. 2012;20:19297. doi: 10.1364/OE.20.019297. [DOI] [PubMed] [Google Scholar]
- 4.Aouani H, Mahboub O, Devaux E, Rigneault H, Ebbesen TW, Wenger J. Plasmonic Antennas for Directional Sorting of Fluorescence Emission. Nano. Lett. 2011;11:2400. doi: 10.1021/nl200772d. [DOI] [PubMed] [Google Scholar]
- 5.Cao SH, Cai WP, Liu Q, Li YQ. Surface plasmon-coupled emission: What can directional fluorescence bring to the analytical sciences. Annu. Rev. Anal. Chem. 2012;5:317–36. doi: 10.1146/annurev-anchem-062011-143208. [DOI] [PubMed] [Google Scholar]
- 6.Lakowicz JR, Malicka J, Gryczynski I, Gryczynski Z. Directional surface plasmon-coupled emission: a new method for high sensitivity detection. Biochemical and Biophysical Research Communications. 2003;307(3):435. doi: 10.1016/S0006-291X(03)01214-2. [DOI] [PMC free article] [PubMed] [Google Scholar]
- 7.Frisbie SP, Chesnutt C, Holtz ME, Krishnan A, Peralta L. Grave de, Bernussi AA. Image formation in wide-field microscopes based on leakage of surface plasmon-coupled fluorescence. IEEE Photonics Journal. 2009;1:153–162. [Google Scholar]
- 8.Zhang DG, Fu Q, Yi MF, Wang XX, Chen YK, Wang P, Lu YH, Yao PJ, Ming H. Excitation of Broadband Surface Plasmons with Dye Molecules. Plasmonics. 2012;7(2):309–312. [Google Scholar]
- 9.Liscidini M, Galli M, Shi M, Dacarro G, Patrini M, Bajoni D, Sipe JE. Strong modification of light emission from a dye monolayer via Bloch surface waves. Opt. Lett. 2009;34:2318–20. doi: 10.1364/ol.34.002318. [DOI] [PubMed] [Google Scholar]
- 10.Ballarini M, Frascella F, Michelotti F, Digregorio G, Rivolo P, Paeder V, Musi V, Giorgis F, Descrovi E. Bloch surface waves-controlled emission of organic dyes grafted on a one-dimensional photonic crystals. Appl. Phys. Lett. 2011;99:043302. [Google Scholar]
- 11.Yeh P, Yariv A, Hong CS. Electromagnetic propagation in periodic stratified media: I. General theory J. Opt. Soc. Am. 1977;67:423–38. [Google Scholar]
- 12.Joannopoulos JD, Johnson SG, Winn JN, Meade RD. Photonic crystals, molding the flow of light. second edition Princeton. University. Press; 2008. [Google Scholar]
- 13.Badugu R, Nowaczyk K, Descrovi E, Lakowicz JR. Radiative decay engineering 6: Fluorescence on one-dimensional photonic crystals. Analytical Biochemistry. 2013;442:83–96. doi: 10.1016/j.ab.2013.07.021. [DOI] [PMC free article] [PubMed] [Google Scholar]
- 14.Anger P, Bharadwaj P, Novotny L. Enhancement and Quenching of Single-Molecule Fluorescence. Phys. Rev. Lett. 2006;96:113002. doi: 10.1103/PhysRevLett.96.113002. [DOI] [PubMed] [Google Scholar]
- 15.Ballarini M, Frascel F, Enrico E, Mandracci P, De Leo N, Michelotti F, Giorgis F, Descrovi E. Bloch surface waves- controlled fluorescence emission: Coupling into nanometer-sized polymeric waveguides. Appl. Phys. Lett. 2012;100:063305. [Google Scholar]
- 16.Liscidini M, Gerace D, Sanvitto D, Bajoni D. Guided Bloch surface wave polaritons. Appl. Phys. Lett. 2011;98:121118. [Google Scholar]
- 17.Descrovi E, Sfez T, Quaglio M, Brunazzo D, Dominici L, Michelotti F, Herzig HP, Martin OJF, Giorgis F. Guided Bloch Surface Waves on Ultrathin Polymeric Ridges. Nano. Lett. 2010;10:2087. doi: 10.1021/nl100481q. [DOI] [PubMed] [Google Scholar]
- 18.Enrico AE, Leo N De, Munzert P, Boarino L, Michelotti F, Giorgis F, Descrovi E. Fluorescence diffraction assisted by Bloch surface waves on a one-dimensional photonic crystal. New Journal of Physics. 2013;15:073002. [Google Scholar]
- 19.Hohenau A, Krenn JR, Drezet A, Mollet O, Huant S, Genet C, Stein B, Ebbesen TW. Surface plasmon leakage radiation microscopy at the diffraction limit. Opt. Exp. 2011;19:25749. doi: 10.1364/OE.19.025749. [DOI] [PubMed] [Google Scholar]
- 20.Zhang DG, Yuan XC, Bouhelier A. Direct image of surface-plasmon-coupled emission by leakage radiation microscopy. Appl. Opt. 2010;49(5):875–879. doi: 10.1364/AO.49.000875. [DOI] [PubMed] [Google Scholar]
- 21.Frisbie SP, Chesnutt C, Ajimo J, Bernussi AA, Peralta L. Grave de. Characterization of polarization states of surface plasmon polaritons modes by Fourier-plane leakage microscopy. Opt. Comm. 2010;283:5255. [Google Scholar]
- 22.Zhan QW. Cylindrical vector beams: from mathematical concepts to applications. Advances in Optics and Photonics. 2009;1:1–57. [Google Scholar]
- 23.Chen YK, Zhang DG, Han L, Rui GH, Wang XX, Wang P, Ming H. Surface-plasmon-coupled emission microscopy with a polarization converter. Opt. Lett. 2013;38:736. doi: 10.1364/OL.38.000736. [DOI] [PubMed] [Google Scholar]
- 24.Zhan QW. Evanescent Bessel beam generation via surface plasmon resonance excitation by a radially polarized beam. Opt. Lett. 2006;31:1726. doi: 10.1364/ol.31.001726. [DOI] [PubMed] [Google Scholar]
- 25.Zhang DG, Yuan XC, Bouhelier A, Yuan GH, Wang P, Ming H. Active control of surface plasmon polaritons by optical isomerization of an azobenzene polymer film. Appl. Phys. Lett. 2009;95:101102. [Google Scholar]
- 26.Michelotti F, Sinibaldi A, Munzert P, Danz N, Descrovi E. Probing losses of dielectric multilayers by means of Bloch surface waves. Opt. Letts. 2013;38:616–618. doi: 10.1364/OL.38.000616. [DOI] [PubMed] [Google Scholar]
- 27.Chen G, Cao ZQ, Gu JH, Shen QS. Oscillating wave sensors based on ultrahigh-order modes in symmetric metal-clad optical waveguides. Appl. Phys. Lett. 2006;89:081120. [Google Scholar]
- 28.Cheng QQ, Li T, Guo RY, Li L, Wang SM, Zhu SN. Direct observation of guided-mode interference in polymer-loaded plasmonic waveguide. Appl. Phy. Lett. 2012;101:171116. [Google Scholar]
- 29.Lifante G. Integrated Photonics: Fundamentals. Wiley; England: 2003. [Google Scholar]
- 30.Zhang DG, Yuan X-C, Yuan GH, Wang P, Ming H. Directional fluorescence emission characterized with leakage radiation microscopy. J. Opt. 2010;12:035002. [Google Scholar]
- 31.Ballarini M, Frascella F, De Leo N, Ricciardi S, Rivolo P, Mandracci P, Enrico E, Giorgis F, Michelotti F, Descrovi E. A polymer-based functional pattern on one-dimensional photonic crystals for photon sorting of fluorescence radiation. Opt. Exp. 2012;20:6703–6711. doi: 10.1364/OE.20.006703. [DOI] [PubMed] [Google Scholar]
- 32.Lakowicz JR. Radiative decay engineering 3. Surface plasmon-coupled directional emission. Analytical Biochemistry. 2004;324:153–169. doi: 10.1016/j.ab.2003.09.039. [DOI] [PMC free article] [PubMed] [Google Scholar]
- 33.Holmgaard T, Bozhevolnyi SI. Theoretical analysis of dielectric-loaded surface plasmon-polariton waveguides. Phys. Rev. B. 2007;75:245405. [Google Scholar]
- 34.Raether H. Surface Plasmons on Smooth and Rough Surfaces and Gratings. Springer; Berlin: 1988. [Google Scholar]
- 35.Dominguez D, Regan CJ, Boada RL, Bernussi AA, Peralta L. Grave de. Observation of coherence-related phenomena in experiments with surface plasmon polaritons excited by fluorescence. Opt. Comm. 2013;315:270–274. [Google Scholar]


