Abstract
Aims/Introduction
Incretins might play some pathophysiological role in glucose metabolism in diabetes and obesity; it is not clear whether or not the amount and the pattern of incretin secretion vary with different types of sugars. To evaluate the effect of two types of disaccharides on glucose metabolism and the kinetics of incretin secretion, plasma levels were measured after palatinose or sucrose ingestion in non‐obese healthy participants.
Materials and Methods
The study was carried out on healthy participants who were given a solution containing 50 g of palatinose or sucrose for ingestion. Blood samples were obtained before loading and after ingestion. Insulin, glucagon and incretins hormones were measured by the enzyme‐linked immunosorbent assay method.
Results
When the data were compared between palatinose and sucrose ingestion, both plasma glucose values at 15, 30 and 60 min, and plasma insulin values at 15 and 30 min after palatinose loading were significantly lower than those after sucrose loading. Plasma levels of total glucose‐dependent insulinotropic polypeptide at 15–90 min after palatinose loading were significantly lower than those after sucrose loading. Plasma levels of total and active glucagon‐like peptide‐1 at 90 min and the area under the curve (60–120 min) of the total glucagon‐like peptide‐1 were significantly higher with palatinose‐loading than with sucrose loading.
Conclusion
Compared with sucrose, palatinose appears to have a more favorable effect on glucose metabolism and protection of pancreatic islets as a result of less hyperglycemic and hyperinsulinemic potency.
Keywords: Incretin, Palatinose, Type 2 diabetes mellitus
Introduction
In recent years, the number of patients with diabetes has been increasing worldwide. It has been known that diabetic patients with prominent postprandial hyperglycemia have the risk of further progression of diabetic vascular diseases. Therefore, strict control of blood glucose levels and blood pressure through appropriate diet therapy could be the key to preventing the progression of various/diabetic vascular diseases, such as obesity, hyperglycemia, hyperinsulinemia and atherosclerosis. Thus, it is beneficial that the rate of increase in blood glucose levels at the time of ingestion is as slow and low as possible.
Gastrointestinal (GI) hormones have been attracting considerable attention as a new therapy for diabetes. Glucagon‐like peptide‐1 (GLP‐1) and glucose‐dependent insulinotropic polypeptide (GIP) are incretin hormones that are rapidly released from the GI tract in response to stimuli caused by ingestion of sugars and fats into the GI tract1. As the blood glucose level rises, GLP‐1 and GIP cause an increase in insulin secretion from pancreatic β‐cells2, and GLP‐1 inhibits glucagon secretion from pancreatic α‐cells, together suppressing the blood glucose level. It is desirable to take the appropriate incretin hormone secretion pattern to correct abnormal glucose metabolism in such a case as postprandial hyperglycemia.
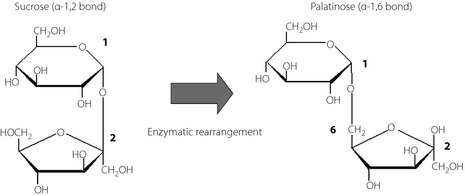
Palatinose (6‐O‐D‐glucopyranosyl‐D‐fructose, isomaltulose) is a naturally‐occurring disaccharide that gives honey sweetness. Its caloric value is 4 kcal/g, the same as that of sucrose3. In industry, palatinose is manufactured using glycosyltransferase, which converts the α‐1,2 bond of sucrose into a α‐1,6 bond of palatinose5 (Figure 1). Palatinose is completely hydrolyzed, although much more slowly than sucrose, and absorbed by the small intestine4. Oral administration of palatinose only causes mild increases in plasma glucose and insulin levels in both healthy subjects and type 2 diabetes mellitus patients without any adverse effects8. In addition, it has been suggested that palatinose might also suppress blood glucose elevation caused by other carbohydrates, such as glucose, sucrose and dextrin11. Past studies have shown that such actions are attributed to the inhibition of glucose absorption in the small intestine15, and competitive inhibition of α‐glucosidase13. However, these inhibitory effects of palatinose are not as potent as those of other α‐glucosidase inhibitors. The effect of palatinose is to slightly slow down digestion and absorption, and this is a rather mild effect that does not cause gastrointestinal symptoms.
Figure 1.

Constructions of sucrose and palatinose. Palatinose is formed by the binding of position‐1 carbon of glucose to the position‐6 carbon of fructose.
As aforementioned, the rates of elevation of blood glucose and insulin levels are slower after palatinose intake as compared with sucrose intake. Thus, palatinose might have an advantage over sucrose in terms of suppressing the postprandial hyperglycemia.
Incretins have attracted considerable attention in recent years. However, the effect of palatinose on the kinetics of incretin secretion has not been analyzed in humans. In the current double‐blind, placebo‐controlled study, healthy male subjects with a body mass index (BMI) of ≤23 were given a solution containing 50 g of palatinose or sucrose, and kinetics of incretin secretion were analyzed and compared between palatinose and sucrose loading.
Materials and Methods
Experimental Design
The present study was designed as a double‐blind, placebo‐controlled study. The sugar samples used were palatinose and sucrose. The respective sample was dissolved in 300 mL of distilled water and ingested in a few minutes. The palatinose loading (P‐loading) test was carried out within 2 weeks after sucrose loading (S‐loading) test, and vice versa. Blood samples were obtained before ingestion time 0, and 15, 30, 60, 90, 120, 150 and 180 min after ingestion; and plasma levels of glucose, insulin and incretins (total GLP‐1, active GLP‐1 and total GIP) were measured.
Participants
The present study was carried out with 10 healthy male participants (46.4 ± 7.7 years‐of‐age) with BMI of ≤23, normal blood pressure, no underlying disease and no medication (Table 1). All participants submitted their written informed consent for participation in the present study. The study was carried out in compliance with the Declaration of Helsinki.
Table 1. Characteristics of study participants.
| Characteristics | |
|---|---|
| Age (years) | 46.4 ± 7.7 |
| Sex, male (n) | 10 |
| Weight (kg) | 62.5 ± 5.2 |
| Body mass index (kg/m2) | 21.1 ± 1.6 |
| HbA1c (%) | 5.3 ± 0.6 |
Values are mean ± standard deviation. Glycated hemoglobin (HbA1c) values are shown as National Glycohemoglobin Standardization Program values as recommended by the Japan Diabetes Society.
Analyses of Blood Samples
Blood samples were taken for measurement of plasma glucose, insulin, glycated hemoglobin (HbA1c), GLP‐1, GIP and glucagon. Blood samples were withdrawn from the stopcock directly into evacuated sample tubes containing relevant preservatives using ethylenediaminetetraacetic acid (EDTA)‐plasma tubes. To prevent deterioration of GLP‐1 by dipeptide peptidase‐4 (DPP‐4), blood samples were withdrawn directly into EDTA‐plasma tubes containing a DPP‐4 inhibitor, kept in ice and centrifuged in a refrigerated centrifuge within 10 min, and the aliquots are used for the determination of plasma concentrations of GLP‐1, GIP and glucagon. Extraction was carried out as follows: OASIS HLB 1 cc (30 mg) extraction cartridges (pat no. WAT094225; Waters Corporation, Milford, MA, USA) were equilibrated with alcohol and, subsequently, distilled water. The diluted plasma samples were then washed twice with alcohol. Samples were then eluted twice with alcohol. Eluted samples were then dried under helium gas.
Laboratory Determinations
Total GLP‐1 was measured after the solid‐phase preparation of the specimens using a total GLP‐1 RIA Kit (Rabbit anti‐GLP‐1 Antibody; Millipore, Bellerica, MA, USA). Active GLP‐1 was measured using a GLP‐1 (active) enzyme‐linked immunosorbent assay (ELISA Kit; catalog no. EGLP – 35K; Millipore, Bellerica, MA, USA). Total GIP was measured using a human GIP (total) ELISA Kit (catalog no. EZHGIP – 54K, Millipore, Bellerica, MA, USA). Glucagon was measured using a Glucagon RIA Kit (Glucagon Antibody [Guinea Pig anti‐Glucagon Serum in Assay Buffer]; Millipore, Bellerica, MA, USA). HbA1c values are shown as National Glycohemoglobin Standardization Program values as recommended by the Japan Diabetes Society16.
Statistical Analyses
The data were expressed as means ± standard deviation. The statistical analyses were carried out using ssri for Windows version 7.0 (Social Survey Research Information Co. Ltd., Tokyo, Japan) including Pearson's product‐moment correlation coefficient to determine the relationship between incretin secretion (total GIP, active GLP‐1 and intact GLP‐1). Two‐sided paired t‐test was used to evaluate the statistical difference in each parameter between the values obtained after sucrose and palatinose intake, and between the baseline value (time 0) and the value obtained at each time‐point. The level of significance was set at P < 0.05.
Results
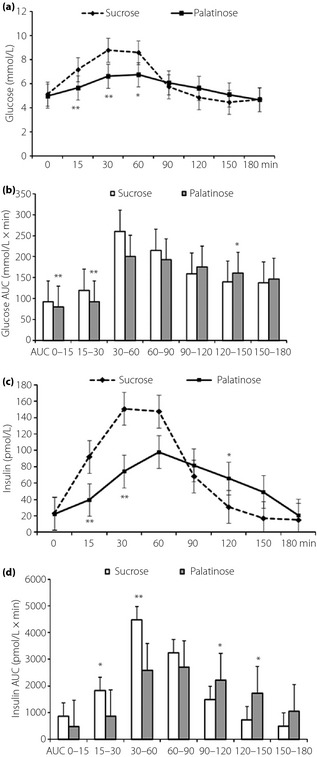
When the data were compared between sucrose and palatinose ingestion, the plasma glucose values observed at 15, 30, and 60 min were lower with P‐loading than with S‐loading (Figure 2a). The area under the curve (0–60 min; AUC0–60) of plasma glucose was significantly lower (P < 0.01) with P‐loading (372.3 ± 36.1 mmol/L × min) than with S‐loading (472.8 ± 93.3 mmol/L × min; Figure 2b). The peak concentrations of plasma glucose were observed at 60 min after P‐loading (P < 0.05), and at 30 min after S‐loading (P < 0.01; Figure 2a). The peak concentration was (significantly) lower with P‐loading than that with S‐loading (Figure 2a).
Figure 2.

(a) Changes of plasma glucose, (b) area under the curve (AUC) of plasma glucose, (c) plasma insulin and (d) AUC of plasma insulin after oral administration of 50 g palatinose or sucrose in 10 healthy participants. Mean ± standard deviation. *P < 0.05, **P < 0.01.
The plasma insulin values observed at 15 and 30 min were lower with P‐loading than with S‐loading (Figure 2c). The AUC15–60 of plasma insulin was also lower (P < 0.05) with P‐loading (3,443.3 ± 1,991.5 pmol/L × min) than with S‐loading (6,298.5 ± 3,518.6 pmol/L × min; Figure 2d).
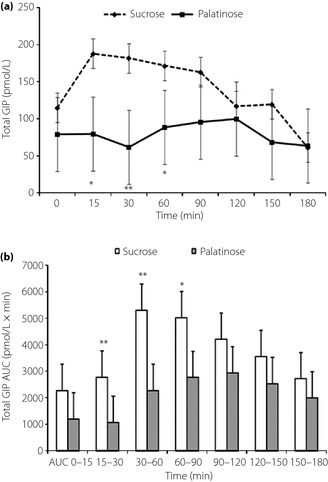
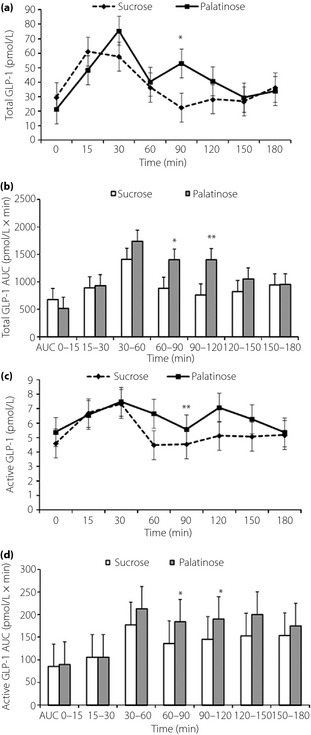
Plasma total GIP values at 15, 30 and 60 min were significantly lower with P‐loading than with S‐loading (Figure 3a). The AUC15–90 of plasma total GIP was significantly lower (P < 0.01) with P‐loading (6,086.0 ± 3,431.9 pmol/L × min) than with S‐loading (13,096.3 ± 6,006.7 pmol/L × min; Figure 3b). The plasma total GLP‐1 value at 90 min was significantly higher than that with P‐loading than S‐loading (Figure 4a). The AUC60–120 of plasma total GLP‐1 was significantly higher (P < 0.01) with P‐loading (2,805.9 ± 907.9 pmol/L × min) than with the S‐loading (1,645.4 ± 998.6 pmol/L × min; Figure 4b). Plasma active GLP‐1 values at 90 min were significantly higher with P‐loading than with S‐loading (Figure 4c). The AUC60–120 of plasma active GLP‐1 was significantly higher (P < 0.05) with P‐loading (378.8 ± 352.9 pmol/L × min) than with S‐loading (281.5 ± 241.2 pmol/L × min; Figure 4d). No significant difference in changes of plasma glucagon levels was observed between P‐ and S‐loading tests.
Figure 3.

(a) Change of plasma total GIP and (b) area under the curve (AUC) of plasma total glucose‐dependent insulinotropic polypeptide (GIP) after oral administration of 50 g palatinose or sucrose in 10 healthy participants. Mean ± standard deviation. *P < 0.05, **P < 0.01.
Figure 4.

(a) Change of plasma total glucagon‐like peptide‐1 (GLP‐1), (b) area under the curve (AUC) of plasma total GLP‐1, (c) plasma active GLP‐1 and (d) AUC of plasma active GLP‐1 after oral administration of 50 g palatinose or sucrose in 10 healthy participants. Mean ± standard deviation. *P < 0.05, **P < 0.01.
Discussion
Both palatinose and sucrose are disaccharides composed of one glucose molecule and one fructose molecule. Palatinose and sucrose are degraded respectively by isomaltase and sucrase, disaccharide‐degrading enzymes found in small intestinal villi. Degraded palatinose and sucrose are absorbed as glucose and fructose through the small intestine, respectively. Thus, palatinose and sucrose release the same amount of energy, which has been confirmed in an animal study18.
In the current study, both plasma glucose and insulin levels were found to be significantly lower with P‐loading than with S‐loading, consistent with previous reports8. Nevertheless, previous reports do not contain the data on the time of return to the baseline plasma glucose level after an increase in the plasma glucose concentration as a result of palatinose intake. In the current study, the plasma glucose and insulin levels were found to return to the baseline levels within 180 min after P‐loading. The difference in the changes in plasma glucose and insulin levels between P‐ and S‐loading might be a result of the difference in the rate of degradation of these disaccharides in the small intestine.
As shown in Figure 3a, the response of total GIP secretion was markedly significantly and dramatically smaller with P‐loading than with S‐loading. This is probably as a result of the slow rate of degradation of palatinose in the small intestine, resulting in the release of a small amount of glucose and fructose in the upper part of the small intestine where GIP‐releasing K cells are present. Because of the slow degradation of palatinose, the amount of free glucose/fructose was much less in the upper part of the small intestine, where GIP‐secreting K cells are mainly localized and stimulated by monosaccharide.
In contrast, as shown in Figure 4, the total and active GLP‐1 levels observed at later time‐points were significantly higher with P‐loading than with S‐loading. Degradation of palatinose in the small intestine is a slow process and considered to occur mainly in the lower part of the small intestine, where L cells that secrete GLP‐1 in response to stimulation by monosaccharides are abundantly present. At 120 min, plasma glucose and insulin levels were higher after P‐loading compared with S‐loading. These findings might further support the hypothesis of delayed digestion of palatinose into monosaccharides, resulting in increased plasma GLP‐1 level. Vozzo et al.19 also reported the effect of fructose on GIP and GLP‐1 secretion in normal glucose tolerance and type 2 diabetes. Thus, not only glucose, but also fructose, could directly stimulate GLP‐1 secretion. However, the possibility that undigested palatinose might stimulate GLP‐1 secretion directly cannot be excluded entirely20. Both the difference in the patterns of incretin secretion and the digestion and/or absorption of sucrose or palatinose might contribute to the difference of insulin responses.
Among incretin hormones, GIP has also been reported to facilitate insulin secretion in a glucose‐dependent manner and protect pancreatic β‐cells. Furthermore, beyond the effect on β‐cells, GIP has been reported to promote other functions. Outside these benefits, GIP was also reported to have unfavorable effects for patients with diabetes and/or obesity, such as facilitation of bodyweight gain as a result of fat accumulation. The palatinose that has a less stimulatory potency of total GIP secretin seems to be more beneficial suitable in diet therapy for such patients.
In contrast, GLP‐1 has been reported to potentiate insulin secretion glucose‐dependently, protect and promote pancreatic β‐cell growth, and inhibit glucagon secretion. In addition, GLP‐1 has been reported to have many beneficial effects, such as central nervous system‐mediated appetite suppression, slow gastric emptying and stimulation of glycogen syntheses in the liver. All these effects of GLP‐1 might be more advantageous for diet therapy of type 2 diabetes mellitus and/or obesity. In view of treatment and prevention of diabetes, it is noteworthy that GLP‐1 secretion is significantly stimulated by palatinose intake20.
In conclusion, the present study suggests that palatinose is a disaccharide with a more favorable effect than sucrose on glucose metabolism and pancreatic function, as it is less hyperglycemic and hyperinsulinemic. In addition, palatinose appears to show more advantageous effects on incretin responses after ingestion as compared with sucrose. Thus, the risk of atherosclerosis and the burden on pancreatic β‐cells could be reduced by using palatinose as a flavoring agent or a substitute for sugar. Although the current study was carried out in non‐obese healthy participants, further studies are desired to confirm the effect of palatinose on the changes of plasma glucose, insulin and incretin secretion in patients with diabetes and/or obesity.
Acknowledgements
This work was supported in part by a grant‐in‐aid (Grant no. 20591075) to JM from the Ministry of Education, Culture, Sports, Science and Technology of Japan. None of the authors of this manuscript had any conflicts of interest.
(J Diabetes Invest, doi: 10.1111/jdi.12045, 2013)
References
- 1.Nauck MA, Bartels E, Orskov C, et al Additive insulinotropic effects of exogenous synthetic human gastric inhibitory polypeptide and glucagon‐like peptide‐1‐(7‐36) amide infused at near‐physiological insulinotropic hormone and glucose concentrations. J Clin Endocrinol Metab 1993; 76: 912–917 [DOI] [PubMed] [Google Scholar]
- 2.Nauck MA, Heimesaat MM, Orskov C, et al Preserved incretin activity of glucagon‐like peptide 1 [7‐36 amide] but not of synthetic human gastric inhibitory polypeptide in patients with type‐2 diabetes mellitus. J Clin Invest 1993; 91: 301–307 [DOI] [PMC free article] [PubMed] [Google Scholar]
- 3.Siddiqui IR, Furgala B. Isolation and characterization of oligosaccharides from honey. Part 1. J Apic Res 1967; 6: 139–145 [Google Scholar]
- 4.Lina BAR, Jonker D, Kozianowski G. Isomaltulose (Palatinose): a review of biological and toxicological studies. Food Chem Toxicol 2002; 40: 1375–1381 [DOI] [PubMed] [Google Scholar]
- 5.Nakajima Y. Manufacture and utilization of palatinose. Jpn Soc Starch Sci 1988; 35: 131–139 (Japanese). [Google Scholar]
- 6.Tsuji Y, Yamada K, Hosoya N, et al Digestion and absorption of sugar substitutes in rat small intestine. J Nutr Sci Vitaminol 1986; 32: 93–100 [DOI] [PubMed] [Google Scholar]
- 7.Dahlquist A, Asuricchio S, Semenza G, et al Human intestinal disaccharides and hereditary disaccharide intolerance. The hydrolysis of sucrose, isomaltose, palatinose (isomaltulose), and α 1, 6‐a‐oligosaccharide (isomaltooligosaccharide) preparation. J Clin Invest 1963; 42: 556–563 [DOI] [PMC free article] [PubMed] [Google Scholar]
- 8.Kawai K, Okuda Y, Yamashita K. Changes in blood glucose and insulin after an oral palatinose administration in normal subject. Endocrinol Jpn 1985; 32: 933–936 (Japanese). [DOI] [PubMed] [Google Scholar]
- 9.Kawai K, Yoshikawa H, Murayama Y, et al Usefulness of palatinose as a caloric sweetener for diabetic patients. Horm Metab Res 1989; 21: 338–340 [DOI] [PubMed] [Google Scholar]
- 10.Okuda Y, Kawai K, Chiba Y, et al Effects of parenteral palatinose on glucose metabolism in normal and streptozotocin diabetic rats. Horm Metab Res 1986; 18: 361–364 [DOI] [PubMed] [Google Scholar]
- 11.Nagai Y, Kashimura J, Matsuura M, et al Effect of palatinose administration on blood glucose level. J Jpn Soc Med Use Functional Foods 2006; 3: 459–466 (Japanese). [Google Scholar]
- 12.Kashimura J, Nagai Y, Sasaki H. Palatinose control other sugar digestion or absorption. Proc Res Soc Japan Sugar Refineries Technol 2006; 54: 1–8 (Japanese). [Google Scholar]
- 13.Kashimura J, Nagai Y, Goda T. Inhibitory action of palatinose and its hydrogenated derivatives on the hydrolysis of α‐glucosyl saccharides in the small intestine. J Agric Food Chem 2008; 56: 5892–5895 [DOI] [PubMed] [Google Scholar]
- 14.Kashimura J, Nagai Y, Shimizu T, et al New findings of palatinose function. Proc Res Soc Japan Sugar Refineries Technol 2003; 51: 19–25 (Japanese). [Google Scholar]
- 15.Kashimura J, Nagai Y. Inhibitory effect of palatinose on glucose absorption in everted rat gut. J Nutr Sci Vitaminol 2007; 53: 87–89 [DOI] [PubMed] [Google Scholar]
- 16.Seino Y, Nanjo K, Tajima N, et al Report of the Committee on the Classification and Diagnostic Criteria of Diabetes Mellitus. J Diabetes Invest 2010; 1: 212–228 [DOI] [PMC free article] [PubMed] [Google Scholar]
- 17.Kashiwagi A, Kasuga M, Araki E, et al International clinical harmonization of glycated hemoglobin in Japan: From Japan Diabetes Society to National Glycohemoglobin Standardization Program values. J Diabetes Invest 2012; 3: 39–40 [DOI] [PMC free article] [PubMed] [Google Scholar]
- 18.Tonouchi H, Yamaji T, Uchida M, et al Studies on absorption and metabolism of palatinose (isomaltulose) in rats. Br J Nutr 2011; 105: 10–14 [DOI] [PubMed] [Google Scholar]
- 19.Vozzo R, Baker B, Wittert GA, et al Glycemic, hormone, and appetite responses to monosaccharide ingestion in patients with type 2 diabetes. Metabolism 2002; 51: 949–957 [DOI] [PubMed] [Google Scholar]
- 20.Hira T, Muramatsu M, Okuno M, et al GLP‐1 Secretion in Response to Oral and luminal Palatinose (Isomaltulose) in Rats. J Nutr Sci Vitaminol 2011; 57: 30–35 [DOI] [PubMed] [Google Scholar]


