

Abstract
The formation of precise connections between retina and LGN involves the activity-dependent elimination of some synapses, with strengthening and retention of others. Here we show that the MHC Class I (MHCI) molecule H2-Db is necessary and sufficient for synapse elimination in the retinogeniculate system. In mice lacking both H2-Kb and H2-Db (KbDb−/−) despite intact retinal activity and basal synaptic transmission, the developmentally-regulated decrease in functional convergence of retinal ganglion cell synaptic inputs to LGN neurons fails and eye-specific layers do not form. Neuronal expression of just H2-Db in KbDb−/− mice rescues both synapse elimination and eye specific segregation despite a compromised immune system. When patterns of stimulation mimicking endogenous retinal waves are used to probe synaptic learning rules at retinogeniculate synapses, LTP is intact but LTD is impaired in KbDb−/− mice. This change is due to an increase in Ca2+ permeable AMPA receptors. Restoring H2-Db to KbDb−/− neurons renders AMPA receptors Ca2+ impermeable and rescues LTD. These observations reveal an MHCI mediated link between developmental synapse pruning and balanced synaptic learning rules enabling both LTD and LTP, and demonstrate a direct requirement for H2-Db in functional and structural synapse pruning in CNS neurons.
Early in development before photoreceptors function, retinal ganglion cells (RGCs) spontaneously generate correlated bursts of action potentials called “retinal waves”1–3. Postsynaptic lateral geniculate nucleus (LGN) neurons in turn are driven to fire in similar patterns4,5, and this endogenous activity is even relayed further into the visual system6. While there is consensus that retinal waves and correlated activity are needed for RGC synapse remodeling and segregation of RGC axons into eye-specific layers7,8, little is known at synaptic or molecular levels about how natural patterns of activity are read out to drive elimination and structural remodeling prior to sensory experience. It is assumed that synaptic learning rules are present at retinogeniculate synapses, and that implementation of these rules ultimately leads either to synapse stabilization or elimination. Efforts to discover molecular mechanisms of developmental synapse elimination have implicated several unexpected candidates, all with links to the immune system, including neuronal pentraxins, Complement C1q and Major Histocompatibility Class I (MHCI) family members9–11. However, it is not known if any of these molecules regulate plasticity rules at developing synapses. Moreover, because germline knockout mice were examined in each of these examples, it is not known if neuronal vs immune function is required for synapse elimination in vivo. Here we examine these questions and also test if genetically restoring H2-Db expression selectively to CNS neurons in vivo can rescue synapse elimination in mice that nevertheless lack an intact immune system.
Defective synapse elimination in KbDb−/− LGN
MHCI genes H2-Db and H2-Kb, members of a polymorphic family of over 50, are expressed in LGN neurons10 and were discovered in an unbiased screen in vivo for genes regulated by retinal waves: blocking this endogenous neural activity not only prevents RGC axonal remodeling7, but also downregulates expression of MHCI mRNA12. Previous studies have suggested that MHCI molecules regulate synapse number in cultured neurons13 and are needed for anatomical segregation of RGC axons into LGN layers in vivo10,14. To examine if H2-Kb and H2-Db are involved in functional synapse elimination, whole cell microelectrode recordings were made from individual neurons in WT or KbDb−/− LGN slices (Figure 1a)15,16. Adult mouse LGN neurons normally receive strong monosynaptic inputs from 1–3 RGC axons, but in development, many weak synaptic inputs are present. The majority are eliminated between P5 and P12 prior to eye opening, while the few remaining inputs strengthen resulting in adult-like synaptic innervation by P24-P3015. By gradually increasing OT stimulation intensity, individual RGC axons with progressively higher firing thresholds can be recruited15, generating a stepwise series of EPSCs recorded in each LGN neuron. For example, at P21 in WT, only two steps are present (Figure 1b), indicating that just 2 RGC axons provide input to this LGN neuron, as expected. In contrast, in KbDb−/− LGN neurons, there are many EPSC steps (Figure 1c), a pattern similar to that in much younger WT mice prior to synapse elimination15,16.
Figure 1. Failure of retinogeniculate synapse elimination despite intact retinal waves in KbDb −/−.

(a–e): Impaired synapse elimination in KbDb−/− at P20–24. (a) Slice preparation used for whole cell recording from dLGN neurons and stimulation of retinal ganglion cell (RGC) axons in the optic tract (OT). The retinogeniculate projection is visualized by injecting CTb AF488 (green) into the contralateral eye. (b, c) EPSC amplitude vs OT stimulus intensity. Insets: example traces. (d) Cumulative probability histograms of single fiber synaptic strength (SF-AMPA). Inset: mean±s.e.m. for WT (n=12/N=6); KbDb−/− (n=23/N=8), *p<0.05 (e) Fiber fraction (FF) for WT (n=12/N=6); KbDb −/− (n=21/N=8), **p<0.01, t-test for (d,e). (f,g): Intact retinal waves in KbDb−/− at P10–12. (f) Raster plots of single-unit spike trains recorded from 10 representative RGCs during retinal waves. (g) Correlation indices vs inter-electrode distance for all cell pairs for WT (N=5) vs KbDb−/− (N=6). Data correspond to mean values of medians from individual datasets and error bars represent s.e.m. n=cells/N=animals.
To obtain more quantitative information, minimal stimulation was used to estimate single fiber strength (SF-AMPA)17 (Methods and Extended Data Figure 1a,b). On average, the amplitude of SF-AMPA in KbDb−/− is almost half that of WT, and the cumulative probability distribution of EPSC amplitudes recorded from KbDb−/− LGN neurons is also consistent with the presence of smaller sized EPSCs (Figure 1d; note onset latency of SF-AMPA is similar in both genotypes (Extended Data Figure 1c)). In contrast, maximal synaptic input (Max-AMPA) is not different between WT and KbDb−/− (Extended Data Figure 1d). Fiber fraction, an index of how much each input contributes to total synaptic response15 (Methods), is half as large in KbDb−/− than WT (Figure 1e), consistent with the idea that the number of RGC synapses in KbDb−/− LGN neurons is greater than in WT. An alternative possibility - that differences can arise from altered probability of release - is unlikely because paired-pulse ratio, an index of presynaptic release probability, is similar in WT and KbDb−/− at a variety of stimulus intervals (Extended Data Figure 1e–h). Together these experiments, which directly measure the functional status of synaptic innervation, demonstrate that either or both H2-Kb and H2-Db are required for retinogeniculate synapse elimination.
Extended Data 1. Comparison of retinogeniculate synaptic responses in WT vs KbDb−/−.
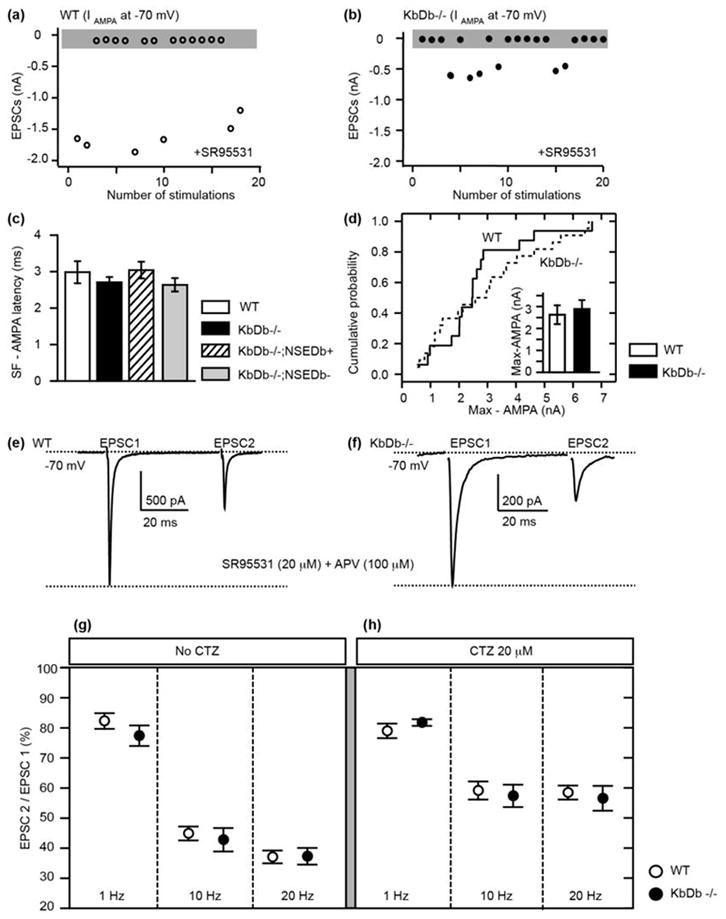
(a,b): Examples of minimal stimulation for WT (open circles) and KbDb −/− (closed circles). Plot of EPSCs peak vs number of stimulations (gray box represents failures, >50%). (c) No difference in onset latency of SF-AMPA between all genotypes. Onset latency of SF-AMPA was estimated using minimal stimulation as time (ms) to reach 10% of peak IAMPA from stimulation artifact. (WT: 3.0±0.3 (n=12); KbDb−/−: 2.7±0.1 (n=23); KbDb−/−;NSEDb+: 3.0±0.2 (n=17); KbDb−/−;NSEDb−: 2.6±0.2 (n=19); p > 0.5, t-test). (d) Cumlative probability histogram shows no difference in Max-AMPA between WT and KbDb−/−. Inset: mean ± s.e.m. WT: 2.6±0.4 nA (n=14/N=6); KbDb−/−: 2.9±0.4 nA (n=22/N=8); p>0.1, Mann-Whitney. (e–h): Presynaptic release probability at KbDb−/− retinogeniculate synapses is similar to WT at P20–24. (e, f) Examples of EPSCs evoked by paired pulse stimulation of OT tract (20 Hz) from WT (e) vs KbDb −/− LGN neuron (f) individual LGN neurons using whole cell recording. (g–h) Paired-pulse depression (PPD) (%) (EPSC 2/EPSC 1) over varying intervals. WT (open circle) vs KbDb−/− (closed circle) (g) without Cyclothiazide (CTZ), a blocker of AMPA receptor desensitization. WT vs KbDb−/−: 1 Hz: 82.3±2.6 (n=10) vs 77.4±3.4 (n=8), 10 Hz: 44.9±2.3 (n=9) vs 42.8±3.9 (n=9), and 20 Hz: 37. 1±2.1 (n=10) vs 37.3±2.8 (n=9) (p>0.1 for each); (h) with CTZ (20 μM) WT vs KbDb−/−: 1 Hz: 79.0±2.4 (n=9) vs 81.8±1.1 (n=7), 10 Hz: 59.2±3.0 (n=8) vs 57.4±3.7 (n=7), and 20 Hz; 58.5±2.3 (n=8) vs 56.6±4.1 (n=7) (p>0.1 for each). N=4 for WT; N=3 for KbDb−/− for (g–h). There was no significant difference in PPD between WT and KbDb−/−, but note significant decrease of PPD +20 μM CTZ vs 0 μM CTZ application for both WT and KbDb−/− at 10 Hz and 20 Hz (p < 0.05). t-test. mean ± s.e.m. n=cells/N=animals.
Intact retinal wave activity in KbDb−/− mice
Many previous studies have shown that retinogeniculate synapse elimination and eye-specific segregation in LGN fail if retinal waves are blocked or perturbed2,7,8. Thus, waves could be absent or abnormal in KbDb−/−. To examine this possibility, waves were recorded using a multi-electrode array (MEA) to monitor action potential activity from many ganglion cells in KbDb−/− or WT retinas between P5-P12, the peak period of extensive RGC synapse remodeling requiring waves. The spatio-temporal pattern of waves in KbDb−/− is indistinguishable from WT, (Figure 1f; Extended Data Figure 2a–e). Moreover, the correlation index between all RGC pairs, a measure of the distance over which cells fire together1,3,18, is almost identical (Figure 1g; Extended Data Figure 2a). Retinal wave activity also transitioned normally from cholinergic-dependent stage II (P5–8) to glutamatergic-dependent stage III (P10–12) (Extended Data Figure 2a–e)8. After eye opening, vision in KbDb−/− mice is also normal14. Thus, synapse elimination and eye-specific segregation fail to occur despite intact retinal activity patterns in KbDb−/− mice, implying that one or both of these MHCI proteins acts downstream of activity to drive synapse remodeling.
Extended Data 2. Intact spatio-temporal pattern of retinal waves in KbDb −/− at P5–12.
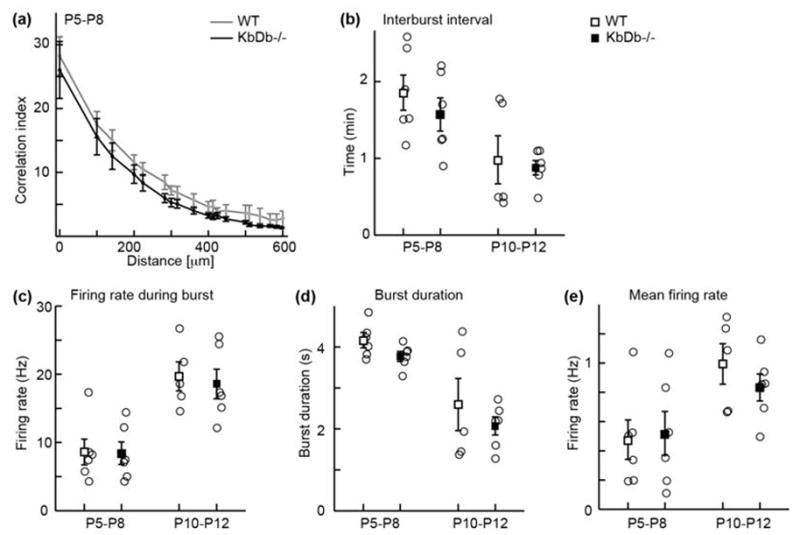
(a) Correlation indices as a function of inter-electrode distance for all cell pairs for WT (gray) and KbDb −/− (black) at P5–P8. Data points correspond to mean values of medians from individual datasets and error bars represent s.e.m. (b–e): Summary of temporal firing patterns for retinas isolated from WT (open squares) and KbDb −/− (filled squares) mice at P5–P8 (stage II, cholinergic waves) and P10–P12 (stage III, glutamatergic waves). Open circles correspond to the mean values of individual retinas. (b) Interburst interval for II (min): WT: 1.9±0.2; KbDb−/−: 1.6±0.2, III: WT: 1.0±0.3; KbDb−/−: 0.9±0.1 (c) firing rate during burst for II (Hz): WT: 8.6±1.9; KbDb−/−: 8.4±1.7, III: WT: 19.7±2.1; KbDb −/−: 18.6±2.2. (d) Burst duration for II (sec): WT: 4.2±0.2; KbDb−/−: 3.8±0.1, III: WT: 2.6±0.6; KbDb−/−: 2.1±0.2 (e) Mean firing rate for II (Hz): WT: 0.5±0.1; KbDb−/−: 0.5±0.2, III: WT: 1.0±0.1; KbDb−/−:0.8±0.1, mean±s.e.m. (p>0.05 for each, t-test, N=6 animals for each group except N=5 for stage III WT; non-blind experiments).
Neuronal H2-Db rescues elimination and segregation
H2-Db and H2-Kb are also critical for immune function and CD8 T-cell development19. Both MHCI molecules are expressed in LGN during the period of retinogeniculate synaptic refinement, with H2-Db higher than H2-Kb10,14. To separate a contribution of the immune system, and to examine if neuronal expression is sufficient for synapse elimination, H2-Db expression was restored exclusively to neurons by crossing KbDb−/− mice to NSEDb+ mice in which H2-Db expression is regulated under the neuron specific enolase (NSE) promoter20. “Rescued” offspring littermates have H2-Db expression restored to CNS neurons while the rest of the body remains KbDb−/− (KbDb−/−;NSEDb+); “control” littermates (KbDb−/−;NSEDb−) lack H-2Kb and H2-Db everywhere (Extended Data Figure 3a). Genomic rescue, as well as low but highly significant levels of H2-Db mRNA (p=0.0001) and protein can be detected in KbDb−/−;NSEDb+ thalamus at P10 (Extended Data Figure 3b–e). In contrast, no H2-Db can be detected in spleen, gut or liver, with little if any expression in retina, hippocampus and cortex of KbDb−/−;NSEDb+ mice.
Extended Data 3. Rescue of H2-Db expression in brain of KbDb−/−;NSEDb+.
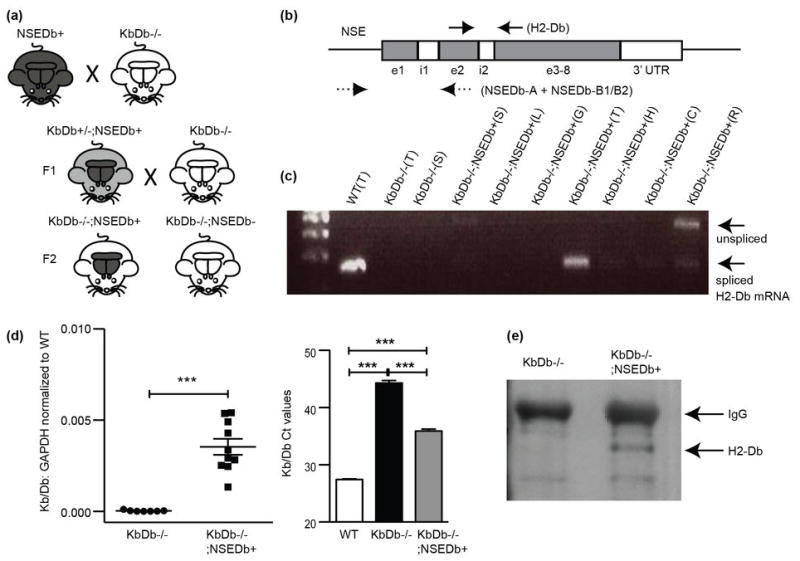
(a) Diagram of breeding strategy to generate KbDb−/−;NSEDb+ mice. KbDb−/− (white indicates absence of Db) were crossed to NSEDb transgenic mice (black indicates presence of Db in both body and brain). From F1 offspring, KbDb+/−;NSEDb+ (gray body, black brain) were selected and crossed to KbDb−/− further, generating KbDb−/−;NSEDb+ (black brain with white body indicates rescue of Db expression in brain alone) and KbDb−/−;NSEDb− littermate controls (white body, white brain). (b) (Top) H2-Db specific primers: Solid arrows: forward (exon 2) and reverse (exon 3) for ~200 bp spliced mRNA as well as unspliced proRNA (~500 bp) (e; exon, i; intron). Dotted arrows: NSEDb-A (forward, NSE promoter region) and NSEDb-B1 and/or B2 (reverse, exon 2) for genotyping and mRNA detection44. (c) RT-PCR showing rescue at P10 in thalamus of KbDb−/−;NSEDb+ mice cDNAs. WT thalamus (WT(T)) shown as positive control; KbDb−/− thalamus (KbDb−/−(T)) and spleen (KbDb−/−(S)) as negative controls, and various organs from KbDb−/−;NSEDb+ (spleen (S), liver (L), gut (G), thalamus (T), hippocampus (H), cortex (C), retina (R)) were used as templates. (d) Quantitative PCR comparing relative H2-Kb/-Db gene expression in WT, KbDb−/−, and KbDb−/−;NSEDb+ thalami. (Left) Results show small but highly significant rescue of H2-Db mRNA expression in KbDb−/−;NSEDb+ (KbDb−/−: 0.00003±0.00002, KbDb−/−;NSEDb+: 0.0035±0.00044 relative to WT: 1.0056±0.032, *** p = 0.0001). Each point represents average relative gene expression for one animal. (Right) Raw H2-Kb/Db Ct values for each genotype (WT: 27.4±0.1, KbDb−/−: 44.3±0.4, KbDb−/−;NSEDb+: 35.9±0.3, *** p<0.001), one-way ANOVA, mean±s.e.m. N=5 animals for WT, 7 for KbDb−/−, 10 for KbDb−/−;NSEDb+. (e) Rescue of H2-Db protein in KbDb−/−;NSEDb+ brains at P60. Western blot of immunoprecipitation from whole brains (three pooled brains) lysate from KbDb−/− and KbDb−/−;NSEDb+. H2-Db specific signal from KbDb−/−;NSEDb+ appears below IgG band.
In KbDb−/−;NSEDb+ LGN neurons, only 1–2 EPSC steps could be evoked in response to increasing OT stimulus intensity (Figure 2a), similar to the mature WT innervation pattern (cf Figure 1b) but very different from littermate KbDb−/−;NSEDb− controls (Figure 2b). Minimal stimulation also revealed an increase in SF-AMPA strength (Figure 2c; Extended Data Figures 1c, 4b). Max-AMPA is similar between these genotypes (Extended Data Figure 4a); thus fiber fraction in KbDb−/−;NSEDb+ LGN neurons is 56%, vs 25% in KbDb−/−;NSEDb− neurons (Figure 2d) - also strikingly similar to WT (cf Figure 1e). Thus, expression of H2-Db in neurons rescues RGC synapse elimination in LGN of KbDb−/− close to WT levels.
Figure 2. H2-Db expression in neurons rescues synapse elimination and eye-specific segregation in KbDb−/− LGN.

(a–d): Rescue of synapse elimination at P20–24. (a,b) EPSC amplitudes vs OT stimulus intensity. Insets: example traces. (c) Cumulative probability histogram of SF-AMPA. Inset: mean ± s.e.m. for control: Db− (KbDb−/−;NSEDb−, n=19/N=5). Rescue: Db+ (KbDb−/−;NSEDb+, n=17/N=7), **p<0.01. (d) Fiber Fraction is also rescued in KbDb−/−;NSEDb+ (n=16/N=7) compared to KbDb−/−;NSEDb− (n=18/N=5), *p<0.05, Mann-Whitney for (c–d). Horizontal gray bars delineate Figure 1e data (mean±s.e.m.). (e,f): Rescue of eye-specific segregation in KbDb−/−;NSEDb+ at P34. (e) Top: Coronal sections of dLGN showing pattern of retinogeniculate projections from the ipsi (green) and contralateral (red) eyes. Bottom: Region of ipsi-conta pixel (white) overlap between the two channels at 60% intensity threshold (T60%). (f) % dLGN area occupied by ipsi-contra overlap. mean±s.e.m. for KbDb−/−;NSEDb− (N=3) and KbDb−/−;NSEDb+ (N=4) (T60 %) (*p<0.05, two way ANOVA) (See Extended Data Figure 5). Horizontal gray bar indicates WT value at T60 % (from Datwani et al., 2009)14. n=cells/N=animals.
Extended Data 4. Cumulative probability distribution for SF-AMPA and Max-AMPA recorded at retinogeniculate synapses according to H2-Db Genotype.
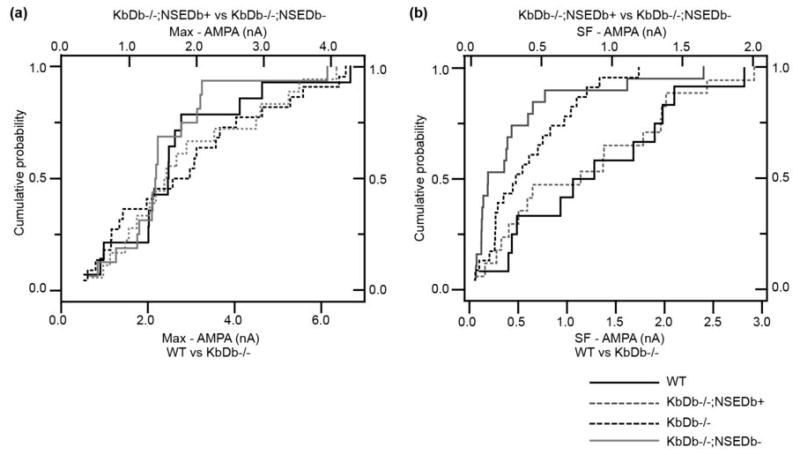
Max-AMPA (a) and SF-AMPA (b) showed similar cumulative probability histograms between WT (black line) and KbDb−/−;NSEDb+ (broken gray line) and KbDb−/− (broken black line) and KbDb−/−;NSEDb− (gray line). Number of experiments are the same as in the main text, except for Max-AMPA: for KbDb−/−;NSEDb−: n=18 cells/N=5 animals; for KbDb−/−;NSEDb+: n=16/N=7 (p>0.05, Mann-Whitney). Fiber Fraction calculated from Max-AMPA and SF-AMPA measurements is similar between WT and KbDb−/−;NSEDb+ (Figure 2D).
The formation of the adult anatomical pattern of eye-specific segregation in the LGN involves synapse elimination: initially intermixed retinal ganglion cell axons from the right and left eyes remodel, eventually restricting their terminal arbors to the appropriate LGN layer21,22. To examine if eye-specific segregation in the LGN is also rescued, anatomical tract tracing methods14,23 were used at P34, an age chosen because it is more than three weeks after segregation is normally complete as assessed anatomically. The retinogeniculate projections in LGN of KbDb−/−;NSEDb+ mice appear almost indistinguishable from WT, both in eye-specific pattern (Figure 2e) and in percent ipsi-contra overlap (Figure 2f; Extended Data Figure 5a,b). Segregation is impaired in control KbDb−/−;NSEDb− littermates (Figure 2e), as expected from previous studies of KbDb−/− mice14. These anatomical results support the electrophysiological studies above and strongly suggest that both RGC synapse elimimation and eye-specific segregation require neuronal H2-Db.
Extended Data 5. Neuronal H2-Db expression in KbDb−/− rescues impaired eye-specific axonal segregation at P34.
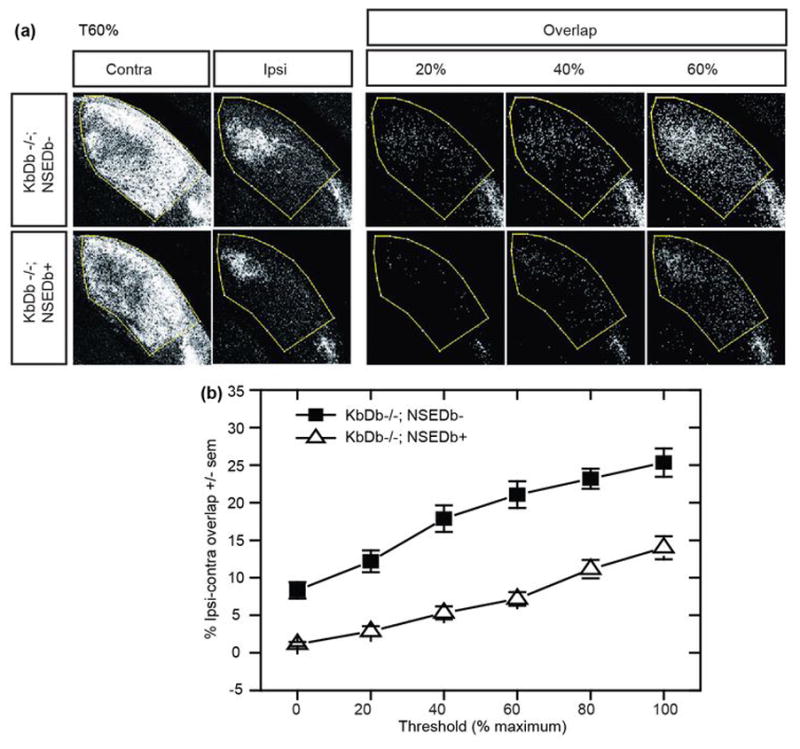
(a) Coronal sections of dLGN of KbDb−/−;NSEDb− (top row) and KbDb−/−;NSEDb+ (“rescue”; bottom row) showing pattern of RGC axonal projections from the two eyes after intraocular tracer injections of CTB AF488 (red channel; contralateral eye injected) or AF568 (green channel; ipsilateral eye injected). (Left: Thresholded fluorescent images of dLGN at 60% maximum signal intensity (see Figure 2E). Right: Overlap of RGC projections (white pixels) from ipsilateral and contralateral eyes displayed for 20%, 40%, and 60% maximal threshold for KbDb−/−;NSEDb− (top) and KbDb−/−;NSEDb+ (bottom). Overlap = pixels labeled in both red and green channels. (b) Mean % dLGN area±s.e.m. pixel overlap for KbDb−/−;NSEDb− (closed squares) vs KbDb−/−;NSEDb+ (open triangles): 0% threshold: 8.3±1.1 vs 1.2±0.3; 20% threshold: 12.2±1.5 vs 2.9±0.7; 40% threshold: 17.9±1.8 vs 5.3±0.9; 60% threshold: 21.1±1.8 vs 7.2±0.9; 80% threshold: 23.2±1.3 vs 11.1±1.2; 100 %: 25.3±1.9 vs 14.0±1.5 (p < 0.05, two-way ANOVA). See Methods and Torborg and Feller (2004)54.
Impaired LTD with natural activity patterns
Synapse elimination is thought to involve cellular processes leading to synaptic weakening such as LTD24,25; conversely LTP-like mechanisms are postulated for synaptic strengthening and stabilization26,27. In addition, spike timing-dependent mechanisms are crucial in Xenopus tectum for visually-driven tuning of receptive fields28. In mammalian LGN, LTP29 or LTD30 can be induced at retinogeniculate synapses using 100 Hz OT stimulation, which is far from the endogenous bursting patterns generated by retinal waves (Figure 1f,g)1–4. However, realistic patterns of OT stimulation mimicking waves, paired with postsynaptic depolarization of LGN neurons have also been used; results revealed a synaptic learning rule that generates LTP when pre- and postsynaptic activity are coincident31,32, but LTD when presynaptic OT activity precedes postsynaptic LGN depolarization within a broad window corresponding to the 60–90 second duty cycle of retinal waves (Figure 3a–c; Extended Data Figure 2b)31. Moreover, using these timing patterns in conjunction with optogenetic stimulation of retina is sufficient either to drive or prevent segregation of RGC axons depending on the pattern33. To determine if synaptic learning rules based on natural activity patterns are altered at KbDb−/− retinogeniculate synapses, perforated patch recordings were made in LGN slices from WT vs KbDb−/− at P8–13, the relevant period when extensive synapse elimination and eye-specific segregation are actually occurring. First, paired pulse stimulation was used to examine release probability: the same amount of synaptic depression was observed in WT and KbDb−/−, implying similar probabilities. (Extended Data Figure 6). Next, synchronous activity patterns were used, in which 10 Hz OT stimulation was paired with LGN depolarization (Figure 3a,b: 0 ms latency), generating 10–20 Hz bursts of action potentials in LGN neurons mimicking retinal waves4,5. In WT, synchronous stimulation induced long-term synaptic potentiation (LTP) (Figure 3d,f; 117±8 % over baseline; p<0.001). In KbDb−/− LGN neurons, the same protocol elicited LTP indistinguishable from WT (Figure 3e,f).
Figure 3. Impaired LTD but intact LTP at retinogeniculate synapses in KbDb−/− induced with natural activity patterns.

(a) Diagram illustrating basis for timing dependent plasticity at developing retinogeniculate synapses. Spontaneous retinal waves propagate from “a, b” towards “c, d”; neighboring RGCs fire synchronously but asynchronously with respect to RGCs located elsewhere. Waves drive action potentials in postsynaptic LGN neurons with varying time delays between pre- and postsynaptic activity. Ages P8–13 studied. (b–c) Top: Conditioning protocol for LTP (0 ms latency; b) or LTD (1100 ms latency; c); Bottom: example membrane potential changes recorded in LGN neuron during conditioning protocol. (d–f): Intact LTP in KbDb−/−. Single experiment showing LTP in WT (d) and KbDb−/− (e). EPSC peak amplitude vs time. (f) Summary of all 0 ms latency experiments: EPSC peak amplitude (% change from baseline) vs time (n=6/N=6 for each; p>0.1, t-test). (g–i): Deficient LTD in KbDb−/−. Single experiment for WT (g) and KbDb−/− (h). EPSC peak amplitude vs time. (i) Summary of all 1100 ms latency experiments: EPSC peak amplitude (% change from baseline) vs time (n=7/N=7 for each; p<0.01, t-test). Gray bars=induction period. Insets: Average EPSCs (30 traces) before (gray) and after (black) induction. (f), (i): 1 min data binning. Ra=access resistance (MΩ). n=cells/N=animals.
Extended Data 6. Intact release probability at KbDb−/− retinogeniculate synapses before eye-opening.
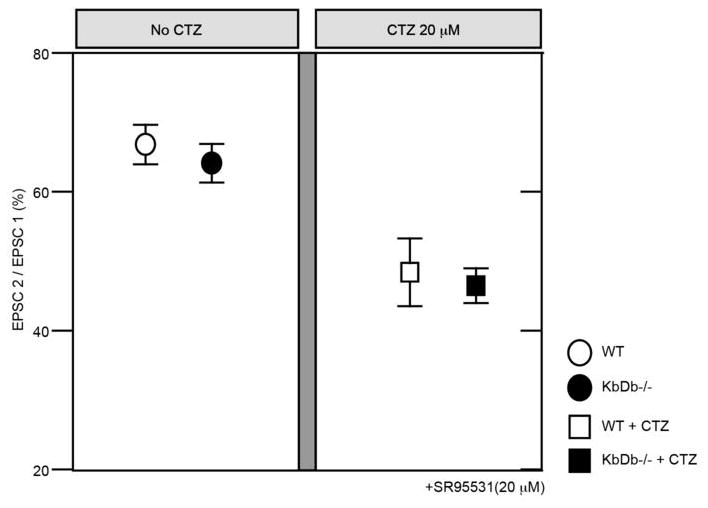
Paired pulse stimulation was delivered to the OT at 10Hz, similar to the natural firing frequency of RGCs (Extended Data Figure 2c), and whole cell recordings were made from LGN neurons in slices aged between P8–13. Paired pulse stimulation resulted in synaptic depression, represented as EPSC 2 divided by EPSC 1 (%). In 0 μM CTZ (left panel): WT: 67.0±2.9 (n=11/N=4); KbDb−/−: 64.2±2.8 (n=7/N=2). In 20 μM CTZ, (right panel): WT: 48.6±4.9 (n=8/N=3); KbDb−/−: 46.6±2.5 (n=7/N=2) (p>0.1 for each, t-test). mean±s.e.m. 20 mM BAPTA containing Cs+-internal solution was used for this experiment due to prolonged kinetics of EPSCs in KbDb−/−. The identical paired pulse ratios between WT and KbDb−/− are consistent with the conclusion that presynaptic release probability is intact at P8–13 retinogeniculate synapses in KbDb−/− mice. (See also Extended Data Figure 1e–h for similar conclusion at P20–24, after synapse elimination is largely complete.)
In contrast, induction using asynchronous activity patterns reveals a defect in long-term synaptic depression (LTD). In WT, when OT stimulation preceeds LGN neuron depolarization by 1.1 sec (Figure 3a,c: 1100 ms latency), LTD results (Figure 3g,i: 12% decrease from baseline; p<0.001). In contrast, in KbDb−/−, the same induction protocol failed to induce synaptic depression; if anything, a slight but significant potentiation was seen (Figure 3h,i: 5% increase from baseline; p<0.005). Thus, while LTD using asynchronous pre- and postsynaptic activity patterns is a robust feature of WT retinogeniculate synapses during the period of synapse elimination and eye-specific layer formation, it appears to be absent in KbDb−/−. This impairment is consistent with the failure of synapse elimination and axonal remodeling in KbDb−/−.
Ca2+ permeable AMPA receptors at KbDb −/− synapses
Impaired LTD in KbDb−/− could be due to altered regulation of NMDA receptor mediated synaptic responses, since LTP and LTD are known to be dependent on NMDA receptors at a variety of synapses26. Surprisingly the NMDA/AMPA ratio was not different between genotypes (Extended Data Figure 7a,b). However, the kinetics of IAMPA recorded in KbDb−/− LGN neurons are markedly prolonged compared to WT (Figure 4a–d). The slowed decay in KbDb−/− EPSCs is unlikely due to different peak IAMPA amplitudes (p>0.1; Figure 4d), but could occur if there were greater Ca2+ infux through AMPA receptors.
Extended Data 7. Normal NMDA/AMPA ratio but increased Ca2+ permeable AMPA receptors at retinogeniculate synapses in KbDb −/−.
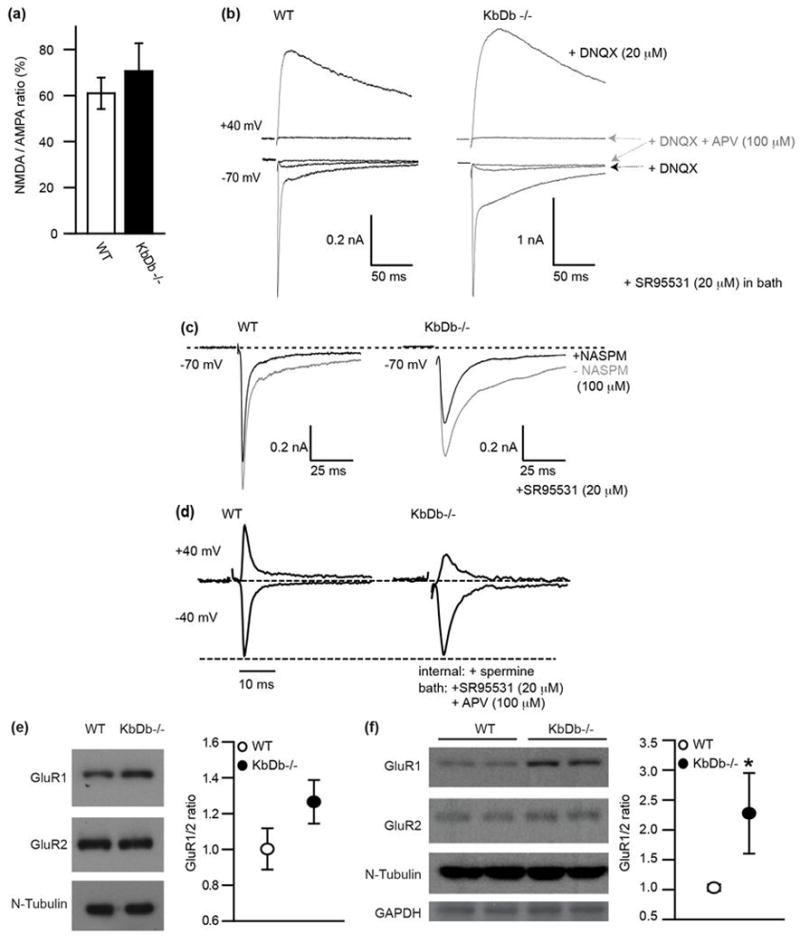
(a,b): NMDA/AMPA ratio is unchanged in KbDb−/−. (a) NMDA/AMPA ratio (%): Peak IAMPA measured at −70 mV (+20 μM SR95531) vs peak INMDA at +40 mV (+20 μM SR95531 + 20 μM DNQX): WT: 61±6.8 (n=10/N=4); KbDb−/−: 70.6 ± 12.1 (n=7/N=3) (p>0.1, t-test). mean±s.e.m. (b) Example recordings from individual neurons for WT (left) and KbDb−/− (right). APV (100 μM) was added at the end of each experiment to confirm NMDA-mediated synaptic currents. D600 in pipette. (c) Example showing effect of NASPM (100 μM bath) on IAMPA: note significant blockade of IAMPA in KbDb−/−. Gray line: prior to NASPM; black line: after NASPM (5 traces averaged for single cell) SR95531 in bath for (a–c). (d) Examples for IAMPA normalized to EPSC amplitude at −40 mV. Note reduction in EPSC amplitude at +40 mV in KbDb−/− but not WT. 100 μM APV + 20 μM SR95531 in bath. Spermine (100 μM) and D600 (100 μM) in pipette. Ages: P8–13. Experimenter was aware of genotype due to obvious differences in time course of EPSCs and effects of NASPM. (e) Example Western blot (left) and GluR1/GluR2 ratio (right) of P22 thalamus; WT: 1.0 ± 0.1 (N=12); KbDb−/−: 1.3 ± 0.1 (N=13) (p=0.07). (f) Example Western blot (left) and GluR1/GluR2 ratio (right) of cultured cortical neurons; WT: 1.0 ± 0.1 (N=4); KbDb−/−: 2.3 ± 0.7 (N=4) (*p=0.03). Mann-Whitney for (e, f), n=cells/N=animals.
Figure 4. Increased Ca2+-permeable AMPA receptors at retinogeniculate synapses in KbDb−/− LGN.
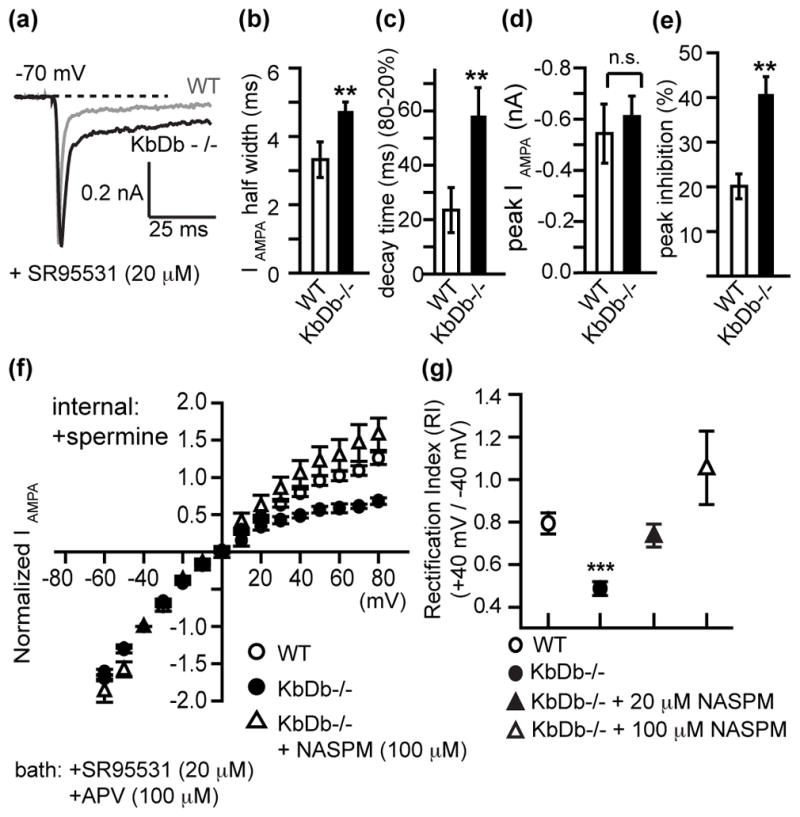
(a–d): Prolonged decay kinetics of IAMPA in KbDb−/−. (a) Average IAMPA (5–10 EPSCs) for WT vs KbDb−/− LGN neurons (b) IAMPA Half width (ms), (c) IAMPA decay time (ms) and (d) Peak amplitude (nA) for WT vs KbDb−/− (WT: n=16/N=4; KbDb−/−: n=22/N=5). (e) Increased % inhibition of peak IAMPA by NASPM (100 μM) in KbDb−/− (n=13/N=4) vs WT (n=9/N=3) (**p<0.01; n.s.: not significant; Mann-Whitney for b–c). (f) IAMPA I–V curves (normalized to −40 mV). (g) Rectification Index (RI) for WT (n=14/N=3), KbDb−/− (n=9/N=3), KbDb−/− +20 μM NASPM (n=16/N=4) or KbDb−/− +100 μM NASPM (n=6/N=2) (***p<0.001 for WT vs KbDb−/−; p>0.05 for WT vs KbDb−/− +NASPM (20 or 100 μM), Mann-Whitney). Ages studied: P8–13. Also see Extended Data Figure 7. n=cells/N=animals.
Ca2+ permeable AMPA (CP-AMPA) receptors are blocked selectively by bath-applying the specific antagonist NASPM, a synthetic homolog of Joro Spider Toxin34. Indeed in KbDb−/− LGN neurons, 100 μM NASPM blocked 40% of the current recorded at −70mV but only 20% in WT (Figure 4e; Extended Data Figure 7c), confirming a two fold increase in CP-AMPA receptor mediated currents in KbDb−/− neurons. Another diagnostic feature of CP-AMPA receptors is rectification in the current-voltage (I–V) relationship when spermine is present in the internal recording solution34–36. In WT, the I–V relationship is linear. However in KbDb−/− LGN neurons, rectification is very prominent (Figure 4f,g; Extended Data Figure 7d) but can be linearized close to WT levels by bath application of NASPM (Figure 4f,g), implying that the prominent I–V rectification in KbDb−/− arises from an increase in CP-AMPA receptors.
Differences in composition of GluR subunits are known to modulate AMPA receptor Ca2+ permeability, and tetramers containing GluR2 confer Ca2+ impermeability35. Indeed, the ratio of GluR1 to GluR2, the most prevalent subunits35,37,38, is slightly increased in developing thalamus from KbDb−/− mice (30% increase in KbDb−/−, p=0.07; Extended Data Figure 7e). The thalamus is highly heterogeneous, so we also examined cortical neuronal cultures: the ratio of GluR1 to GluR2 is also significantly increased (230% increase in KbDb−/−; p=0.03; Extended Data Figure 7f). Elevated levels of GluR1 subunits suggest that AMPA receptors in KbDb−/− are more likely to be composed of GluR1 homomers, yielding increased Ca2+ permeability. Together, results point to an increase in CP-AMPA receptors in KbDb−/−. Similar increases in CP-AMPA receptors at other synapses are known to shift synaptic learning rules away from LTD and towards LTP39,40. If so, the deficit in LTD observed with the asynchronous pairing protocol (Figure 3c,i) in KbDb−/− LGN should be rescued using NASPM to block CP-AMPA receptors- just what is observed (Extended Data Figure 8).
Extended Data 8.
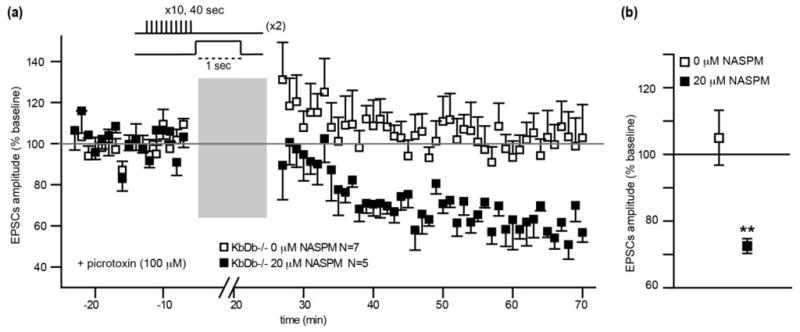
NASPM-dependent rescue of LTD in KbDb−/− LGN at P8–13. (a) Summary of all 1100 ms latency experiments: EPSC peak amplitude (% change from baseline) vs time (n=7/N=7 for 0 μM NASPM; n=5/N=5 for 20 μM NASPM). Gray bar=induction period (Methods). 1 min data binning. (b) Average of % change (mean±s.e.m.); KbDb−/− 0 μM NASPM: 105±8.2 (N=7); KbDb−/− +20 μM NASPM: 72.5±2.2 (N=5). **p<0.01, t-test, n=cells/N=animals.
Neuronal H2-Db rescues synaptic function and LTD
If H2-Db affects synapse elimination by regulating properties of AMPA receptors, then retinogeniculate EPSCs should be rescued to WT in the LGN of KbDb−/−;NSEDb+ mice. Indeed, the kinetics of IAMPA are significantly faster in KbDb−/−;NSEDb+ LGN neurons compared to KbDb−/−;NSEDb− (Figure 5a–c; Extended Data Figure 9a), implying a decrease in Ca2+ permeable AMPA receptors. Accordingly, NASPM-dependent inhibition of IAMPA is only 20% in KbDb−/−;NSEDb+, significantly reduced from the 40% inhibition observed in littermate KbDb−/−;NSEDb− (Figure 5d; Extended Data Figure 9a). Moreover, the I–V relationship is linearized in KbDb−/−;NSEDb+ LGN neurons when spermine is present in the internal recording solution, and bath application of NASPM has little additional effect (p>0.5 at +40 mV), similar to WT (Figure 5e; Extended Data Figure 9b). Since the Ca2+ permeability of AMPA receptors is close to WT levels in KbDb−/−;NSEDb+ LGN, it is possible that LTD is also rescued. Indeed, the same asynchronous activity pattern that failed to induce LTD in KbDb−/− (Figure 3), induces robust LTD (15%; p<0.001) in KbDb−/−;NSEDb+ neurons, similar to WT (Figure 5f, g). Together these observations suggest that restoring expression of H2-Db in neurons is sufficient to rescue LTD at retinogeniculate synapses via decreasing the Ca2+ permeability of AMPA receptors.
Figure 5. Neuronal expression of H2-Db restores Ca2+ impermeable AMPA receptors and rescues LTD.

(a) IAMPA half width (ms), (b) IAMPA decay time (ms), and (c) Peak amplitude (nA) for KbDb−/−;NSEDb− (n=9/N=2) and KbDb−/−;NSEDb+ (n=11/N=4). (d) Reduced % inhibition of peak IAMPA by NASPM (100 μM) in KbDb−/−;NSEDb+ (n=10/N=3) compared to KbDb−/−;NSEDb− (n=8/N=2); *p<0.05, **p<0.01, ***p<0.001, Mann-Whitney for (a–d). (e) Rescue of IAMPA linear I–V relationship in KbDb−/−;NSEDb+ LGN. Rectification Index at +40 mV (RI) for KbDb−/−;NSEDb− (n=11/N=3) and KbDb−/−;NSEDb+ (n=13/N=5) shows significant difference (**p<0.005); KbDb−/−;NSEDb+ (+NASPM) (n=7/N=3) is not significantly different to KbDb−/−;NSEDb+ (p>0.05), Mann-Whitney. See also Extended Data Figure 9. mean ± s.e.m. (f,g) LTD rescued in KbDb;NSEDb+ LGN neurons. (f) Ensemble average of all experiments at P8–9 (see Figure 3). Gray bar=LTD induction period. 1 min data binning. (g) Average % change (mean±s.e.m.) for WT (N=7), KbDb−/− (N=7), or KbDb−/−;NSEDb− (N=7) and KbDb−/−;NSEDb+: (N=9). *p<0.05, **p<0.01, n.s.; not significant, t-test. P8–13 ages studied. n=cells/N=animals.
Extended Data 9. Neuronal H2-Db expression decreases Ca2+ permeability of AMPA receptors at retinogeniculate synapses in KbDb−/−;NSEDb+.
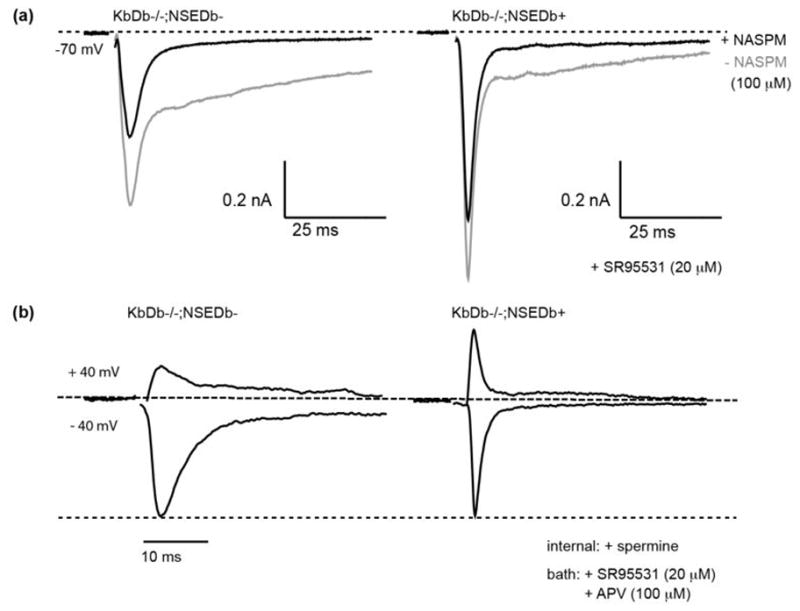
(a) NASPM blockade of IAMPA is significantly reduced in KbDb−/−;NSEDb+. Example of NASPM effect on IAMPA recorded from KbDb−/−;NSEDb− (left) or KbDb−/−;NSEDb+ (right) individual LGN neurons. Gray line: prior to NASPM; black line: after NASPM application (5 traces averaged for single cell); 20 μM SR95531 in bath. (b) Internal spermine-dependent block of IAMPA at positive membrane potentials is rescued in KbDb−/−;NSEDb+ LGN neurons. Example recordings for IAMPA normalized to EPSC amplitude at −40 mV from individual neurons. Note reduction in EPSC amplitude at +40 mV in KbDb−/−;NSEDb−, but restored to WT level in KbDb;NSEDb+. 100 μM APV + 20 μM SR95531 in bath. Spermine (100 μM) and D600 (100 μM) in internal solution.
Discussion
A major finding of this study is that the link between activity-dependent synapse pruning during development, and regulation of LTD and CP-AMPA receptors, requires neuronal MHCI function. It is notable that synapse elimination fails despite the fact that retinal waves and retinogeniculate basal synaptic transmission are intact. The persistence of multiple innervation in KbDb−/− LGN neurons is highly reminiscent of the immature synaptic connectivity in LGN of younger WT mice15, as well as of abnormal connectivity observed in LGNs of dark-reared or TTX-treated WT mice16. Together these considerations imply that H2-Db and H2-Kb act downstream of neural activity. In studying synaptic plasticity at retinogeniculate synapses, we imposed plasticity induction protocols that mimic natural patterns of spiking activity present in the retinogeniculate system during synapse elimination and eye-specific segregation. Our observation that in KbDb−/− mice LTD is impaired while LTP is intact can explain the failure in retinogeniculate synapse elimination: if synapses cannot undergo weakening, then they cannot be eliminated. Because immunostaining for MHCI proteins H2-Db and H2-Kb is colocalized with synaptic markers in Array Tomography14 and at synapses in immuno-electron microscopy14,41, these observations also argue strongly that H2-Db and/or H2-Kb at synapses regulate mechanisms of LTD, which in turn are required for synapse elimination. It would be useful to know if other molecules implicated in RGC synapse elimination such as C1q9, which colocalizes with H2-Db and H2-Kb at synapses14, also alter LTD or instead act downstream of MHCI to target already weakened synapses for removal.
The rescue experiments performed here imply that a single MHCI molecule - H2-Db, when expressed in neurons - is sufficient for functional synapse elimination and anatomical eye-specific segregation in the LGN. By crossing KbDb−/− mice to NSEDb transgenic mice, expression of H2-Db alone was restored to neurons but not elsewhere in the body, rescuing LTD, functional synapse elimination, Ca2+-impermeable AMPA receptors and structural remodeling at retinogeniculate synapses. Notably, these brain phenotypes are rescued even though the immune system is still impaired in KbDb−/−;NSEDb+ mice. Until this experiment, it was not known if any one MHCI molecule is sufficient either in vitro or in vivo, nor has it been possible to separate the general effects of immune compromise from the absence of H2-Db and/or H2-Kb in neurons. Together observations argue for a key role for H2-Db in reading out endogenous activity patterns into a lasting structural framework. In the human genome, as in mice, the MHCI (HLA) locus is large and highly polymorphic. Recent GWAS studies have consistently linked specific SNPs in MHCI to Schizophrenia42,43. Our observations offer possible mechanistic insight: alterations in expression levels of specific MHCIs at neuronal synapses could trigger changes in activity-dependent plasticity and synaptic pruning during critical periods of human development, generating lasting alterations in circuits and behavior.
Methods
1. Genotyping
KbDb−/−: Three primer sets were mixed together (A: 5′-CGGAAGTCGCCTTACCTGATTG-3′, B: 5′-CAGCAGAAACATACAAGCTGTC-3′, C: 5′-GTCTCCTCTGGCACCTATGGG-3′), from which bands of 520 bp were detected for WT, 400 bp for KbDb −/− and double bands of 520 bp + 400 bp for heterozygote KbDb +/−. NSEDb mice and KbDb−/−;NSEDb+: Several primer sets were used, resulting in reliable and consistent results: A primer set consisting of NSEDb-A (5′-GAGATCGACTCTAGAGGATC-3′) and NSEDb-B1 (5′-GCGCTCTGGTTGTAGTAGCC-3′)44 or NSEDb-B2 (5′-GTAGCCGAGCAGGTTCCTCA-3′) amplifies part of NSE promoter region and exon 2 of H2-Db cDNA (~500 bp) (Extended Data Figure 3b). Another primer set was designed to detect a unique Db minigene expression cassette of ~800 bp. (A: 5′-CGACACAGGGACGCTGACG-3′, B: 5′-CAGCTCCAATGATGGCCATAG-3). Taqman qPCR primer mix (H2-D1/H2-K1 (Mm04208017_mH) was also used, with same results.
2. Slice Preparation
Parasagittal brain slices containing the dorsal lateral geniculate nucleus (dLGN) and optic tract (OT) were obtained as previously described45,46. The brain was removed rapidly and immersed into oxygenated ice-cold choline-based slicing solution (composition in mM: 78.3 NaCl, 23 NaHCO3, 33.8 Choline Chloride, 2.3 KCl, 1.1 NaH2PO4, 6.4 MgCl2·6H2O, 0.45 CaCl2·2H2O, 23 glucose, aerated with 95% O2/5% CO2). The hemispheres were separated at an angle of 5°–10° relative to midline. The larger hemisphere including optic tract (OT) was glued onto the cutting stage of a vibratome (Leica VT1000S) at an angle of 15~20°, which puts optic tract and LGN in the same plane relative to the blade; 250 μm thick slices were cut. Note that only one slice per animal containining both intact OT and LGN can be obtained due to the small size of the LGN at relevant ages. Cortex was separated from thalamus to prevent excitatory recurrent disynaptic responses between dLGN and corticothalamic neurons. Slices were recovered at 31°C for 30 min in choline chloride slicing solution, and then for 30 min in artificial cerebrospinal fluid (ACSF) (ACSF composition in mM: 125 NaCl, 26 NaHCO3, 2.3 KCl, 1.26 KH2PO4, 1.3 MgSO4·7H2O, 2.5 CaCl2·2H2O, 25 glucose, aerated with 95% O2/5% CO2).
3. Electrophysiology
All recordings were at room temperature in a chamber with constant ACSF flow, except for paired-pulse ratio measurements, which were made at 30~32°C. Stimulating electrode(s) were placed along the OT at the ventral end of dLGN and/or lateral edge of dLGN aligned with the recording site. dLGN neurons were distinguished by their large soma size and 3+ primary dendrites46. For synaptic current measurements, glass electrodes were filled with Cs+-based internal recording solution (2~4 MΩ, composition in mM: 105 CsCl, 20 TEA-Cl, 2 MgCl2, 1 EGTA, 10 HEPES, 3 Mg-ATP, 15 Phosphocreatine, 1 Na-GTP, 5 QX-314, pH 7.4, 280 mOsm). To block inhibitory synaptic responses, SR95531 (20 μM; Tocris, MO) or Picrotoxin (100 μM; Sigma-Aldrich, MO) was bath applied. AMPA receptors were blocked with DNQX (20 μM; Tocris, MO), and NMDA receptors were blocked with DL-APV (100 μM; Tocris, MO). For NMDA/AMPA ratio and spermine (0.1 mM, Sigma-Aldrich, MO) dependent IAMPA measurements, D600 (methoxyverapamil hydrochloride, 0.1 mM; Tocris, MO) was added in Cs+-based internal solution to block voltage gated calcium channel activation. Spermine containing internal solution was prepared fresh every 1~2 hours. NASPM (1-Naphthyl acetyl spermine trihydrochloride, 20 – 100 μM; Tocris, MO) was bath applied. Rectification Index (RI) was calculated by dividing peak IAMAP at +40 mV with at −40 mV from I–V curves measured using spermine-containing internal solution47.
Patch clamp recordings
Synaptic responses were recorded using an Axopatch 200B or 700A amplifier (Axon Instruments/Molecular Devices, CA), digitized using Digidata 1322A (Axon Instruments, CA) and data acquisition was performed by Clampex 9.2 (Axon Instrument, CA). For whole cell voltage clamp experiments, the series resistance (Rs) was corrected by 60 ~ 80% after cancellation of capacitive components. For synaptic plasticity experiments in which EPSC size was less than 120 pA, compensation was omitted. Calculated liquid junction potentials (Cs+ internal: 4 mV; K+ internal: 9 mV) were not compensated, except for spermine dependent I–V relationship plots (Figures 4 and 5). Series resistance (Rs) was constantly monitored throughout experiments by injecting small hyperpolarizing currents.
Synaptic Plasticity Experiments
Perforated patch clamp technique was performed using a K+-based internal solution containing Amphotericin B (Fisher Scientific, PA) (composition in mM: 115 K-Methane Sulfonate, 20 KCl, 0.2 EGTA, 10 HEPES, 4 Mg-ATP, 10 PhosphoCreatine, 0.3 Na-GTP, pH 7.3 with KOH). Note that perforated patch recordings are necessary to prevent dialysis of intracellular components required for plasticity48–50. Amphotericin B stock solution (40–60 mg/ml in DMSO) was prepared fresh every day, from which 100–200 μg/ml internal solution was prepared hourly and kept on ice. The tip of the patch electrode was filled with internal solution without Amphotericin B before back-filling with Amphotericin B containing internal solution. Following the formation of GΩ seal, gradual drop of access resistance was monitored until stabilizing at 20–120 MΩ. Trials with sudden changes in Rs (clearly discernible due to rupture of perforation or clogging of patch pipette by Amphotericin B precipitation) were discarded. EPSCs changes with stable Rs within +/−20 MΩ were used for analysis except when gradual changes in Rs were correlated with changes in EPSCs size. After obtaining a stable baseline for 10–20 min., the configuration was switched to current clamp mode and plasticity induction protocols were applied by pairing OT stimulation with post synaptic current injection for 1 sec. to generate 10~20 Hz action potentials either synchronously or with 1100 ms latency (Figure 3a–c)50. Vm (resting membrane potential measured at I=0 configuration in perforated patch clamp mode) was not different between WT (−58.5 ± 1.2 mV: N=16 cells from 16 animals), KbDb−/− (−59.6 ± 1.3 mV: N=10), KbDb−/−;NSEDb+ (−60.5 ± 1.9 mV: N=13) or KbDb−/−;NSEDb− (−62.2 ± 2.5 mV: N=7) (p > 0.1, t-test). The paring protocol was repeated 10 times over a 40 sec interval. Data were acquired with resting membrane potentials (measured at I=0) greater than −53 mV. For the NASPM LTD rescue experiments (Extended Data Figure 8), 20 μM NASPM was added to the bath, and the asynchronous pairing protocol (10 times over a 40 second interval) was repeated twice, separated by 20 minutes. N= one cell per each animal. % change is mean ± s.e.m. of EPSCs amplitudes averaged over 30 min after conditioning period as compared to baseline per cell.
Optic Tract Stimulation
Concentric bipolar (#CBABD70; FHC Inc., ME) or low-resistance glass-electrode filled with ACSF were used for stimulating electrodes without noticeable differences. Stimulus strength was regulated using an ISO-Flex, stimulus isolator (A.M.P.I., Israel) and applied at 0.025~0.033 Hz. For plasticity experiments, stimulus strength was set to achieve stable EPSCs (10~120 pA) activated by a single or a few fibers, and stimuli were applied at 0.025 Hz. To measure spermine-dependent I-V rectification, stimulation intensity was adjusted to evoke IAMPA currents in the 100~300 pA range, due to the presence of Ca2+ permeable AMPA receptor-mediated synaptic responses in KbDb−/− mice.
4. Evaluation of number of synaptic inputs
The number of connected fibers was estimated using two approaches modified from Chen and Regehr (2000)46. First, synaptic responses were recorded while varying OT stimulus intensity from minimal to maximal. Stimulation in increments of 1.0 ~ 2.5 μA was used between 0 μA and 100 μA, and larger increments (10~20 μA) were used at stimulation intensities greater than 100 μA. The stimulus-response profile provides an estimate of the number of RGC inputs to the cell. We also estimated the number of input to each LGN neuron based on the single-fiber AMPA current elicited at −70mV by minimal stimulation as a percent of the total current elicited by maximal stimulation for the same cell (Fiber fraction).
Minimal stimulation
This method is based on the assumption that minimal stimulation elicits synaptic responses from only a single fiber in the OT (SF-AMPA). After a synaptic response was observed, the intensity of electrical stimulation was lowered to obtain a failure rate higher than 50% (20~50 repeats). Synaptic responses with an onset latency of < 5 ms within a 1 ms window were regarded as direct, monosynaptic responses. The mean peak amplitudes of successful responses were taken as the strength of the single fiber synaptic response (SF-AMAP). Onset latency of SF-AMPA by minimal stimulation (estimated as time to reach 10% of peak IAMPA) was not different between WT, KbDb−/−, KbDb−/−;NSEDb- or KbDb−/−;NSEDb+ (Extended Data Figure 1c).
Maximal stimulation
Electrical stimulation was increased until the peak synaptic currents reached steady-state level (1~600 μA range).
Fiber fraction
Fiber fraction was calculated as a ratio of single-fiber synaptic strength (SF-AMPA) to maximal synaptic strength (Max-AMPA) from same cell (FF=SF/Max-AMPA per cell, %). The number of cells recorded per animal was limited to 4 for SF-AMPAs and Max-AMPA measurements.
Kinetics of EPSCs were measured as both the width at half-maximal EPSC amplitude (half-width), and decay time within 80-20% range of peak EPSCs using Clampfit.
5. Multi-electrode array recordings of retinal waves
Retinae were isolated from C57BL/6 wild type and KbDb−/− mice and pieces of retina placed retinal ganglion cell side down onto a 60-electrode multi-electrode array (MEA) arranged in an 8×8 grid (excluding the four corners) with 10 μm diameter electrodes at 100 μm spacing (Multi Channel Systems)51–53. The retina was held in place with a weighted piece of dialysis membrane and superfused continuously with artificial cerebral spinal fluid (ACSF) containing (in mM): 119.0 NaCl, 26.2 NaHCO3, 11 glucose, 2.5 KCl, 1.0 K2HPO4, 2.5 CaCl2, and 1.3 MgCl2. ACSF was oxygenated with 95% O2 and 5% CO2 and maintained at 32°C, pH 7.4. Each preparation was allowed to equilibrate for 20 minutes before data acquisition. Spontaneous firing patterns were then recorded for 60 minutes. Voltage traces on each electrode were sampled at 20 kHz and filtered between 120 and 2000 Hz. Events that crossed a spike-threshold were sorted offline to identify single units using Plexon Offline Sorter software. Single units were identified by combining principal component analysis together with a valley-seeking algorithm and were inspected manually. The mean firing rate of all units throughout the recording was calculated and units with a mean firing rate less than 10% of overall mean firing rate were excluded from further analysis. Spike-sorted data were analyzed in MATLAB (Mathworks). To identify bursts, a modified Poisson Surprise algorithm was used as described previously. Mean burst values for each retina were grouped according to age (P5–P8 and P10–P12) and genotype (WT and KbDb−/−). Differences between means of different genotypes within each age group were evaluated for statistical significance using t-test. To determine spatial properties of waves, a pair-wise correlation index, CI, was computed as a function of distance between two cells for all spikes in the recording, using a method described previously52,53. The correlation index gives a measure of the likelihood relative to chance that a pair of neurons fire together within a 100 ms time window. The distance between cells was approximated as the distance between the electrodes on which the activity of the cells was recorded. The cell pairs were grouped according to their intercellular distance, and medians were computed over all cell pairs in a given distance group for each individual retina. The median correlation indices were then averaged across retinas, for each age and genotype, and plotted as a function of intercellular distance.
6. Anterograde labeling of retinal ganglion axons and multiple threshold analysis
All methods were performed according to previously described54,55. P31–34 mice were anesthetized with isoflurane. Cholera toxin B (CTB) subunit (1~2 μl) conjugated to AF488 was injected in the right eye and CTB subunit conjugated to AF594 was injected in the left eye (1 mg/mL dissolved in 0.2% DMSO, Invitrogen, Inc. Carlsbad, CA). After 24 hours, animals were perfused and fixed by transcardial perfusion of 0.1 M phosphate buffered saline (PBS), then ice-cold 4% paraformaldehyde (PFA) in 0.1M PBS. Brains were post fixed in 4% PFA overnight. 100 μm thick sections were cut on a freezing microtome. Sections were mounted with Prolong Antifade Gold (Invitrogen, Inc. Carlsbad, CA), and after coverslipping were imaged on a Zeiss Leica PS2 confocal microscope (Leica Microsystems Inc., IL). dLGN sections taken at the middle of the rostral-caudal extent of dLGN where the area of the ipsilateral eye projection is greatest, were imaged in red and green channels. Images were acquired and analyzed such that the peak intensity values were below maximum, and multiple threshold analysis was used by varying red and green channels at intensity thresholds of 20%, 40%, 60%, 80% and 100% of maximum. To measure the amount of overlap between inputs from both eyes, pixels overlapping in both red and green channels were identified using Image J (NIH, Bethesda, MD) and the Colocalization plug-in tool. The total area of overlapping pixels was represented as a percentage of total dLGN area. Two way ANOVA was used for statistical analysis.
7. RT-PCR
RNA was prepared from tissue using RNAqueous-4PCR (Ambion, Life Technologies, NY) followed by cDNA synthesis using iScript Select cDNA synthesis kit (Bio-RAD, CA). RT-PCR was performed using 0.5~1.0 μg of template cDNA using primers as follows (Extended Data Figure 3b,c).
H2-Db:
A: 5′-CAAGAGCAGTGGTTCCGAGTGAG-3′
B: 5′-CTTGTAATGCTCTGCAGCACCACT-3′
GAPDH (used as a reference gene):
A: 5′-ATTGTCAGCAATGCATCCTGC-3′
B: 5′-AGACAACCTGGTCCTCAGTGT-3′
The quality of cDNAs was confirmed by genotyping PCR reactions using 0.5~1 μg of cDNA as template and the samples with genomic DNAs were discarded. H2-Db specific RT-PCR bands from KbDb; NSEDb+ were confirmed by sequencing following cloning into pCR2.1®-TOPO® TA vector (Life Technology Corporation, NY).
8. Taqman qPCR
RNA was extracted from each thalamus and cDNA was synthesized using iScript cDNA Synthesis Kit (Bio-Rad). Gene expression was analyzed with Taqman Gene Expression Assays (Applied Biosystems) for H2-D1/H2-K1 (Mm04208017_mH) and housekeeping gene GAPDH (glyceraldehyde-3-phosphate dehydrogenase; Mm99999915_g1). All reaction mixes contained 5% 20x Taqman Gene Expression Assay, 50% Taqman Master Mix (4304437), 25% MilliQ water, and 200ng of cDNA in 20 μl total volume per well. Experiments were carried out on a 7300 Real Time PCR system (Applied Biosystems). The relative amount of tested message was normalized to GAPDH, and efficiency corrected based on standard curves. Gene expression levels were normalized relative to C57 control, which was set to 1. All samples were run in triplicate at least three times. Analyses were carried out as previously described using one-way ANOVA56.
9. Immunoprecipitation/Western Blots of H2-Db
Brain lysates in Lysis Buffer (150 mM NaCl, 50 mM Tris, 0.25 % sodium deoxycholate, 1% NP-40, 1 mM EGTA, 1 mM PMSF, 1X Pefabloc (Roche)) were prepared by shearing ten times in a dounce homogenizer, then centrifuging at 12,000g for 10 minutes. Supernatants were precleared by incubation with Protein G-agarose beads (Invitrogen), and protein amounts were measured using a BioRad protein assay. Normalized lysates were then incubated with 12 μg anti-H2-Db antibody 28-14-8 (BD Biosciences, #553600) overnight at 4°C. Protein G-agarose was incubated with samples for 45 minutes. Beads were washed three times with lysis buffer, and then heated to 85°C for 3 minutes in NuPAGE LDS 4X Sample Buffer (Invitrogen) + 1% β-2 mercaptoethanol. Samples were then electrophoresed on an SDS-PAGE gel, transferred to Immobilon-P PVDF transfer membrane (Millipore), and Western blotted with rabbit monoclonal antibodies to H2-Db, made against the extracellular domain of H2-Db.
10. GluR1/2 expression levels
Thalami were isolated from P22 C57 or KbDb−/− mice, and synaptosome-enriched fractions prepared as described57,58. Freshly isolated individual thalami were homogenized in Homogenization buffer (10 mM HEPES pH 7.3, 0.5 mM EGTA, 33% sucrose, 4 mM Pefabloc SC PLUS (Roche), and 0.2 mM Phenylmethanesulfonyl flouride (PMSF)), and centrifuged (10 minutes at 2,000 × g). Supernatants were passed through three layers of 100μm pore nylon membranes, and then through 5μm nitrocellulose filters. Filtrates were centrifuged (10,000 × g for 10 minutes), and pellets resuspended in Homogenization buffer. Protein amounts were determined by BioRad Protein Assay (BioRad) (about 200 μg synaptosomal protein was obtained per thalamus), and SDS-PAGE sample buffer (Novex) was added to a 1X concentration. After heating (85°C for 4 minutes), equivalent amounts of protein from each sample (20 μg/sample) were electrophoresed on a SDS-PAGE gel, transferred to PVDF membrane (Bio-Rad), and Western blotted with antibodies to GluR1 (Millipore, AB1504), GluR2 (Abcam, AB133477), N-tubulin (Abcam, AB18207), or GAPDH (Abcam, AB9485).
For quantification, gels were scanned and intensities of bands were quantified using the Image J program. After quantification, intensity values for GluR1 and GluR2 were normalized by dividing them against each GAPDH or N-tubulin values from the same thalamus. Western blots typically were run with multiple wild-type and KbDb−/− samples; to compare results from different Western blots, the intensity measurement for each sample thalamus was normalized against the average value derived from all WT bands on that same blot. The GluR1/GluR2 ratio for each thalamus was then determined. Finally, an average GluR1/GluR2 ratio was calculated from each individual thalami (Extended Data Figure 7e).
Mouse cortical cultures were made as described by Viesselmann et al (2011)59. Wild-type or KbDb−/− cortical neurons were isolated at E16.5, and cultured on 6 cm tissue culture plates for 14 days in vitro (DIV). Plates were then washed twice with phosphate buffered saline (PBS) and cells were lysed directly on the plates with lysis buffer (150 mM NaCl, 50 mM Tris-HCl pH 7.5, 0.25 % sodium deoxycholate, 1% NP-40, 1 mM EGTA, 1 mM PMSF, 1X Pefabloc SC PLUS (Roche)) for 10 minutes. Lysates were then centrifuged at 12,000 × g for 10 minutes. Supernatants were normalized by BioRad Protein Assay (BioRad), and equivalent amounts of protein from each sample (25 μg/sample) was subjected to SDS-PAGE and Western blotting with antibodies to GluR1, GluR2, GAPDH, and/or N-tubulin, as described above. Gels were scanned and bands quantified using Image J. Values were then normalized by dividing them by GAPDH or N-tubulin values, and an average GluR1/GluR2 ratio was calculated from each individual sample (Extended Data Figure 7f). Non-parametric Mann-Whitney U-test (Prism software) was used to calculate P values for all analyses (two-tailed).
11. Data Analysis and statistics for electrophysiology experiments
Data analysis as well as graph plotting were done using Clampfit 10.2 (Axon Instruments, CA) and the OriginPro8.0 (OriginLab Corporation, MA). Cages containing mice of different genotypes used for each experiment were relabeled and randomized so that experimenter did not know genotype. Experiments were then analyzed blind to genotype unless stated in figure legends. In addition, Student t-test was used for data with normal distribution and Mann-Whitney test for data with non-normal distribution. Shapiro-Wilk test was conducted for Normality test. N= number of animal; n=number of cells. Average data is presented as mean ± s.e.m., unless stated otherwise. For synaptic plasticity experiments, t-test was used. Two-tailed analysis were used throughout the study.
Acknowledgments
We thank members of the Shatz lab for helpful comments. For technical assistance, thanks to N. Sotelo-Kury, C. Chechelski and P. Kemper. For training in retinogeniculate slice methods, we thank Drs Chinfei Chen (Children’s Hospital; Harvard Medical School), Patrick Kanold (U. Maryland) and Dan Butts (U. Maryland). This work was supported by NIH Grants R01 MH071666 and EY02858, and the G. Harold and Leila Y. Mathers Charitable Foundation (Carla J Shatz), and NIH Grant RO1 EY13528 (Marla B Feller) and NSF Predoctoral Fellowship (Lowry Kirkby).
Footnotes
Author Contributions
Lee H. and Shatz C.J. designed all experiments, analyzed and reviewed all results and wrote manuscript. Data contributions are as follows: Electrophysiology experiment by Lee H., MEA experiments by Kirkby L. and Feller M.B.. Brott B. designed H2-Db monoclonal antibody and performed western blots. Lee H. designed and performed RT-PCR experiments. Datwani A. performed RGC neuronal tract tracing experiments and analysis. Adelson JD and Cheng S performed Taqman qPCR.
Reprints and permissions information is available at www.Nature.com/reprints
Competing financial interests:
The authors declare no competing finantial interests.
References
- 1.Meister M, Wong RO, Baylor DA, Shatz CJ. Synchronous bursts of action potentials in ganglion cells of the developing mammalian retina. Science. 1991;252:939–943. doi: 10.1126/science.2035024. [DOI] [PubMed] [Google Scholar]
- 2.Feller MB, Wellis DP, Stellwagen D, Werblin FS, Shatz CJ. Requirement for cholinergic synaptic transmission in the propagation of spontaneous retinal waves. Science. 1996;272:1182–1187. doi: 10.1126/science.272.5265.1182. [DOI] [PubMed] [Google Scholar]
- 3.Wong RO, Meister M, Shatz CJ. Transient period of correlated bursting activity during development of the mammalian retina. Neuron. 1993;11:923–938. doi: 10.1016/0896-6273(93)90122-8. [DOI] [PubMed] [Google Scholar]
- 4.Mooney R, Penn AA, Gallego R, Shatz CJ. Thalamic relay of spontaneous retinal activity prior to vision. Neuron. 1996;17:863–874. doi: 10.1016/s0896-6273(00)80218-4. [DOI] [PubMed] [Google Scholar]
- 5.Weliky M, Katz LC. Correlational structure of spontaneous neuronal activity in the developing lateral geniculate nucleus in vivo. Science. 1999;285:599–604. doi: 10.1126/science.285.5427.599. [DOI] [PubMed] [Google Scholar]
- 6.Ackman JB, Burbridge TJ, Crair MC. Retinal waves coordinate patterned activity throughout the developing visual system. Nature. 2012;490:219–225. doi: 10.1038/nature11529. [DOI] [PMC free article] [PubMed] [Google Scholar]
- 7.Penn AA, Riquelme PA, Feller MB, Shatz CJ. Competition in retinogeniculate patterning driven by spontaneous activity. Science. 1998;279:2108–2112. doi: 10.1126/science.279.5359.2108. [DOI] [PubMed] [Google Scholar]
- 8.Huberman AD, Feller MB, Chapman B. Mechanisms underlying development of visual maps and receptive fields. Annu Rev Neurosci. 2008;31:479–509. doi: 10.1146/annurev.neuro.31.060407.125533. [DOI] [PMC free article] [PubMed] [Google Scholar]
- 9.Stevens B, et al. The classical complement cascade mediates CNS synapse elimination. Cell. 2007;131:1164–1178. doi: 10.1016/j.cell.2007.10.036. [DOI] [PubMed] [Google Scholar]
- 10.Huh GS, et al. Functional requirement for class I MHC in CNS development and plasticity. Science. 2000;290:2155–2159. doi: 10.1126/science.290.5499.2155. [DOI] [PMC free article] [PubMed] [Google Scholar]
- 11.Bjartmar L, et al. Neuronal pentraxins mediate synaptic refinement in the developing visual system. J Neurosci. 2006;26:6269–6281. doi: 10.1523/JNEUROSCI.4212-05.2006. [DOI] [PMC free article] [PubMed] [Google Scholar]
- 12.Corriveau RA, Huh GS, Shatz CJ. Regulation of class I MHC gene expression in the developing and mature CNS by neural activity. Neuron. 1998;21:505–520. doi: 10.1016/s0896-6273(00)80562-0. [DOI] [PubMed] [Google Scholar]
- 13.Glynn MW, et al. MHCI negatively regulates synapse density during the establishment of cortical connections. Nat Neurosci. 2011;14:442–451. doi: 10.1038/nn.2764. [DOI] [PMC free article] [PubMed] [Google Scholar]
- 14.Datwani A, et al. Classical MHCI molecules regulate retinogeniculate refinement and limit ocular dominance plasticity. Neuron. 2009;64:463–470. doi: 10.1016/j.neuron.2009.10.015. [DOI] [PMC free article] [PubMed] [Google Scholar]
- 15.Chen C, Regehr WG. Developmental remodeling of the retinogeniculate synapse. Neuron. 2000;28:955–966. doi: 10.1016/s0896-6273(00)00166-5. [DOI] [PubMed] [Google Scholar]
- 16.Hooks BM, Chen C. Distinct roles for spontaneous and visual activity in remodeling of the retinogeniculate synapse. Neuron. 2006;52:281–291. doi: 10.1016/j.neuron.2006.07.007. [DOI] [PubMed] [Google Scholar]
- 17.Stevens CF, Wang Y. Changes in reliability of synaptic function as a mechanism for plasticity. Nature. 1994;371:704–707. doi: 10.1038/371704a0. [DOI] [PubMed] [Google Scholar]
- 18.Torborg CL, Hansen KA, Feller MB. High frequency, synchronized bursting drives eye-specific segregation of retinogeniculate projections. Nat Neurosci. 2005;8:72–78. doi: 10.1038/nn1376. [DOI] [PMC free article] [PubMed] [Google Scholar]
- 19.Vugmeyster Y, et al. Major histocompatibility complex (MHC) class I KbDb −/− deficient mice possess functional CD8+ T cells and natural killer cells. Proc Natl Acad Sci U S A. 1998;95:12492–12497. doi: 10.1073/pnas.95.21.12492. [DOI] [PMC free article] [PubMed] [Google Scholar]
- 20.Rall GF, Mucke L, Oldstone MB. Consequences of cytotoxic T lymphocyte interaction with major histocompatibility complex class I-expressing neurons in vivo. J Exp Med. 1995;182:1201–1212. doi: 10.1084/jem.182.5.1201. [DOI] [PMC free article] [PubMed] [Google Scholar]
- 21.Shatz CJ, Kirkwood PA. Prenatal development of functional connections in the cat’s retinogeniculate pathway. J Neurosci. 1984;4:1378–1397. doi: 10.1523/JNEUROSCI.04-05-01378.1984. [DOI] [PMC free article] [PubMed] [Google Scholar]
- 22.Shatz CJ. Emergence of order in visual system development. Proc Natl Acad Sci U S A. 1996;93:602–608. doi: 10.1073/pnas.93.2.602. [DOI] [PMC free article] [PubMed] [Google Scholar]
- 23.Torborg CL, Feller MB. Unbiased analysis of bulk axonal segregation patterns. J Neurosci Methods. 2004;135:17–26. doi: 10.1016/j.jneumeth.2003.11.019. [DOI] [PubMed] [Google Scholar]
- 24.Zhou Q, Homma KJ, Poo MM. Shrinkage of dendritic spines associated with long-term depression of hippocampal synapses. Neuron. 2004;44:749–757. doi: 10.1016/j.neuron.2004.11.011. [DOI] [PubMed] [Google Scholar]
- 25.Bastrikova N, Gardner GA, Reece JM, Jeromin A, Dudek SM. Synapse elimination accompanies functional plasticity in hippocampal neurons. Proc Natl Acad Sci U S A. 2008;105:3123–3127. doi: 10.1073/pnas.0800027105. [DOI] [PMC free article] [PubMed] [Google Scholar]
- 26.Malenka RC, Bear MF. LTP and LTD: an embarrassment of riches. Neuron. 2004;44:5–21. doi: 10.1016/j.neuron.2004.09.012. [DOI] [PubMed] [Google Scholar]
- 27.Yuste R, Bonhoeffer T. Morphological changes in dendritic spines associated with long-term synaptic plasticity. Annual review of neuroscience. 2001;24:1071–1089. doi: 10.1146/annurev.neuro.24.1.1071. [DOI] [PubMed] [Google Scholar]
- 28.Mu Y, Poo MM. Spike timing-dependent LTP/LTD mediates visual experience-dependent plasticity in a developing retinotectal system. Neuron. 2006;50:115–125. doi: 10.1016/j.neuron.2006.03.009. [DOI] [PubMed] [Google Scholar]
- 29.Mooney R, Madison DV, Shatz CJ. Enhancement of transmission at the developing retinogeniculate synapse. Neuron. 1993;10:815–825. doi: 10.1016/0896-6273(93)90198-z. [DOI] [PubMed] [Google Scholar]
- 30.Ziburkus J, Dilger EK, Lo FS, Guido W. LTD and LTP at the developing retinogeniculate synapse. J Neurophysiol. 2009;102:3082–3090. doi: 10.1152/jn.90618.2008. [DOI] [PMC free article] [PubMed] [Google Scholar]
- 31.Butts DA, Kanold PO, Shatz CJ. A burst-based “Hebbian” learning rule at retinogeniculate synapses links retinal waves to activity-dependent refinement. PLoS Biol. 2007;5:e61. doi: 10.1371/journal.pbio.0050061. [DOI] [PMC free article] [PubMed] [Google Scholar]
- 32.Shah RD, Crair MC. Retinocollicular synapse maturation and plasticity are regulated by correlated retinal waves. J Neurosci. 2008;28:292–303. doi: 10.1523/JNEUROSCI.4276-07.2008. [DOI] [PMC free article] [PubMed] [Google Scholar]
- 33.Zhang J, Ackman JB, Xu HP, Crair MC. Visual map development depends on the temporal pattern of binocular activity in mice. Nat Neurosci. 2011;15:298–307. doi: 10.1038/nn.3007. [DOI] [PMC free article] [PubMed] [Google Scholar]
- 34.Liu SQ, Cull-Candy SG. Synaptic activity at calcium-permeable AMPA receptors induces a switch in receptor subtype. Nature. 2000;405:454–458. doi: 10.1038/35013064. [DOI] [PubMed] [Google Scholar]
- 35.Cull-Candy S, Kelly L, Farrant M. Regulation of Ca2+-permeable AMPA receptors: synaptic plasticity and beyond. Curr Opin Neurobiol. 2006;16:288–297. doi: 10.1016/j.conb.2006.05.012. [DOI] [PubMed] [Google Scholar]
- 36.Isaac JT, Ashby MC, McBain CJ. The role of the GluR2 subunit in AMPA receptor function and synaptic plasticity. Neuron. 2007;54:859–871. doi: 10.1016/j.neuron.2007.06.001. [DOI] [PubMed] [Google Scholar]
- 37.Goel A, et al. Cross-modal regulation of synaptic AMPA receptors in primary sensory cortices by visual experience. Nat Neurosci. 2006;9:1001–1003. doi: 10.1038/nn1725. [DOI] [PMC free article] [PubMed] [Google Scholar]
- 38.Hohnke CD, Oray S, Sur M. Activity-dependent patterning of retinogeniculate axons proceeds with a constant contribution from AMPA and NMDA receptors. J Neurosci. 2000;20:8051–8060. doi: 10.1523/JNEUROSCI.20-21-08051.2000. [DOI] [PMC free article] [PubMed] [Google Scholar]
- 39.Jia Z, et al. Enhanced LTP in mice deficient in the AMPA receptor GluR2. Neuron. 1996;17:945–956. doi: 10.1016/s0896-6273(00)80225-1. [DOI] [PubMed] [Google Scholar]
- 40.Toyoda H, et al. Long-term depression requires postsynaptic AMPA GluR2 receptor in adult mouse cingulate cortex. J Cell Physiol. 2007;211:336–343. doi: 10.1002/jcp.20940. [DOI] [PubMed] [Google Scholar]
- 41.Needleman LA, Liu XB, El-Sabeawy F, Jones EG, McAllister AK. MHC class I molecules are present both pre- and postsynaptically in the visual cortex during postnatal development and in adulthood. Proc Natl Acad Sci U S A. 2010;107:16999–17004. doi: 10.1073/pnas.1006087107. [DOI] [PMC free article] [PubMed] [Google Scholar]
- 42.Stefansson H, et al. Common variants conferring risk of schizophrenia. Nature. 2009;460:744–747. doi: 10.1038/nature08186. [DOI] [PMC free article] [PubMed] [Google Scholar]
- 43.Ripke S, et al. Genome-wide association analysis identifies 13 new risk loci for schizophrenia. Nature genetics. 2013;45:1150–1159. doi: 10.1038/ng.2742. [DOI] [PMC free article] [PubMed] [Google Scholar]
- 44.Rall GF, Mucke L, Oldstone MB. Consequences of cytotoxic T lymphocyte interaction with major histocompatibility complex class I-expressing neurons in vivo. J Exp Med. 1995;182:1201–1212. doi: 10.1084/jem.182.5.1201. [DOI] [PMC free article] [PubMed] [Google Scholar]
- 45.Turner JP, Salt TE. Characterization of sensory and corticothalamic excitatory inputs to rat thalamocortical neurones in vitro. J Physiol. 1998;510 ( Pt 3):829–843. doi: 10.1111/j.1469-7793.1998.829bj.x. [DOI] [PMC free article] [PubMed] [Google Scholar]
- 46.Chen C, Regehr WG. Developmental remodeling of the retinogeniculate synapse. Neuron. 2000;28:955–966. doi: 10.1016/s0896-6273(00)00166-5. [DOI] [PubMed] [Google Scholar]
- 47.Liu SQ, Cull-Candy SG. Synaptic activity at calcium-permeable AMPA receptors induces a switch in receptor subtype. Nature. 2000;405:454–458. doi: 10.1038/35013064. [DOI] [PubMed] [Google Scholar]
- 48.Mooney R, Madison DV, Shatz CJ. Enhancement of transmission at the developing retinogeniculate synapse. Neuron. 1993;10:815–825. doi: 10.1016/0896-6273(93)90198-z. [DOI] [PubMed] [Google Scholar]
- 49.Rae J, Cooper K, Gates P, Watsky M. Low access resistance perforated patch recordings using amphotericin B. J Neurosci Methods. 1991;37:15–26. doi: 10.1016/0165-0270(91)90017-t. [DOI] [PubMed] [Google Scholar]
- 50.Butts DA, Kanold PO, Shatz CJ. A burst-based “Hebbian” learning rule at retinogeniculate synapses links retinal waves to activity-dependent refinement. PLoS Biol. 2007;5:e61. doi: 10.1371/journal.pbio.0050061. [DOI] [PMC free article] [PubMed] [Google Scholar]
- 51.Meister M, Wong RO, Baylor DA, Shatz CJ. Synchronous bursts of action potentials in ganglion cells of the developing mammalian retina. Science. 1991;252:939–943. doi: 10.1126/science.2035024. [DOI] [PubMed] [Google Scholar]
- 52.Torborg CL, Hansen KA, Feller MB. High frequency, synchronized bursting drives eye-specific segregation of retinogeniculate projections. Nat Neurosci. 2005;8:72–78. doi: 10.1038/nn1376. [DOI] [PMC free article] [PubMed] [Google Scholar]
- 53.Wong RO, Meister M, Shatz CJ. Transient period of correlated bursting activity during development of the mammalian retina. Neuron. 1993;11:923–938. doi: 10.1016/0896-6273(93)90122-8. [DOI] [PubMed] [Google Scholar]
- 54.Torborg CL, Feller MB. Unbiased analysis of bulk axonal segregation patterns. J Neurosci Methods. 2004;135:17–26. doi: 10.1016/j.jneumeth.2003.11.019. [DOI] [PubMed] [Google Scholar]
- 55.Datwani A, et al. Classical MHCI molecules regulate retinogeniculate refinement and limit ocular dominance plasticity. Neuron. 2009;64:463–470. doi: 10.1016/j.neuron.2009.10.015. [DOI] [PMC free article] [PubMed] [Google Scholar]
- 56.Adelson JD, et al. Neuroprotection from stroke in the absence of MHCI or PirB. Neuron. 2012;73:1100–1107. doi: 10.1016/j.neuron.2012.01.020. [DOI] [PMC free article] [PubMed] [Google Scholar]
- 57.Johnson MW, Chotiner JK, Watson JB. Isolation and characterization of synaptoneurosomes from single rat hippocampal slices. Journal of neuroscience methods. 1997;77:151–156. doi: 10.1016/s0165-0270(97)00120-9. [DOI] [PubMed] [Google Scholar]
- 58.Yin Y, Edelman GM, Vanderklish PW. The brain-derived neurotrophic factor enhances synthesis of Arc in synaptoneurosomes. Proceedings of the National Academy of Sciences of the United States of America. 2002;99:2368–2373. doi: 10.1073/pnas.042693699. [DOI] [PMC free article] [PubMed] [Google Scholar]
- 59.Viesselmann C, Ballweg J, Lumbard D, Dent EW. Nucleofection and primary culture of embryonic mouse hippocampal and cortical neurons. J Vis Exp. 2011 doi: 10.3791/2373. [DOI] [PMC free article] [PubMed] [Google Scholar]