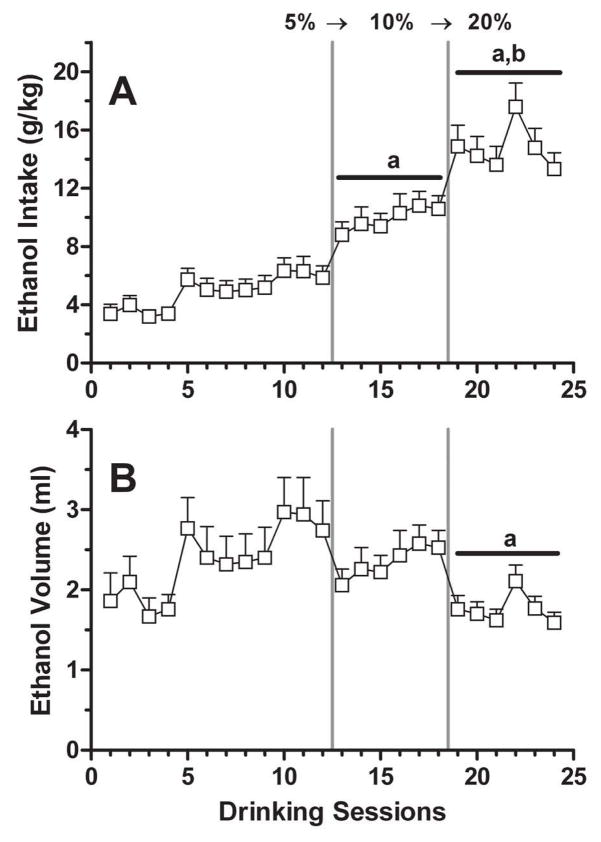
Figure 3. Relationship between ethanol concentration and intake.
Each data point represents the mean ± SEM of g/kg intake (panel A) or ethanol volume (panel B) consumed by n = 8 male C57BL/6 mice during each 16-h session. The vertical gray lines signify transitions in the ethanol concentration provided (5→10→20% v/v). For analysis, the average of the final six sessions with 5% ethanol was compared to the six-session means with 10% and 20% ethanol. ap < 0.01 versus 5% ethanol; bp < 0.01 versus 10% ethanol. See text for additional experimental details.

