

Abstract
The purpose of this study is to identify white matter microstructure changes following bilateral upper extremity motor skill training to increase our understanding of learning-induced structural plasticity and enhance clinical strategies in physical rehabilitation. Eleven healthy subjects performed two visuo-spatial motor training tasks over 9 sessions (2–3 sessions per week). Subjects controlled a cursor with bilateral simultaneous movements of the shoulders and upper arms using a body machine interface. Before the start and within 2 days of the completion of training, whole brain diffusion tensor MR imaging data were acquired. Motor training increased fractional anisotropy (FA) values in the posterior and anterior limbs of the internal capsule, the corona radiata, and the body of the corpus callosum by 4.19% on average indicating white matter microstructure changes induced by activity-dependent modulation of axon number, axon diameter, or myelin thickness. These changes may underlie the functional reorganization associated with motor skill learning.
Keywords: motor skill learning, diffusion tensor imaging, fractional anisotropy, white matter plasticity
Introduction
Performing complex motor skills is a fundamental component of ordinary human life. The ability to learn and modify motor skills is a requisite for adapting to an ever-changing environment (Davidson and Wolpert, 2003). Through practice, new motor skills are acquired and existing ones are continuously refined. Motor skill learning (acquisition, retention, and refinement of motor skills) relies on the capability of the nervous system to create new patterns of neural activation for accomplishing new tasks or for recovering motor functions lost to disability (Kantak and Winstein, 2012). This reorganization is a continuous process throughout life as the nervous system recruits the necessary neural components to optimize task performance and meet environmental demands.
Most models of learning have been developed around the Hebbian theory of plasticity (Dudai, 1989; Hebb, 1949). For healthy adults, the overall brain structure was seen as rather static and inert, and historically, the significance of learning induced-plastic changes at the structural level had been mostly disregarded (Fields, 2011). Recent advances in neural imaging have made in vivo characterization of the nervous system microstructure possible. Information gained from these technologies has advanced our understanding of the relationship between brain structure and learning, and recent studies have begun demonstrating that the brain at the structural level is a much more dynamic organ than we were previously aware.
Learning-induced structural changes of cortical and subcortical areas have been reported to occur in both gray and white matter. Using voxel-based morphometry, cross-sectional studies have identified regional differentiation of gray matter volume between expert and non-expert musicians (Bermudez and Zatorre, 2005; Gaser and Schlaug, 2003; Han et al., 2009), golfers (Jancke et al., 2009), and basketball players (Park et al., 2009). Additionally, the magnitude of these gray matter changes has further been shown to correlate with experience (e.g., years spent typing for professional typists) (Cannonieri et al., 2007; Maguire et al., 2000). Longitudinal studies have further strengthened the link between structural plasticity and learning (Boyke et al., 2008; Draganski et al., 2004; Driemeyer et al., 2008; Scholz et al., 2009; Taubert et al., 2010). Following 3 months of practicing a motor task (juggling), Draganski and coworkers demonstrated transient increases in gray matter volume in regions associated with visual motion processing (Draganski et al., 2004). Strikingly, Driemeyer and coworkers have reported structural changes after only 7 days of juggling practice (Driemeyer et al., 2008). Paralleling the changes seen in gray matter, several studies (Bengtsson et al., 2005; Han et al., 2009) have demonstrated regional differentiation of white matter tracts by using diffusion tensor imaging (DTI). DTI non-invasively measures the direction and rate of water diffusion within tissue. Water restricted by white matter fibers results in anisotropic diffusion along the axon. The common measure of diffusion anisotropy used in DTI studies is a normalized measure of the variance of the diffusion ellipsoid at each voxel called fractional anisotropy (FA) (Basser and Pierpaoli, 1996). The physiological parameters that affect the FA value include axon number, axon diameter, and myelin thickness of the white matter tissue (Beaulieu, 2009). DTI studies investigating motor skill learning-induced structural changes in white matter have employed juggling (Scholz et al., 2009) and balance (Taubert et al., 2010) tasks.
Here, we investigate learning-induced changes in brain connectivity following training with a body machine interface (BMI), where subjects learn to use the movement of their shoulders and upper arms to control a cursor on a computer screen to solve different tasks. The purpose of this study is to identify white matter changes by comparing FA values pre and post bilateral upper extremity motor skill training in healthy subjects. This will lead to a greater understanding of learning-induced structural plasticity and, specifically, the neural substrates responsible for the reorganization of residual motor ability. This information will potentially aid in enhancing clinical strategies in physical rehabilitation and facilitate the learning processes related to assistive devices used in impaired subjects.
Methods
Subjects
Eleven healthy, right-handed volunteers (mean age, 26 years; range: 22–35 years; 2 females), with no known history of motor impairment participated in this study, after obtaining written informed consent approved by the local ethics committee. Exclusion criteria were: professional musicians for potentially bilateral increased use of upper extremities and smokers for possible brain structure and functional changes induced by nicotine administration and addiction (Lee et al., 2013). One subject played the violin non-professionally. All subjects were naive to the experimental setup.
Body Machine Interface
Body Machine Interfaces (BMI) translate signals derived from body motions into commands for external devices (see (Casadio et al., 2012) for a review). Subjects controlled a computer cursor with bilateral simultaneous movements of the shoulders and upper arms. The body signals were recorded non-invasively with four infrared video cameras (V100, Naturalpoint Inc., OR, USA) that tracked four small, low cost, active infrared markers (two on the shoulders and the other two on the upper arms), and converted into the two coordinates of the cursor in real-time with a custom software package (Modification of a C++ Software Development Kit supplied by Naturalpoint). This was a many-to-one map where each cursor location corresponded to an entire range of body configurations. Shoulder and upper arm positions were captured at 75 samples per second and the cursor position was displayed in real time on a LCD computer screen (OpenGL software) with visual feedback rate of 60Hz.
This BMI seeks a low-dimensional subspace of control signals within a higher dimensional space of upper body movements that remain available to the tetraplegic users of powered wheelchairs. Briefly, this BMI is based on:
Capturing upper body motions using four infrared cameras to track four active infrared sources attached to the subject’s upper-body garments (Figure 1). These sensors acquired eight signals (two for each camera).
Extracting the structure of movement variance in the space of body motion signals with principal component analysis (Jolliffe, 2002).
Establishing a linear correspondence from the sub-space of maximal mobility (SSMM) to the space of control signals. The SSMM is defined by the two highest principal eigenvectors of the body signals capturing the highest amount of motion.
Converting to a cursor control signal with real-time feedback.
Figure 1.
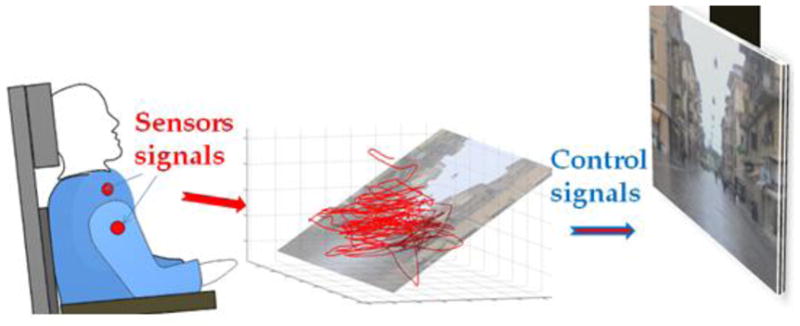
Brain Machine Interface concept. The subject’s movements are detected by sensors placed on the upper body (red dots). As the subject engages in spontaneous movements, the sensor signals define a point moving in a high dimensional space (here represented in 3D). The calibration procedure establishes a correspondence between the plane that captures the highest amount of signal variance with the plane of the display, where the sensor signals are represented as a moving cursor.
At the beginning of each training session, subjects calibrated the interface by performing self-selected free upper body motions. The map between the body and the control space of the cursor was defined during this calibration phase and remained calibrated within each session. To establish the body/cursor map, the interface allowed subjects to choose the movements that they preferred or found easier to perform. Although it is possible to move the cursor with the movement of only one shoulder, no specific instructions were given on how to control the cursor. The body movements were highly symmetric and they all chose the same strategy to move the cursor:
forward - both shoulders moved forward and/or up;
backward - both shoulders moved backward;
right - the right shoulder moved backward the left shoulder moved forward;
left - the right shoulder moved forward and the left shoulder moved backward.
Training
Subjects performed visuo-spatial motor training tasks over 9 sessions: 2 to 3 sessions per week for a total of 3 to 4 weeks of training. Each session lasted about 1 hour (from a minimum of 50 minutes to a maximum of 60 minutes). Each training session contained four tasks (i) reaching test, where subjects performed 30 center-out movements (ii) 10 minutes of driving a wheelchair in a virtual environment, (iii) 25–35 minutes playing a Tetris-like game and (iv) a repeat of the reaching test in the first step. The training time for Tetris varied between 25 and 35 min to maintain the total amount of practice with the BMI constant across sessions and subjects. Therefore the Tetris training time depended on the duration of both the reaching task and the calibration procedures. The Tetris time was shorter in the early sessions and became longer during the later training sessions.
At the beginning and the end of each session, the subject’s performance was tested in a reaching task where subjects controlled the cursor in a continuous space. Starting from the same central position, subjects moved the cursor toward one out of six possible peripheral locations presented in random order and equi-spaced over a circle with five centimeters radius. No visual feedback was provided for the first 0.4 seconds after the cursor left the initial position in two randomly selected trials per direction. To quantify skill learning, accuracy (reaching error), smoothness (jerk index), and duration of the movements were computed as follows: (1) Accuracy (reaching error), i.e., the distance between the cursor and the target, after 0.4 s, with and without visual feedback. A smaller error indicated improved performance, i.e., subjects moved faster and/or aimed better at the target. (2) Smoothness (jerk index), the third derivative of cursor position normalized with respect to the duration and the path length of the trajectory according to Teulings et al. (Teulings et al., 1997). A smaller jerk index means more smooth movements. (3) Movement duration: the time elapsed between the beginning and the end of the movement. As the threshold for detecting the movement, we considered the 10% of the peak speed. A shorter duration means faster speed.
When playing Tetris, subjects activated a virtual keyboard by moving from a central key to four surrounding keys, left, right, top and bottom to manipulate different shapes of falling objects. Completing a horizontal line of ten blocks without gaps caused the row of blocks to disappear, thus clearing the shaft. When subjects improved their performance, the game entered a more challenging level where the shapes fall at a faster rate. The game failed when the stack of pieces reached the top of the shaft and new pieces were unable to enter. Subjects repeated the game until the time limit allocated for Tetris (see above) was reached. The average rows cleared per minute was recorded for each session.
For the task of driving in a simulated environment, subjects controlled a virtual wheelchair over paths with increasing difficulty. The virtual environment for wheelchair navigation has a visual feedback rate of 30 Hz (Wheelchair Net Software 2.1, Oregon Research Institute). The vehicle can either advance or back-up along a line perpendicular to the screen or can turn, both clockwise and counterclockwise. Therefore the virtual wheelchair was operated by two commands specifying: a forward/backward linear speed v and a right/left turning speed ω. Average driving speed was recorded during 10 minute driving sessions.
Statistical analysis
The Wilcoxon signed-rank test was performed to evaluate the effect of training on motor skill performance. We compared the performance of the first and last sessions in terms of accuracy (reaching error), smoothness (jerk index), and speed (duration) of the movements in the reaching tasks, rows cleared per minute in the Tetris game; and average driving speed of the wheelchair in the simulated environment. The significance level was set to p=0.05.
MRI Data Acquisition
MR imaging data were collected within one week prior to the start of training (two 10 min DTI sessions) and within 2 days of completion of training (one 10 min DTI session). Pre-training (baseline) image collection consisted of two DTI sessions where subjects were asked to leave after the first DTI session and re-enter the scanner after 30 min for the second DTI session. These two pre-training sessions serve as within subject control and were compared with each other to test the reliability of DTI at baseline, then concatenated into one long session to optimize the diffusion tensor estimation before comparing with post training to investigate training effect (Jung et al., 2010; Monnig et al., 2013).
MR imaging data were collected using a 3.0 Tesla Siemens Tim Trio MR scanner with a 32-channel head coil and B17 software. Whole brain diffusion tensor imaging data (60 directions, TR/TE=9000/83ms, 2×2×2 mm, 72 slices, b value=1000 s/mm2, in-plane matrix resolution, 112 × 130, flip angel=90°, GRAPPA with acceleration factor of 2) plus 8 images with no diffusion b=0 s/mm2 interleaved throughout the acquisition starting at the beginning of the sequence and after each block of 10 diffusion weighted images were acquired.
Diffusion Data Analysis
FA, MD, AD, RD estimation
All analyses were conducted with FSL Diffusion Toolbox (FDT) (version 4.1.7, www.fmrib.ox.ac.uk/fsl, FMRIB, Oxford, UK) (Jenkinson et al., 2012). DTI data were motion and eddy current corrected before the diffusion tensor was calculated for each voxel. Fractional anisotropy (FA) maps were derived based on the 3 eigenvalues (λ1, λ2 and λ3) of each tensor, i.e. . Mean Diffusivity (MD) maps were derived as the average of the 3 eigenvalues, i.e. . Axial Diffusivity (diffusion along the principle diffusion directions) is the eigenvalue of the principle diffusion direction, i.e. λ1. Radial Diffusivity (diffusion perpendicular to the principle diffusion directions) maps were derived as the mean of the other 2 eigenvalues, i.e. .
Tract-based spatial statistics (TBSS)
To localize brain changes, voxelwise statistical analysis of the FA data was carried out using TBSS (Tract-Based Spatial Statistics, see (Smith et al., 2006) for full details). First using the 1mm isotropic FA standard-space template (FMRIB58_FA) as a target, all FA data were aligned into a common standard space using the nonlinear registration tool FNIRT (Andersson et al., 2007a, b). Next, the mean FA image across all subjects and all time points was created and thinned to create a mean FA skeleton (thresholded at 0.2), which represents the centers of all tracts common to the group. Each subject’s aligned FA data were then projected onto this skeleton and the resulting data were fed into voxel-wise cross-subject statistical analysis. A two sample paired t-test was used to compare between pre and post training, i.e. design matrix contained one regressor for differences between pre and post training, and 11 additional regressors for individual subject means. Two t-contrasts (pre < post training and pre > post training) were estimated. Similarly a two sample paired t-test was used to compare two baseline sessions (baseline 1> 2 and baseline 1<2 were estimated.). 5000 permutations were run to test for statistical significance using the ‘randomise’ command in FSL as described by Smith et al. (Smith et al., 2006). The statistical maps were corrected for multiple comparisons (PFWE < 0.025, multiple comparison corrected for two contrasts: pre- < post- training and pre- > post- training) using threshold-free cluster enhancement (TFCE). Significant clusters from the analysis were separately masked and anatomically identified using the JHU ICBM-DTI-81 white-matter atlas in FSL (Hua et al., 2008).
Region of interest (ROI) analysis
Four major clusters (contains more than 200 voxels) that showed learning induced changes were identified on the FA skeleton based on TBSS results. Detailed analyses within these four clusters were performed to confirm and help interpret the findings from TBSS. (1) The mean FA values within four major clusters for skeletonized FA maps for baseline 1, baseline 2, the two baselines concatenated, and post training were extracted. (2) To better understand the changes in FA, the mean MD, AD, and RD within each of the four major ROIs were calculated for each subject. The average change post training relative to baseline was calculated at the group level. (3) Four major clusters were de-projected onto each individual subject’s native-space FA map for each scanning session. This allowed us to confirm that the voxels showing significant effects were indeed located within the white matter in each individual by visual inspection (individual results not shown).
Tractography
We used tractography to better understand the spatial location and connectivity of the white matter fibers identified by the four ROIs. To identify white matter tracts associated with changes in FA, the major four clusters showing significant learning induced differences on the skeleton were de-projected to each individual’s native space and probabilistic tractography was performed with the native ROI clusters acting as the seed masks (Behrens et al., 2007) using Bedpostx and probtracx commands in FSL. Briefly, bedpostx runs Markov Chain Monte Carlo sampling to build up distributions on principal diffusion directions at each brain voxel, which allows modeling of crossing fibers. Probtracx then repetitively samples from the distributions of voxel-wise principal diffusion directions, each time computing a streamline through these local samples to generate a probabilistic streamline or a sample from the distribution at the location of the true streamline. By taking many such samples, the posterior distribution on the streamline location or the connectivity distribution was determined. All brain voxels will have a value representing the connectivity value between that voxel and the seed voxel (i.e., the number of samples that pass through that voxel). Pathways in individual subjects were thresholded to include only voxels that had 10% of maximum value (Zarei et al., 2007), binarized, transformed to standard MNI space, and then overlaid to produce population probability maps for each pathway reflecting the proportion of the population in which a tract was present.
FA correlation with motor performance
We calculated the correlation with FA change and motor performance gain. In the major four clusters that showed significant differences for learning, an average FA change (post minus pre) for each individual within all four major clusters was calculated and correlated with their behavior motor performance gain (i.e. performance improvement from final session compared to initial session of training) using spearman rank correlation. The motor performance indicators include speed (duration), smoothness (jerk index), and accuracy (reaching error) of the movement from the reaching test; the average lines cleared rows per minute from the Tetris game; and average driving speed of the virtual wheelchair. The three parameters from reaching test were averaged across all movements (with and without visual feedback) in each session. False discovery rate (FDR) correction was used to correct for multiple comparisons.
Results
Motor Performance
Subjects improved their performance with training and the improvement was evident in all tasks. As shown in Figure 2, in the Tetris game the average rows cleared per minute increased from 1.4±0.14 at baseline (session 1) to 4.8±0.29 (mean±SE) at the end of the training (session 9) (p<0.001). The average driving speed of the virtual wheelchair measured during navigation under the same environment increased from a baseline speed of 3.7±0.15 to 4.1±0.09 miles per hour during the final phase of training (p=0.005). In the reaching test (Figure 2), the movements became smoother, faster, and more accurate with practice (ps< 0.001) for both trials with (red) and without (black) visual feedback (see Methods). Since the degree of changes from learning across the training sessions were not significantly different for trials with and without visual feedback (ps >0.05), the performance gain used in the correlation analysis with FA was computed from all trials.
Figure 2.

Performance improvements across different tasks. Top-left panel: Tetris score, the average rows cleared per minute for each session (mean±SE). Reaching task: reaching error, total duration, and jerk index for both trials with (red) and without (black) visual feedback of the cursor within the first 0.4 sec.
Voxel-wise whole brain FA changes (TBSS)
There were no significant differences between the two baseline DTI sessions. There were no significant findings for the pre > post training, i.e., learning induced FA decreases. When comparing post>pre training, motor training increased FA values were localized to the white matter in the right hemisphere except for one cluster in the left corona radiata. Structures that showed an increased FA following training included the following areas in the right hemisphere, the posterior and anterior limbs of the internal capsule, the external capsule, the anterior and superior corona radiata, the body of the corpus callosum, and the superior longitudinal fasciculus as shown in Figure 3 and Table 1.
Figure 3.

Brain regions showing training-induced FA changes. Brain regions (Red-Yellow) showed significant increases in FA values induced by training, overlaid on top of the mean FA maps from all subjects. The regions are thickened for visualization purpose only.
Table 1.
The size and peak coordinate of the clusters showing significant FA increase post training.
| Cluster size (#voxels) | T value | p-value | max-coordinate (mm) in MNI space | |
|---|---|---|---|---|
| 525 | 4.91 | 0.02 | 19 −41 38 | Posterior corona radiata R (pCR) |
| 260 | 2.83 | 0.021 | 19 −7 43 | Superior corona radiata R (sCR) |
| 233 | 4.59 | 0.022 | 15 0 33 | Body of corpus callosum (bCC) |
| 217 | 5.42 | 0.021 | 22 −6 18 | Anterior limb of internal capsule R (aIC) |
| 109 | 5.94 | 0.021 | 27 −45 42 | 8% Superior longitudinal fasciculus R |
| 47 | 3.77 | 0.024 | 33 −3 7 | External capsule R |
| 47 | 4.41 | 0.023 | 35 −6 1 | External capsule R |
| 44 | 5.40 | 0.023 | 34 −14 3 | External capsule R |
| 43 | 3.58 | 0.021 | 27 −1 21 | Superior corona radiata R |
| 37 | 3.67 | 0.024 | 32 −14 10 | External capsule R |
| 36 | 2.52 | 0.022 | 30 −9 22 | Superior corona radiata R |
| 29 | 5.06 | 0.025 | −17 37 9 | Anterior corona radiata L |
| 28 | 2.88 | 0.023 | 33 −32 35 | Superior longitudinal fasciculus R |
| 23 | 3.85 | 0.023 | 20 −15 44 | 5% Corticospinal tract R |
| 20 | 2.14 | 0.023 | 28 −14 30 | Superior corona radiata R |
| 17 | 2.99 | 0.022 | 19 5 40 | Superior corona radiata R |
| 13 | 2.32 | 0.022 | 26 −21 43 | 11% Superior longitudinal fasciculus R, 11% Corticospinal tract R |
| 9 | 2.05 | 0.025 | 18 −7 3 | Posterior limb of internal capsule R |
ROI analysis
FA values from the regions showing significant differences were extracted as described and averaged across subjects. There was a 4.19% increase in FA value from 0.5327±0.0044 to 0.5548±0.0049 (mean±SE). The mean FA values within the four major clusters of the skeletonized FA maps for baseline 1, baseline 2, two baselines concatenated, and post training are shown in Figure 4A. Consistent with results from whole brain analysis, the ROI analysis results confirmed that there are no differences between two baselines measures and post training showed higher FA values across all four major clusters. Within the four clusters, the changes in FA, MD, RD, and AD are shown in Figure 4B. MD and RD tend to decrease while AD remains unchanged. Decreases in RD together with unchanged AD lead to the increase in FA and decrease in MD.
Figure 4.


(A) Mean FA values within four major clusters for skeletonized FA maps for baseline 1, baseline 2, two baselines concatenated, and post training. (B) Mean % change in FA, MD, AD, and RD within the four major ROIs across all subjects.
Tractography
Population tractography, using the four clusters as seed masks, is shown in Figure 5. Green indicates the cluster in the posterior corona radiata (pCR) ascending into the primary motor cortex (M1) and primary somatosensory cortex (S1), descending to the posterior internal capsule (pIC), and some fibers crossing to the contralateral hemisphere at the body of the corpus callosum (bCC). Blue indicates tracts originating from the superior corona radiate (sCR) ascending to the premotor cortex (PMC), descending to the pIC and cerebral peduncle, and not crossing the midline and remaining in the right hemisphere. Pink indicates tracts originating from the bCC, which connect bilaterally to the supplementary motor area (SMA) and the PMC. Red indicates tracts originating from the anterior internal capsule (aIC). These tracts almost entirely overlap the tracts form the sCR (blue).
Figure 5.
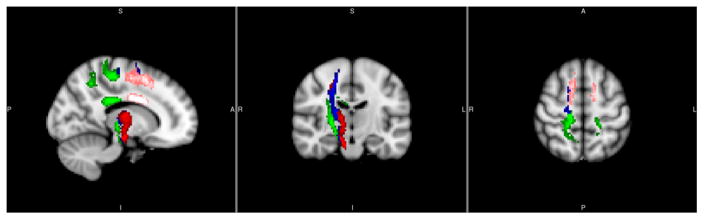
Group tractography using the four major clusters as seed masks: pCR (Green), sCR (Blue), bCC (Pink) and aIC (Red) (x=14, y=−16, z=56 mm). Green: cortical spinal tracts connecting primary motor and primary sensory cortices and descend to the posterior internal capsule; Blue and pink: cortical spinal tracts connecting premotor, posterior internal capsule and the cerebral peduncle; note that blue and pink tracts mostly overlap; and Red: corpus collusum connecting bilateral supplementary motor and premotor cortices.
FA correlation with behavior
Correlations between FA changes and motor performance gain are summarized in Table 2. Significant correlations between FA changes and improvements in performance were found in bCC and aIC for movement duration (r=0.8727, pFDR=0.018 and r=0.7636, pFDR=0.046) and for jerk index (r=0.8455, pFDR=0.021 and r=0.8273, pFDR=0.021).
Table 2.
FA Spearman rank correlation coefficients (r) along with FDR corrected p-values between FA changes and motor performance gain.
| r value (FDR- corrected p value) | pCR | sCR | bCC | aIC | |
|---|---|---|---|---|---|
| Reaching tests | Speed (Movement duration) | 0.4000 (0.5625) | 0.2818 (0.7311) | 0.8727 (0.0180)* | 0.7636 (0.0460)* |
| Smoothness (jerk index) | 0.5727(0.2353) | 0.2455 (0.7203) | 0.8455 (0.0210)* | 0.8273 (0.0207)* | |
| Accuracy (Reaching error) | 0.6796 (0.0856) | 0.2315 (0.7049) | 0.2626 (0.7255) | 0.2295(0.6629) | |
| Tetris (row/min) | 0.1182 (0.7729) | 0.1909 (0.7204) | 0.0909 (0.7966) | 0.3909 (0.5256) | |
| Wheel (miles/hr) | 0.1636 (0.7458) | 0.3364 (0.6260) | 0.4727 (0.4160) | 0.1455 (0.7482) | |
Indicates significant results (p<0.05).
Discussion
Our results show that 9 hours of motor skill training over 3 to 4 weeks improved motor performance and induced mainly unilateral increases in FA values in distributed white matter structures over the right hemisphere (non-dominant motor tracts), especially along the corticospinal tract and corpus callosum. There was a 4.19% increase in FA value from 0.5327 to 0.5548, which is in line with the juggling study of Scholz et al. (Scholz et al., 2009). Furthermore, the degree of changes in FA is positively correlated with improvements in some aspects of performance, such as duration and smoothness of movement, but not with movement accuracy. Larger increases in FA correspond to greater improvement in motor performance. There were no significant FA value reductions induced by training. The regions showing learning-induced changes included: (1) part of the pCR along the cortical spinal tracts that connects M1 and S1 and descends to the pIC (Green in Figure 5); (2) sCR and aIC along the cortical spinal tracts connecting PMC, pIC, and the cerebral peduncle; and (3) the bCC which connects bilateral SMA and PMC. The corticospinal tracts are integral in voluntary, discrete, skilled movements and are the longest and largest descending fiber tract in humans. The corticospinal tract originates from the neurons in the (M1, PMC, SMA, and S1), leaves the cerebral cortex via the corona radiata to the posterior limb of the internal capsule, and descends through the cerebral peduncles to finally synapse on motoneurons located in the anterior horn of the spinal cord (Kandel et al., 2012). The corpus callosum connects the left and right hemispheres facilitating interhemispheric communication. The bCC interconnects the motor, premotor and supplementary motor areas as demonstrated by tractography (Hofer and Frahm, 2006). We find similar tracts when the clusters identified with TBSS are used as seed regions for tractography (Figure 5). Further, FA values of CC had been shown to be correlated with bimanual motor coordination (Bonzano et al., 2008). PMC, SMA, M1, and S1 are major cortical structures involved in motor skill learning (Dayan and Cohen, 2011; Hardwick et al., 2013; Ungerleider et al., 2002). Our results suggest that white matter microstructures interconnecting these key regions showed learning induced changes and that these changes are related to the individual performance improvement in speed and smoothness of movement. These findings suggest the presence of changes in the white matter localized in fibers connecting cortical circuits (within and across hemispheres) involved in motor skill learning and these have not been reported earlier. Prior longitudinal neuroimaging studies of motor learning only reported FA changes in white matter of the (1) inferior to the intraparietal sulcus after 6 weeks of juggling (Scholz et al., 2009), and (2) below the primary motor cortex after one week of motor adaptation (Landi et al., 2011), and (3) the frontal and parietal regions after 6 weeks of a whole-body balancing task (Taubert et al., 2010). Previous cross-sectional studies did report experience-dependant changes in similar areas, though the directions of the FA changes are not consistent. Expert musicians have been shown to have increased FA in the internal capsule in comparison to non-experts (Bengtsson et al., 2005; Han et al., 2009), and the degree of change in FA was shown to correlate with the amount of practice (Bengtsson et al., 2005). Conversely, a study by Jäncke and coworkers found regional decreases in FA in the corticospinal tract, internal and external capsule, and inferior occipitofrontal fascicle in expert golfers compared to non-experts. The authors explained these findings as a reduced need for cortical input resulting from excessive training (Jancke et al., 2009).
Neuroanatomical studies (Alexander et al., 1986) in non-human primates suggested the existence of modular striato-thalamo-cortical circuits dedicated to the generation and control of specific sensory-motor behaviors. Similar striato-cortical structures in humans have been observed in a DTI study by Lehericy and colleagues (Lehéricy et al., 2004). In more recent theories of motor learning the basal ganglia are seen to have a key role in the learning of new sequences of actions, whereas the motor cortex is likely to participate in executive motor control and adaptation (Shmuelof & Krakauer, 2011). In the present study, we found evidence that by practicing body motions in the novel environment of the body-machine interface, subjects enhanced the inter-hemispheric connectivity and also the interactions between the striatum, motor cortex, somatosensory cortex, and SMA along pathways that are consistent with the proposal of Alexander and colleagues. In other words, the modular interactions between basal ganglia, motor cortex, somatosensory cortex, and SMA may play a key role in the reorganization of motor skills required to operate a body-machine interface. Earlier studies of this type of reorganization with both unimpaired and spinal cord injured participants (Casadio et al., 2010; Danziger and Mussa-Ivaldi, 2012) have supported the hypothesis that the brain forms a map of the transformation between the motion of the body and the motion of the controlled cursor. This corresponds to forming, through practice, an “internal model” of the novel task (Shadmehr and Mussa-Ivaldi, 1994; Wolpert et al., 1998). Therefore, our findings suggest that the process of learning a new sensory-motor map may lead to the formation of a new neural striato-cortical circuit that supports an internal model of the operational environment.
The right-sided unilateral observed differences in FA is expected because all of the volunteers were right handed. The non-dominant motor tracts in the right hemisphere are not as well tuned for the high level of control required to operate the BMI. The largest improvements in motor performance are expected from the left side of the body and thus the right cortical spinal tracts; although, previous studies have found no consistent associations between handedness and FA in the corticospinal tracts (Imfeld et al., 2009; Reich et al., 2006; Westerhausen et al., 2007). Due to limitations in the design of the training task (see below in the limitations), we could not directly test this hypothesis by correlating changes in FA with unilateral behavior measures. And due to the asymmetric skeleton used in the TBSS analysis, a direct comparison of FA values in the left and right hemispheres is not possible.
Given the observations of anisotropy in healthy nonmyelinated fibers, the axonal membranes are believed to be the primary reason in hindering water diffusion perpendicular to the fibers. The degree of anisotropy is usually correlated most strongly with axon number and density, but it is also modulated by the addition and loss of myelin along the axonal sheath (Beaulieu, 2002) (Johansen-Berg and Behrens, 2009). Since the possibility for growth of new axons in the mature brain is low, especially within a short period of time (3–4 weeks in the current study), the structural changes observed in the current study might occur in existing axons. This may be due changes in the myelination pattern, in which myelin lamellas increase in number and become more tightly packed leading to increased FA and decreased MD. Several cellular and molecular mechanisms have been proposed to explain learning induced neuroimaging observations (Zatorre et al., 2012), including a change in myelination. Myelin controls the speed of impulse conduction through axons. It also affects the synchrony of impulse traffic between distant cortical regions and is critical for optimal mental performance and learning (Fields, 2008). Myelin can influence conduction velocity by regulating the axon diameter, the thickness of the myelin sheath, the number and spacing of the nodes of Ranvier, and the nodal structure and molecular composition of ion channels in the node and paranodal regions. In addition to controlling conduction velocity, myelin proteins directly control synapse formation by inhibiting axon sprouting. This limits the critical period for synaptic plasticity and learning. Ultimately, histological studies are required to link neuroimaging observations and underlying cellular mechanisms. A recent study by Blumenfeld-Katzir et al. in 2011 (Blumenfeld-Katzir et al., 2011) reported a 2–4% increase in FA in the corpus callosum in a rat model following 5 days of training on the Morris water maze task (a spatial navigation task). Histology found increased Myelin Basic Protein (MBP, a myelin marker) staining in the rats’ corpus callosum, which was the only cellular marker that showed significant changes among neuronal, synaptic, dendritic, and astrocyte markers. This finding links the increase in FA to myelin sheath formation, thus implying an increase in the cellular organization and packing of axons induced by motor learning. In our study, the observed increased FA values may indicate microstructural changes of myelin thickness in white matter induced by learning to control the BMI. The close interrelationship between myelinating glia and neurons enables them to act together to alter white matter for faster, highly tuned information processing. The FA measure from diffusion imaging is likely affected by the combined changes of AD and/or RD. To elucidate these changes in FA, we examined AD, RD, and MD changes for the regions showing significant changes in FA. As shown in Figure 4B, the changes in AD are minimal, but RD decreased in all the major ROIs which leads to the increase in FA and decrease in MD. Previous studies in animals suggest that a decrease in RD can be induced by increased myelination (Gulani et al., 2001; Harsan et al., 2007; Ono et al., 1995; Song et al., 2002; Zhang et al., 2009). With reduced extracellular space due to increased myelin, the mean diffusivity of water will also decrease. These results further confirm that the changes we observed in FA are due to the microstructural changes of myelin thickness.
Clinical implications
We showed that eleven unimpaired subjects using a simple BMI for playing computer games for approximately 9 hours exhibited structural brain changes. Although preliminary, this result is significant for the clinical impact of the BMI, since it suggests an anatomical basis for long term structural changes in brain connectivity related to the reorganization of residual motor abilities after a few training sessions. Learning induced plasticity is relevant both to rehabilitation and to the skilled use of assistive devices. For example, in high-level spinal cord injury (SCI) subjects, cortical atrophy following a significant level of disability is a well-known complication (Freund et al., 2011). Several studies have proved that the sensory motor system undergoes functional reorganization following repeated practice of a motor task. However, it remains to be understood whether functional reorganization of brain circuits results from the formation of new pathways or from the activation of dormant synapses. A recent study (Henderson et al., 2011) showed that in 20 SCI subjects with complete injury at the thoracic level, the representation of the little finger in the somatosensory cortex moved medially towards the area of sensory loss, i.e., the lower part of the body. These changes resulted from the growth of new lateral connections. The combination of BMI and DTI can be an effective framework for further investigating these structural brain changes, especially in SCI subjects. Furthermore, these BMIs will provide severely impaired subjects with a powerful tool to enhance the proficient use of assistive devices, while promoting the reorganization process of both brain and body.
Limitations
The design of the study lacks a between subjects control group with no training or a control group with the same type of physical activity, but without learning component for comparison. However, numerous studies have already demonstrated the longitudinal reliability of DTI measures, including previous learning studies where control groups did not show FA changes (Scholz et al., 2009; Taubert et al., 2010). In our present study we used within subject control (two baseline scans) avoiding the effect of between-subjects variance and did not observe any FA changes in the two baseline sessions in the whole brain analysis as well as in the ROI analysis (Figure 4A). Furthermore, all significant FA changes indicated that FA increased following training. There were no significant changes in the Pre > Post training contrast providing more confidence in the findings of this study.
Due to the nature of the training, it is hard to design a control task with the exact same type of physical activity, but without a learning aspect (e.g., having the upper limb displaced passively to simulate the movements during training). Therefore, we are unable to completely distinguish whether the observed changes in FA originated from the remapping of body motion or just from the physical aspect of the training or both. However we found significant correlations between FA changes and performance changes, which suggest changes in FA is related to learning. Also Ostry et al. (Ostry et al., 2010) have shown that motor learning affects both motor and sensory functions while passive limb movements induce no sensory changes. The finding that white matter serving S1 regions is involved indicates that passive movement alone would not lead to the observed changes in the current study.
We did not have the capability to well-characterize the body movements in 3D: each camera saw only one marker with no possibility to reconstruct the 3D motion or precisely quantify the movement of each part of the body. However, based on our observations, the movements used by the subjects during the training were highly symmetric and body centered.
Conclusion
Although a growing number of structural neuroimaging studies have reported significant changes in gray matter density and white matter microstructure in the adult human brain following training, training-dependent structural plasticity in humans is still controversial (Draganski and Kherif, 2013; Erickson, 2013; Fields, 2013; Thomas and Baker, 2013a, b). Our findings provide further evidence suggesting that the practice of upper-body motions within the context of a novel task induces specific changes in the white matter tracts that connect somatosensory, premotor, motor, and supplementary motor cortical areas; brain regions known to support motor learning. These changes predominantly occurred in the right hemisphere while some also occurred in the inter-hemispheric pathways via the corpus callosum. Better performance was associated with higher FA and lower RD values in these selected white matter tracts. Overall, these structural changes demonstrate the functional reorganization and brain plasticity associated with motor skill learning. Brain plasticity is critical for successful physical rehabilitation as well as control of assistive devices. The ability to monitor these structural changes may allow patient specific rehabilitation programs and devices to be designed for optimal recovery. Future research will investigate white matter changes in spinal cord injury patients following training using a BMI.
Highlights.
White matter changes induced by motor training with a body-machine Interface
On average fractional anisotropy increased by 4.19% with training
FA increases were mostly localized to non-dominant corticospinal tract
Findings suggest functional reorganization associated with motor skill learning
Acknowledgments
This study was supported by NNINDS grant 1R21HD053608-01A1, NINDS grant 1R01NS053581-01A2, Neilsen Foundation, Brinson Foundation, FP7-PEOPLE-2012-CIG-334201(REMAKE) and the Center for Translational Imaging, Department of Radiology, Northwestern University.
Footnotes
Publisher's Disclaimer: This is a PDF file of an unedited manuscript that has been accepted for publication. As a service to our customers we are providing this early version of the manuscript. The manuscript will undergo copyediting, typesetting, and review of the resulting proof before it is published in its final citable form. Please note that during the production process errors may be discovered which could affect the content, and all legal disclaimers that apply to the journal pertain.
References
- Alexander GE, DeLong MR, Strick PL. Parallel organization of functionally segregated circuits linking basal ganglia and cortex. Annu Rev Neurosci. 1986;9:357–381. doi: 10.1146/annurev.ne.09.030186.002041. [DOI] [PubMed] [Google Scholar]
- Andersson JLR, Jenkinson M, Smith S. Non-linear optimisation. FMRIB technical report TR07JA1. 2007a from www.fmrib.ox.ac.uk/analysis/techrep.
- Andersson JLR, Jenkinson M, Smith S. Non-linear registration, aka Spatial normalisation. FMRIB technical report TR07JA2. 2007b from www.fmrib.ox.ac.uk/analysis/techrep.
- Basser PJ, Pierpaoli C. Microstructural and physiological features of tissues elucidated by quantitative-diffusion-tensor MRI. J Magn Reson B. 1996;111:209–219. doi: 10.1006/jmrb.1996.0086. [DOI] [PubMed] [Google Scholar]
- Beaulieu C. The basis of anisotropic water diffusion in the nervous system - a technical review. NMR Biomed. 2002;15:435–455. doi: 10.1002/nbm.782. [DOI] [PubMed] [Google Scholar]
- Beaulieu C. The Biological Basis of Diffusion Anistropy. In: Johansen-Berg H, Behrens TEJ, editors. Diffusion MRI: from quantitative measurement to in-vivo neuroanamtoy. Elsevier/Academic Press; Amsterdam: 2009. [Google Scholar]
- Behrens TE, Berg HJ, Jbabdi S, Rushworth MF, Woolrich MW. Probabilistic diffusion tractography with multiple fibre orientations: What can we gain? NeuroImage. 2007;34:144–155. doi: 10.1016/j.neuroimage.2006.09.018. [DOI] [PMC free article] [PubMed] [Google Scholar]
- Bengtsson SL, Nagy Z, Skare S, Forsman L, Forssberg H, Ullen F. Extensive piano practicing has regionally specific effects on white matter development. Nat Neurosci. 2005;8:1148–1150. doi: 10.1038/nn1516. [DOI] [PubMed] [Google Scholar]
- Bermudez P, Zatorre RJ. Differences in gray matter between musicians and nonmusicians. Ann N Y Acad Sci. 2005;1060:395–399. doi: 10.1196/annals.1360.057. [DOI] [PubMed] [Google Scholar]
- Blumenfeld-Katzir T, Pasternak O, Dagan M, Assaf Y. Diffusion MRI of Structural Brain Plasticity Induced by a Learning and Memory Task. PLoS One. 2011;6:e20678. doi: 10.1371/journal.pone.0020678. [DOI] [PMC free article] [PubMed] [Google Scholar]
- Bonzano L, Tacchino A, Roccatagliata L, Abbruzzese G, Mancardi GL, Bove M. Callosal contributions to simultaneous bimanual finger movements. J Neurosci. 2008;28:3227–3233. doi: 10.1523/JNEUROSCI.4076-07.2008. [DOI] [PMC free article] [PubMed] [Google Scholar]
- Boyke J, Driemeyer J, Gaser C, Buchel C, May A. Training-induced brain structure changes in the elderly. J Neurosci. 2008;28:7031–7035. doi: 10.1523/JNEUROSCI.0742-08.2008. [DOI] [PMC free article] [PubMed] [Google Scholar]
- Cannonieri GC, Bonilha L, Fernandes PT, Cendes F, Li LM. Practice and perfect: length of training and structural brain changes in experienced typists. Neuroreport. 2007;18:1063–1066. doi: 10.1097/WNR.0b013e3281a030e5. [DOI] [PubMed] [Google Scholar]
- Casadio M, Pressman A, Fishbach A, Danziger Z, Acosta S, Chen D, Tseng HY, Mussa-Ivaldi FA. Functional reorganization of upper-body movement after spinal cord injury. Exp Brain Res. 2010;207:233–247. doi: 10.1007/s00221-010-2427-8. [DOI] [PMC free article] [PubMed] [Google Scholar]
- Casadio M, Ranganathan R, Mussa-Ivaldi FA. The body-machine interface: a new perspective on an old theme. J Mot Behav. 2012;44:419–433. doi: 10.1080/00222895.2012.700968. [DOI] [PMC free article] [PubMed] [Google Scholar]
- Danziger Z, Mussa-Ivaldi FA. The influence of visual motion on motor learning. J Neurosci. 2012;32:9859–9869. doi: 10.1523/JNEUROSCI.5528-11.2012. [DOI] [PMC free article] [PubMed] [Google Scholar]
- Davidson PR, Wolpert DM. Motor learning and prediction in a variable environment. Curr Opin Neurobiol. 2003;13:232–237. doi: 10.1016/s0959-4388(03)00038-2. [DOI] [PubMed] [Google Scholar]
- Dayan E, Cohen LG. Neuroplasticity subserving motor skill learning. Neuron. 2011;72:443–454. doi: 10.1016/j.neuron.2011.10.008. [DOI] [PMC free article] [PubMed] [Google Scholar]
- Draganski B, Gaser C, Busch V, Schuierer G, Bogdahn U, May A. Neuroplasticity: changes in grey matter induced by training. Nature. 2004;427:311–312. doi: 10.1038/427311a. [DOI] [PubMed] [Google Scholar]
- Draganski B, Kherif F. In vivo assessment of use-dependent brain plasticity--beyond the “one trick pony” imaging strategy. NeuroImage. 2013;73:255–259. doi: 10.1016/j.neuroimage.2012.08.058. discussion 265–257. [DOI] [PubMed] [Google Scholar]
- Driemeyer J, Boyke J, Gaser C, Buchel C, May A. Changes in gray matter induced by learning--revisited. PLoS One. 2008;3:e2669. doi: 10.1371/journal.pone.0002669. [DOI] [PMC free article] [PubMed] [Google Scholar]
- Dudai Y. The Neurobiology of Memory: Concepts, Findings, Trends. Oxford University Press; USA: 1989. [Google Scholar]
- Erickson KI. Evidence for structural plasticity in humans: comment on Thomas and Baker (2012) NeuroImage. 2013;73:237–238. doi: 10.1016/j.neuroimage.2012.07.003. discussion 265–237. [DOI] [PubMed] [Google Scholar]
- Fields RD. White matter in learning, cognition and psychiatric disorders. Trends Neurosci. 2008;31:361–370. doi: 10.1016/j.tins.2008.04.001. [DOI] [PMC free article] [PubMed] [Google Scholar]
- Fields RD. Imaging learning: the search for a memory trace. Neuroscientist. 2011;17:185–196. doi: 10.1177/1073858410383696. [DOI] [PMC free article] [PubMed] [Google Scholar]
- Fields RD. Changes in brain structure during learning: fact or artifact? Reply to Thomas and Baker. NeuroImage. 2013;73:260–264. doi: 10.1016/j.neuroimage.2012.08.085. discussion 265–267. [DOI] [PMC free article] [PubMed] [Google Scholar]
- Freund P, Weiskopf N, Ward NS, Hutton C, Gall A, Ciccarelli O, Craggs M, Friston K, Thompson AJ. Disability, atrophy and cortical reorganization following spinal cord injury. Brain. 2011;134:1610–1622. doi: 10.1093/brain/awr093. [DOI] [PMC free article] [PubMed] [Google Scholar]
- Gaser C, Schlaug G. Brain structures differ between musicians and non-musicians. J Neurosci. 2003;23:9240–9245. doi: 10.1523/JNEUROSCI.23-27-09240.2003. [DOI] [PMC free article] [PubMed] [Google Scholar]
- Gulani V, Webb AG, Duncan ID, Lauterbur PC. Apparent diffusion tensor measurements in myelin-deficient rat spinal cords. Magn Reson Med. 2001;45:191–195. doi: 10.1002/1522-2594(200102)45:2<191::aid-mrm1025>3.0.co;2-9. [DOI] [PubMed] [Google Scholar]
- Han Y, Yang H, Lv YT, Zhu CZ, He Y, Tang HH, Gong QY, Luo YJ, Zang YF, Dong Q. Gray matter density and white matter integrity in pianists’ brain: a combined structural and diffusion tensor MRI study. Neurosci Lett. 2009;459:3–6. doi: 10.1016/j.neulet.2008.07.056. [DOI] [PubMed] [Google Scholar]
- Hardwick RM, Rottschy C, Miall RC, Eickhoff SB. A quantitative meta-analysis and review of motor learning in the human brain. NeuroImage. 2013;67:283–297. doi: 10.1016/j.neuroimage.2012.11.020. [DOI] [PMC free article] [PubMed] [Google Scholar]
- Harsan LA, Poulet P, Guignard B, Parizel N, Skoff RP, Ghandour MS. Astrocytic hypertrophy in dysmyelination influences the diffusion anisotropy of white matter. J Neurosci Res. 2007;85:935–944. doi: 10.1002/jnr.21201. [DOI] [PubMed] [Google Scholar]
- Hebb DO. Organization of behavior. Wiley and Sons; New York: 1949. [DOI] [PubMed] [Google Scholar]
- Henderson LA, Gustin SM, Macey PM, Wrigley PJ, Siddall PJ. Functional reorganization of the brain in humans following spinal cord injury: evidence for underlying changes in cortical anatomy. J Neurosci. 2011;31:2630–2637. doi: 10.1523/JNEUROSCI.2717-10.2011. [DOI] [PMC free article] [PubMed] [Google Scholar]
- Hofer S, Frahm J. Topography of the human corpus callosum revisited—Comprehensive fiber tractography using diffusion tensor magnetic resonance imaging. NeuroImage. 2006;32:989–994. doi: 10.1016/j.neuroimage.2006.05.044. [DOI] [PubMed] [Google Scholar]
- Hua K, Zhang J, Wakana S, Jiang H, Li X, Reich DS, Calabresi PA, Pekar JJ, van Zijl PC, Mori S. Tract probability maps in stereotaxic spaces: analyses of white matter anatomy and tract-specific quantification. NeuroImage. 2008;39:336–347. doi: 10.1016/j.neuroimage.2007.07.053. [DOI] [PMC free article] [PubMed] [Google Scholar]
- Imfeld A, Oechslin MS, Meyer M, Loenneker T, Jancke L. White matter plasticity in the corticospinal tract of musicians: a diffusion tensor imaging study. NeuroImage. 2009;46:600–607. doi: 10.1016/j.neuroimage.2009.02.025. [DOI] [PubMed] [Google Scholar]
- Jancke L, Koeneke S, Hoppe A, Rominger C, Hanggi J. The architecture of the golfer’s brain. PLoS One. 2009;4:e4785. doi: 10.1371/journal.pone.0004785. [DOI] [PMC free article] [PubMed] [Google Scholar]
- Jenkinson M, Beckmann CF, Behrens TE, Woolrich MW, Smith SM. Fsl. NeuroImage. 2012;62:782–790. doi: 10.1016/j.neuroimage.2011.09.015. [DOI] [PubMed] [Google Scholar]
- Johansen-Berg H, Behrens TE. Diffusion MRI: From quantitative measurement to in-vivo neuroanatomy. Academic Press; 2009. [Google Scholar]
- Jolliffe IT. Principal Component Analysis. Springer; New York, NY: 2002. [Google Scholar]
- Jung RE, Caprihan A, Chavez RS, Flores RA, Sharrar J, Qualls CR, Sibbitt W, Roldan CA. Diffusion tensor imaging in neuropsychiatric systemic lupus erythematosus. BMC Neurol. 2010;10:65. doi: 10.1186/1471-2377-10-65. [DOI] [PMC free article] [PubMed] [Google Scholar]
- Kandel ER, Schwartz JH, Jessell TM, Siegebaum SA, Hudspeth AJ. Principles of neural science. 5. McGraw Hill Medical; 2012. [Google Scholar]
- Kantak SS, Winstein CJ. Learning-performance distinction and memory processes for motor skills: a focused review and perspective. Behav Brain Res. 2012;228:219–231. doi: 10.1016/j.bbr.2011.11.028. [DOI] [PubMed] [Google Scholar]
- Landi SM, Baguear F, Della-Maggiore V. One week of motor adaptation induces structural changes in primary motor cortex that predict long-term memory one year later. J Neurosci. 2011;31:11808–11813. doi: 10.1523/JNEUROSCI.2253-11.2011. [DOI] [PMC free article] [PubMed] [Google Scholar]
- Lee MR, Gallen CL, Ross TJ, Kurup P, Salmeron BJ, Hodgkinson CA, Goldman D, Stein EA, Enoch MA. A preliminary study suggests that nicotine and prefrontal dopamine affect cortico-striatal areas in smokers with performance feedback. Genes Brain Behav. 2013;12:554–563. doi: 10.1111/gbb.12027. [DOI] [PMC free article] [PubMed] [Google Scholar]
- Lehéricy S, Ducros M, Van De Moortele PF, Francois C, Thivard L, Poupon C, Swindale N, Ugurbil K, Kim DS. Diffusion tensor fiber tracking shows distinct corticostriatal circuits in humans. Annals of Neurology. 2004;55:522–529. doi: 10.1002/ana.20030. [DOI] [PubMed] [Google Scholar]
- Maguire EA, Gadian DG, Johnsrude IS, Good CD, Ashburner J, Frackowiak RS, Frith CD. Navigation-related structural change in the hippocampi of taxi drivers. Proc Natl Acad Sci U S A. 2000;97:4398–4403. doi: 10.1073/pnas.070039597. [DOI] [PMC free article] [PubMed] [Google Scholar]
- Monnig MA, Caprihan A, Yeo RA, Gasparovic C, Ruhl DA, Lysne P, Bogenschutz MP, Hutchison KE, Thoma RJ. Diffusion tensor imaging of white matter networks in individuals with current and remitted alcohol use disorders and comorbid conditions. Psychol Addict Behav. 2013;27:455–465. doi: 10.1037/a0027168. [DOI] [PMC free article] [PubMed] [Google Scholar]
- Ono J, Harada K, Takahashi M, Maeda M, Ikenaka K, Sakurai K, Sakai N, Kagawa T, Fritz-Zieroth B, Nagai T, et al. Differentiation between dysmyelination and demyelination using magnetic resonance diffusional anisotropy. Brain Res. 1995;671:141–148. doi: 10.1016/0006-8993(94)01335-f. [DOI] [PubMed] [Google Scholar]
- Ostry DJ, Darainy M, Mattar AA, Wong J, Gribble PL. Somatosensory plasticity and motor learning. J Neurosci. 2010;30:5384–5393. doi: 10.1523/JNEUROSCI.4571-09.2010. [DOI] [PMC free article] [PubMed] [Google Scholar]
- Park IS, Lee KJ, Han JW, Lee NJ, Lee WT, Park KA, Rhyu IJ. Experience-dependent plasticity of cerebellar vermis in basketball players. Cerebellum. 2009;8:334–339. doi: 10.1007/s12311-009-0100-1. [DOI] [PubMed] [Google Scholar]
- Reich DS, Smith SA, Jones CK, Zackowski KM, van Zijl PC, Calabresi PA, Mori S. Quantitative characterization of the corticospinal tract at 3T. AJNR Am J Neuroradiol. 2006;27:2168–2178. [PMC free article] [PubMed] [Google Scholar]
- Scholz J, Klein MC, Behrens TE, Johansen-Berg H. Training induces changes in white-matter architecture. Nat Neurosci. 2009;12:1370–1371. doi: 10.1038/nn.2412. [DOI] [PMC free article] [PubMed] [Google Scholar]
- Shadmehr R, Mussa-Ivaldi FA. Adaptive representation of dynamics during learning of a motor task. J Neurosci. 1994;14:3208–3224. doi: 10.1523/JNEUROSCI.14-05-03208.1994. [DOI] [PMC free article] [PubMed] [Google Scholar]
- Smith SM, Jenkinson M, Johansen-Berg H, Rueckert D, Nichols TE, Mackay CE, Watkins KE, Ciccarelli O, Cader MZ, Matthews PM, Behrens TE. Tract-based spatial statistics: voxelwise analysis of multi-subject diffusion data. NeuroImage. 2006;31:1487–1505. doi: 10.1016/j.neuroimage.2006.02.024. [DOI] [PubMed] [Google Scholar]
- Song SK, Sun SW, Ramsbottom MJ, Chang C, Russell J, Cross AH. Dysmyelination revealed through MRI as increased radial (but unchanged axial) diffusion of water. NeuroImage. 2002;17:1429–1436. doi: 10.1006/nimg.2002.1267. [DOI] [PubMed] [Google Scholar]
- Taubert M, Draganski B, Anwander A, Muller K, Horstmann A, Villringer A, Ragert P. Dynamic properties of human brain structure: learning-related changes in cortical areas and associated fiber connections. J Neurosci. 2010;30:11670–11677. doi: 10.1523/JNEUROSCI.2567-10.2010. [DOI] [PMC free article] [PubMed] [Google Scholar]
- Teulings HL, Contreras-Vidal JL, Stelmach GE, Adler CH. Parkinsonism reduces coordination of fingers, wrist, and arm in fine motor control. Exp Neurol. 1997;146:159–170. doi: 10.1006/exnr.1997.6507. [DOI] [PubMed] [Google Scholar]
- Thomas C, Baker CI. On evidence, biases and confounding factors: Response to commentaries. NeuroImage. 2013a;73:265–267. doi: 10.1016/j.neuroimage.2012.11.009. [DOI] [PMC free article] [PubMed] [Google Scholar]
- Thomas C, Baker CI. Teaching an adult brain new tricks: a critical review of evidence for training-dependent structural plasticity in humans. NeuroImage. 2013b;73:225–236. doi: 10.1016/j.neuroimage.2012.03.069. [DOI] [PubMed] [Google Scholar]
- Ungerleider LG, Doyon J, Karni A. Imaging brain plasticity during motor skill learning. Neurobiol Learn Mem. 2002;78:553–564. doi: 10.1006/nlme.2002.4091. [DOI] [PubMed] [Google Scholar]
- Westerhausen R, Huster RJ, Kreuder F, Wittling W, Schweiger E. Corticospinal tract asymmetries at the level of the internal capsule: is there an association with handedness? NeuroImage. 2007;37:379–386. doi: 10.1016/j.neuroimage.2007.05.047. [DOI] [PubMed] [Google Scholar]
- Wolpert DM, Miall RC, Kawato M. Internal models in the cerebellum. Trends Cogn Sci. 1998;2:338–347. doi: 10.1016/s1364-6613(98)01221-2. [DOI] [PubMed] [Google Scholar]
- Zarei M, Johansen-Berg H, Jenkinson M, Ciccarelli O, Thompson AJ, Matthews PM. Two-dimensional population map of cortical connections in the human internal capsule. J Magn Reson Imaging. 2007;25:48–54. doi: 10.1002/jmri.20810. [DOI] [PMC free article] [PubMed] [Google Scholar]
- Zatorre RJ, Fields RD, Johansen-Berg H. Plasticity in gray and white: neuroimaging changes in brain structure during learning. Nat Neurosci. 2012;15:528–536. doi: 10.1038/nn.3045. [DOI] [PMC free article] [PubMed] [Google Scholar]
- Zhang J, Jones M, DeBoy CA, Reich DS, Farrell JA, Hoffman PN, Griffin JW, Sheikh KA, Miller MI, Mori S, Calabresi PA. Diffusion tensor magnetic resonance imaging of Wallerian degeneration in rat spinal cord after dorsal root axotomy. J Neurosci. 2009;29:3160–3171. doi: 10.1523/JNEUROSCI.3941-08.2009. [DOI] [PMC free article] [PubMed] [Google Scholar]