
Figure 3.
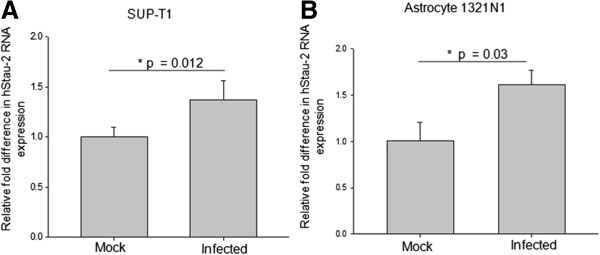
hStau-2 expression in SUP-T1 and 1321 N1 cell lines upon HIV-1 infection. Cells were infected with 50 ng/ml of p24 equivalent of NL4-3 virus. RNA was isolated from both mock and infected cells and qRT-PCR was carried out. A) hStau-2 expression in SUP-T1 cells B) hStau-2 expression in 1321 N1 cells. The result are from 4 independent experiments and error bars represent ± SD. *p value ≤ 0.05 was taken as significant. The data were normalized to the transcript levels of β–actin.