

Abstract
Motivation: The recently released Infinium HumanMethylation450 array (the ‘450k’ array) provides a high-throughput assay to quantify DNA methylation (DNAm) at ∼450 000 loci across a range of genomic features. Although less comprehensive than high-throughput sequencing-based techniques, this product is more cost-effective and promises to be the most widely used DNAm high-throughput measurement technology over the next several years.
Results: Here we describe a suite of computational tools that incorporate state-of-the-art statistical techniques for the analysis of DNAm data. The software is structured to easily adapt to future versions of the technology. We include methods for preprocessing, quality assessment and detection of differentially methylated regions from the kilobase to the megabase scale. We show how our software provides a powerful and flexible development platform for future methods. We also illustrate how our methods empower the technology to make discoveries previously thought to be possible only with sequencing-based methods.
Availability and implementation: http://bioconductor.org/packages/release/bioc/html/minfi.html.
Contact: khansen@jhsph.edu; rafa@jimmy.harvard.edu
Supplementary information: Supplementary data are available at Bioinformatics online.
1 INTRODUCTION
DNA methylation (DNAm) is a chemical modification of DNA that plays a key role in regulating gene expression. Epigenetic mechanisms, including DNAm, allow a single genome to give rise to hundreds of phenotypically diverse cell types. In addition to its importance in normal development, DNAm is thought to play an important role in diseases when dysregulated.
Chemically, DNAm involves the addition of a methyl group to a cytosine base (C), forming methylcytosine. In adult mammalian cells, this modification occurs almost exclusively at Cs immediately followed by a G in the 5′–3′ direction, denoted by CpG. CpGs are depleted in mammalian genomes and those that remain tend to cluster in regions termed CpG islands (Gardiner-Garden and Frommer, 1987) that are enriched near gene promoters.
The health implications of deciphering the DNAm code have recently received much attention (Dawson and Kouzarides, 2012; Feinberg, 2007). DNAm is best understood in the context of cancer biology, where it is clear that aberrant gains and losses of DNAm almost universally accompany the initiation and progression of tumors (Feinberg and Tycko, 2004). Much of the excitement surrounding epigenetics relates to the promise of therapies that reverse disease-associated epigenetic alterations, thereby activating or silencing aberrantly expressed disease-related genes.
As a result of DNAm’s role in developmental and disease biology, there is great interest in measuring DNAm at a comprehensive genomic scale. Although next-generation sequencing technologies offer several promising new approaches (Krueger et al., 2012), currently, Illumina Infinium arrays are the most widely used technology for this purpose. For example, The Cancer Genome Atlas (TCGA) project is using this array and has already processed >6000 samples (as of September 30, 2013) and made the data publicly available (http://cancergenome.nih.gov/). Furthermore, large cohort studies are becoming interested in measuring methylation and are expected to use cost-effective arrays with some studies already published (Rakyan et al., 2011).
This work introduces a software development framework for the analysis of Illumina Infinium methylation arrays. Although the design is general, the current version of our software focuses on the Illumina Infinium HumanMethylation450 Bead array (the ‘450k’ array), their most recent product. This array has been extensively described (Bibikova et al., 2011), but we include a short description here for completeness. The two-color array interrogates the methylation status of 485 512 methylation loci (mostly CpG sites, but a small number of cytosines outside of the CpG context are also present), using bisulfite-converted DNA. For each methylation locus, two signals of interest are recorded. One signal measures the amount of methylated DNA (Meth), and the other signal measures the amount of unmethylated DNA (Unmeth). In principle, the proportion Meth/(Unmeth + Meth) is the methylation ratio (referred to as beta value by Illumina’s software) in the population of cells from which we extract DNA. The methylation ratio, or its logit transform, is the quantity used in downstream analysis. In the scientific literature related to the 450k platform, logit-transformed beta values are referred to as M-values.
The Meth and Unmeth signals do not relate to the green and red channels in a straightforward way. The 450k platform includes two different methylation assay designs, referred to as Infinium I and Infinium II, or type I and type II. Each methylation locus is interrogated by one of these designs. For a type I locus, the Meth and Unmeth signals are measured by two paired probes, with a given locus using either the red or green signal from these probes. Type II loci are assayed using a single probe, with Meth and Unmeth signals derived from the green and red channels, respectively. In addition to the methylation loci, the array contains a small number of control probes and 65 probes measuring common single-nucleotide polymorphisms (SNPs), intended for sample tracking.
The reasoning behind using two different probe designs is simple, but illuminating for potential developers. Type II probes use only one probe per methylation locus and hence allow more loci on the array, at a fixed array size. However, owing to the chemistry used by the type II probe design, type II probes can only tolerate up to three CpGs within the 50-bp probe. The type I design tolerates more CpGs within the 50-bp probe, but assumes that all methylation loci in the probed sequence are in the same state, i.e. the probe measuring Meth assumes all CpGs within the probed sequence to be methylated, and the probe measuring Unmeth assumes all CpGs in the probed sequence are unmethylated. The ability to tolerate more CpGs in the probe allows type I probes to be used in regions of high CpG density, such as CpG islands (CGI).
Until recently, studies of DNAm have focused largely on CGI. For example, the Illumina products that preceded the 450k included the widely used Infinium 27k array exclusively targeted CGI, primarily at gene promoters. However, Irizarry et al. (2008), using a non–CGI-centric array design, referred to as comprehensive arrays for relative methylation (CHARM), demonstrated that greater variability is present in regions outside CGI and coined the term ‘CGI shores’ for regions within 2 kb of CGI. The 450k array design includes a set of regions identified as tissue- or cancer-specific using CHARM data, including CGIs and CGI shores, as well as probes in other regions, which Illumina refers to as shelf and open sea (Table 1).
Table 1.
Number of 450k array loci stratified by probe design and genomic region
| Region type | Probe design |
Total | |
|---|---|---|---|
| I | II | ||
| CpG Island | 77 674 | 72 580 | 150 254 |
| CpG Island Shore | 22 371 | 89 696 | 112 067 |
| CpG Island Shelf | 6913 | 40 231 | 47 144 |
| Open sea | 28 518 | 147 529 | 176 047 |
| Total | 135 476 | 350 036 | 485 512 |
Here we present a software suite containing an assortment of new functionality for the analysis of this array, but also containing an infrastructure useful as a development platform for the research community. We note that Subset-quantile Within Array Normalization (SWAN) (Maksimovic et al., 2012), one of the first alternative preprocessing methods, was developed by another group using our infrastructure. Among the tools developed by our group, we specifically describe bump hunting (Jaffe et al., 2012) and block finding (Hansen et al., 2011) capabilities. Although current data analyses for these arrays have relied on single probe analysis (Marabita et al., 2013; Pidsley et al., 2013; Touleimat and Tost, 2012; Wessely and Emes, 2012), we have previously pointed out the advantages of borrowing strength across neighboring loci (Aryee et al., 2011; Doi et al., 2009; Jaffe et al., 2012). Furthermore, a recent finding related to cancer was the observation of large genomic [10–1000 kb] hypomethylated blocks (Hansen et al., 2011). We introduce an approach that permits the discovery of hypo- and hypermethylated blocks with 450k data. We illustrate the advantages of our software with publicly available data.
2 METHODS
2.1 Annotation
Meaningful analysis of 450k data depends on annotating probes with genomic location and their relationship to islands, genes and other genomic features. Although probe sequence is fixed as part of the array design, annotation can change for a number of reasons, such as a change of the human genome build. For this reason, our software package separates data from annotation and annotation from array design. By annotation we mean how methylation loci are associated with genomic locations and nearby features. By design we mean how probes on the array are matched with relevant color channels to produce the Meth and Unmeth signals. At the time of writing, the annotation information was stored in a separate Bioconductor (Gentleman et al., 2004) package IlluminaHumanMethylation450kanno.ilmn12.hg19, and the array design was stored in IlluminaHumanMethylation450kmanifest. The annotation package will change, but we will use careful version control such that any given analysis can be reproducible.
We also maintain independence by defining two types of data classes for the experimental data: one stores data independently of annotation and the other includes genomic annotation. The two types of classes are distinguished by the presence or absence of the word Genomic in their class name as explained in detail in the next section.
2.2 Representing methylation data in R
To enable flexible development of preprocessing and analysis methods, we operate with a number of different representations of the array data through S4 classes (Chambers, 1998). Our software starts with .idat files, a binary format containing the raw red and green channel intensities. The ‘RGChannelSet’ class organizes these data into an object for which several useful accessor methods are available. Once these data are processed into methylation measurements, they can be stored in four additional classes representing several stages of preprocessed data: ‘MethylSet’, ‘GenomicMethylSet’, ‘RatioSet’ and ‘GenomicRatioSet’. The ‘Genomic’ prefix in the class name indicates that methylation loci have been associated with a genomic location. This is a nonreversible transformation, as it entails choosing a reference genome and discards unmapped probes. The operation is achieved by the function ‘mapToGenome’, which permits the user to choose a human genome build. The MethylSet and GenomicMethylSet classes directly represent the Meth and Unmeth measurements and are useful for preprocessing routines delivering final measurements in these channels, such as the normalization routines currently included with Illumina’s GenomeStudio Software. The RatioSet and GenomicRatioSet classes represent the data as methylation ratios (beta values) or M-values (log ratios of beta values). Both classes include the option of including a copy number measurement [e.g. CN = log2(Meth + Unmeth)]. The ratioConvert function converts MethylSet to RatioSet and GenomicMethylSet to GenomicRatioSet. This design provides a flexible framework for method development and analyses. The natural starting point for analysis is usually the GenomicRatioSet class.
Note that although our software makes it particularly easy to import raw data from the primary .idat files, it is also possible to import processed data exported from GenomeStudio (Illumina’s default software), which is often encountered in public data repositories. These data can also be conveniently stored in GenomicRatioSet objects.
2.3 Preprocessing/normalization
Preprocessing raw microarray intensities into usable methylation measurements is an important step in data analysis (Triche et al., 2013). Several successful techniques have been developed for gene expression arrays, with quantile normalization being one of the most popular techniques (Bolstad et al., 2003). Illumina developed a new procedure that did not take full advantage of these previous developments (our software includes preprocessIllumina: an implementation of this procedure that can be applied to RGChannelSets). Several groups have found that this procedure can be improved upon by borrowing ideas from normalization techniques developed for expression arrays (Maksimovic et al., 2012; Pidsley et al., 2013; Teschendorff et al., 2013; Touleimat and Tost, 2012; Triche et al., 2013). However, quantile normalization was not used in part because these groups noticed that the empirical distributions of type I and type II were different (Fig. 1). We implemented a version of subset quantile normalization (Wu and Aryee, 2010) that takes into account this characteristic. This normalization procedure is essentially similar to the one previously presented (Touleimat and Tost, 2012), but has been independently reimplemented owing to the present lack of a released supported version. We apply our procedure to the Meth and Unmeth intensities separately. We force the distribution of type I and type II to be the same by first quantile normalizing the type II probes across samples and then interpolating a reference distribution to which we normalize the type I probes. Because probe types and probe regions are confounded (Table 1) and we know that DNAm distributions vary across regions (Fig. 1), we stratify the probes by region before applying this interpolation. For the probes on the X and Y chromosomes, we normalize males and females separately. Sex is determined by the getSex function using copy number information. The stratified quantile normalization method is implemented by the preprocessQuantile function (the function does no background correction and removes zeros using the fixMethOutlier function). Note that this algorithm relies on the assumptions necessary for quantile normalization to be applicable and thus is not recommended for cases where global changes are expected, such as in cancer–normal comparisons. We also note that whereas most currently available methods (e.g. Illumina, Beta MIxture Quantile dilation (BMIQ), SWAN) are within-array procedures, our stratified quantile normalization procedure involves both within- and between-sample normalization.
Fig. 1.
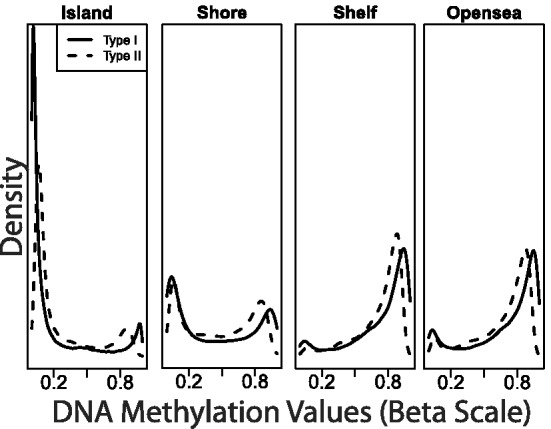
Beta density estimates for a typical sample showing type I (solid) and type II (dashed) loci located in CGIs, CGI shores, CGI shelves and open sea regions
2.4 Quality assessment
Quality assessment is an important step in microarray analysis. Detecting and removing low-quality samples that normalization cannot correct has been shown to improve downstream results (McCall et al., 2011). As larger datasets using the 450k array have become available, our ability to detect low-quality samples has improved. Our infrastructure permits the development of such statistical tools. We have found it useful to inspect the median of the Meth and Unmeth signals for each array. We demonstrate this feature in Section 3 using a publicly available dataset composed of 100 arrays hybridized to DNA from whole blood.
2.5 Annotating probes affected by genetic variation
It has been noted that the manufacturer’s array design manifest contains incomplete annotation of SNPs at probed sites and that these polymorphisms may affect DNAm measurements (Dedeurwaerder et al., 2013; Price et al., 2013; Touleimat and Tost, 2012; Wang et al., 2012; Yousefi et al., 2013; Zhi et al., 2013). Therefore, we have included a more comprehensive SNP annotation in minfi. We obtained all common SNPs from dbSNP137 (minor allele frequency > 1%) within each 450k probe and identified whether SNPs were at the single base extension site (position 0), at the proximal CpG on the probe (positions 1–2) or within the probe body (positions 3–50). Using this SNP annotation, which is available in the package, users can decide the stringency of probe filtering appropriate for their analysis. We have developed scripts for this purpose, which are included in minfi.
2.6 Bump hunting
Frequently, the goal of a study involving DNAm profiling is to identify regions of contiguous CpGs associated with a phenotype of interest. For example, we may find a CGI showing higher methylation levels in cancer cells compared with normal controls. We have developed an approach for identifying and attaching statistical uncertainty to such regions. These methods are implemented in the bumphunter Bioconductor package. The minfi package interfaces seamlessly with bumphunter and provides a more robust method for detecting differentially methylated loci than the standard approach of analyzing each CpG individually (Marabita et al., 2013; Pidsley et al., 2013; Touleimat and Tost, 2012; Wessely and Emes, 2012). Many of the loci on the 450k array are clustered into regions similar to those found on CHARM arrays, with 315 420 being located within 300 bp of another probed locus. The array includes 72 611 such clusters with the average region spanning 332 bp and containing an average of 4.3 loci. Therefore, we can apply the original bumphunter implementation as described in (Jaffe et al., 2012). To do this, the bumphunter package includes the clusterMaker function, which, given a maximum gap between probes, groups them into clusters. We perform a probe-level regression and smooth the coefficient of interest within clusters to identify bumps along the genome. We demonstrate the advantages of identifying regions in Section 3.
2.7 Block finding
Because bump hunting focuses on methylation changes on the scale of gene promoters (1–2 kb), it is not designed to find long-range alterations such as the recently identified hypomethylated blocks (Berman et al., 2012; Hansen et al., 2011). Blocks have, to date, only been detected using whole-genome bisulfite sequencing because microarrays include only select regions of the genome. However, we have developed a method that uses ∼170 000 open sea probes on the 450 k to detect long-range changes in the methylation status. To do this, we first use the cpgCollapse function to group adjacent open sea loci into clusters with a default maximum gap of 500 bp and a maximum cluster width of 1500 bp (Fig. 2). The loci within each cluster are then averaged, resulting in a single mean estimate per cluster. The resulting cluster centers are then grouped into large regions (Fig. 2) in which the bump hunting procedure is applied with a large (250 KB+) smoothing window. In Section 3, we demonstrate that published hypomethylated blocks identified from whole-genome bisulfite sequencing data can be recovered with this approach. However, estimating the precise boundaries of these blocks is constrained by the resolution of the array.
Fig. 2.

Illustration of locus-collapsing procedure for block finding. Loci in CpG islands, shores, shelves and open sea regions are represented by green, orange, purple and pink, respectively. (A) The boxes represent locus groups, each of which is collapsed to a single mean methylation value. We group loci within the same CGI, the same CGI shore or the same CGI shelf, as well as adjacent open sea probes that are within 500 bp of each other. (B) The first row of points shows the midpoints of collapsed open sea clusters. These are grouped into long-range clusters and used for block finding. The second row of points shows all collapsed clusters across all region types with color representing region type
3 RESULTS
3.1 Preprocessing/normalization
To compare preprocessing algorithms, we hybridized the same liver DNA and the same placenta DNA to 58 plates, giving us 124 technical replicates (69 liver and 55 placenta, GEO GSE52731). We then preprocessed these data with Illumina’s default method, SWAN (Maksimovic et al., 2012), BMIQ (Teschendorff et al., 2013), wateRmelon DASEN (Pidsley et al., 2013) and our implementation of stratified quantile normalization (preprocessQuantile) after dropping one low-quality liver sample. To assess precision, we computed the standard deviation across the technical replicates for each probe. Because of the known mean–variance relationship with these measurements, we also computed the average methylation across probes.
We then computed a smoothed curve to summarize the scatterplot of standard deviations versus means for all probes (Fig. 3A and Supplementary Fig. S1) and for probes stratified by region type (Supplementary Fig. S2). Most methods perform similarly, although our preprocessQuantile procedure and DASEN generally outperform other methods in terms of reducing variability among technical replicates. We also performed the analysis on the M-scale to confirm that results were similar (Supplementary Figs. S3 and S4). To confirm that these gains in precision were not due to reduced sensitivity, we compared the across-replicate average difference between liver and placenta (Fig. 3B–E). We also observed that our procedure makes type I and type II loci comparable (Supplementary Fig. S5).
Fig. 3.

Accuracy and precision assessment of preprocessing algorithms. (A) For each locus, we compute the average and standard deviation across liver technical samples. The resulting loess curve fitted to the standard deviation versus average scatterplot for each method is shown. (B) Using the same samples, we compute the average difference between liver and placenta (effect size) for each locus. We then plot the resulting effect sizes for each preprocessing method against effect sizes from the default Illumina procedure
3.2 Quality assessment
We read and processed the raw data from 100 randomly selected individuals from a DNAm study of aging (Hannum et al., 2012) such that men, women, Caucasians and Hispanics were equally represented. We processed these data with the Illumina default procedure. Principal component analysis and multidimensional scaling plots are useful for exploring distances between samples (Leek et al., 2010). A multidimensional scaling plot of the methylation values reveals (not surprisingly) that sex is the biggest source of variability (Fig. 4A). Note that our getSex function automatically classifies the samples into two groups. We compute the median for both Meth and Unmeth signals for each array and display these in a scatterplot (Fig. 4B). This quality control measure clearly identifies two samples as outliers. Notice that >95% of the samples have median log (base 2) intensity values above 11.5. DNAm density plots (Fig. 4C) show that the outlier samples also have a distribution of DNAm values on the beta scale that is different from other samples.
Fig. 4.

Quality assessment plots based on the blood sample dataset. (A) A multidimensional scaling plot. Color represents reported ethnicity. (B) Scatterplot of median Unmeth signal versus median Meth signal value for each sample. Points outside the dashed lines represent cases were the differences are >0.5. (C) Beta density plots for all samples with black curves representing samples where the average of the median Unmeth and Meth is <11.5
3.3 SNPs influence probe behavior in small samples
For the blood data described above, we selected eight 68-year-old individuals. Four of these were Caucasian and four Hispanic. We computed the difference in average methylation between the two ethnicities. Probes with SNPs showed larger differences (Supplementary Fig. S6A). We then found the closest probe to each of these SNP-affected probes and removed any pair separated by >500 bp or where both probes were SNP affected. We observed much larger differences at the SNP-affected probes than at the neighboring probes (Supplementary Fig. S6B).
3.4 Bump hunting differentially methylated regions are more likely to be near a differentially expressed gene than CpGs identified by single probe analysis
We downloaded and preprocessed raw data from 17 normal colon and 19 normal lung TCGA samples. We used preprocessQuantile and normalized all samples together. Note that in this case, batch is confounded with tissue type. We identified differentially methylated loci using single probe analysis to identify differentially methylated positions (DMPs) (Fig. 5B) and bump hunting to identify differentially methylated regions (DMRs) (Fig. 5A). To assess the biological relevance of the two sets of loci, we used the assumption that a subset of differentially expressed genes (DEGs) are epigenetically regulated and associated with changes in DNAm. Therefore, a candidate differentially methylated locus is more likely to be a functionally relevant true positive if it is in proximity to a DEG. We note that this evaluation only considers in cis; it does not assess changes in trans such as methylation changes over distant regulatory regions. In the absence of a dataset where the truth is known, this evaluation provides an objective measure for which we have an a priori expectation.
Fig. 5.
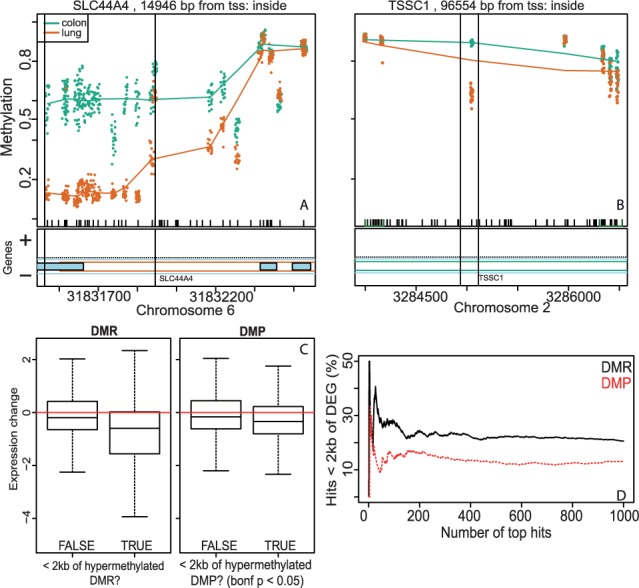
DMRs associate more strongly with gene expression than methylation differences at single CpGs, as observed in a dataset of normal lung and colon samples. (A) An example of a tissue-DMR, identified by bumphunter. The 15 CpGs in the region show concordant methylation differences. (B) An example of a significant tissue-DMP, identified by a locus-level limma model. Note that the CpG probes adjacent to the DMP do not show a methylation difference. (C) Between-tissue differential expression is greater for genes with a DMR located within 2 kb of the transcriptional start site (left) than for genes with a DMP located within 2 kb of the transcriptional start site (right). (D) A greater fraction of DMRs is located close to DEG promoters than are DMPs
We downloaded gene expression data from normal lung [n = 20, Gene Expression Omnibus GSE31210 (Okayama et al., 2012)] and colon samples [n = 54, GEO GSE20916 and GSE41328 (Lin et al., 2006; Skrzypczak et al., 2010)] and preprocessed these with frozen robust multiarray analysis (McCall et al., 2010). We associated genes with methylation loci located within 2 kb of the transcriptional start site. We found that genes located in proximity to hypermethylated DMRs had a larger decrease in expression level than genes located near loci identified through single probe analysis (Fig. 5C). Further, using proximity to a DEG as one metric of functional relevance, we also assessed the fraction of differentially methylated loci located within 2 kb of a DEG transcriptional start site. We used a t-test to test for differential expression between the tissue types and classified probes with a nominal P < 0.05 and a fold-change >1.5 as differentially expressed. We found that regardless of the significance threshold used to identify differentially methylated loci, DEGs were consistently more likely to be located near DMRs than DMPs (Fig. 5D).
3.5 Block finding with 450k can identify hypomethylation blocks
To assess the effectiveness of the block finding method in minfi, we compared blocks identified in colon cancer on the TCGA data (including the cancer samples that go with the normal samples described above) with those reported in (Hansen et al., 2011). Using default parameters (see Section 3 above), we identified 1540 hypomethylation blocks in colon cancer containing five or more collapsed CpG clusters (P < 0.01). Although the regions identified using minfi are based on completely independent colon normal and tumor samples, we found high agreement with methylation blocks identified in Hansen et al. (2011) (Fig. 6A). Specifically, 99.8% of the top 500 regions identified in the TCGA samples using minfi, sorted by area, overlap a block identified in Hansen et al. (2011) by at least 1000 bp (Fig. 6B). Note that Figure 6 shows a gap in the inferred blocks caused by the lack of probes on the array.
Fig. 6.

Large regions of hypomethylation in colon cancer are reliably identified by minfi. We used the block finding method on 450k data for colon cancer and matched normal samples from the TCGA project. The top (A) shows smoothed estimates of average methylation at the collapsed locus level in the region plotted as Figure 2a in Hansen et al. (2011). Loss of methylation in tumor is clearly observed in this region. The second panel shows the methylation difference between cancer and normal. Dots indicate the probe clusters used in the block finder algorithm, which ignores clusters corresponding to CpG islands, shores or shelves. The smoothed methylation difference used for segmentation is also plotted. The gap in this smooth curve results from large genomic distances between probe clusters over which no smoothing is performed. The bottom panel shows the minfi segmentation of the cluster-level measurements, with blue indicating blocks of significant hypomethylation. The bottom track are the blocks of methylation difference defined from whole-genome bisulfite sequencing in Hansen et al. (2011) (B) Hypomethylation regions identified by minfi consistently overlap hypomethylation blocks identified in Hansen et al. (2011)
4 DISCUSSION
We have demonstrated several downstream advantages of using the minfi package. Several preprocessing algorithms are available and the infrastructure provides a convenient way for developers to easily implement their techniques as Bioconductor tools. In our experience, 5–10% of samples are of unusable quality, and visualization utilities provided by minfi permit users to identify these samples at the earliest stage of the analysis. By making SNP annotation available, users can choose to be cautious about probes that may behave unexpectedly due to the inclusion of a SNP in the probe sequence. We have demonstrated that DEGs are more likely to be located near DMRs than CpGs identified by single probe analysis. Existing methods for identifying DMRs typically use fixed-size or dynamic windows to group individually significant DMPs into regions (http://www2.cancer.ucl.ac.uk/medicalgenomics/champ/). Our software is unique in that it provides both bump hunting and block finding capabilities, and the assessment of statistical significance for the identified regions. Finally, because the package is implemented in Bioconductor, it gives users access to the countless analysis and visualization tools available in R.
Supplementary Material
ACKNOWLEDGEMENTS
The authors thank Namyoung Jung, Yun Liu, Carolina Montano, Winston Timp, Arni Runarsson, Rakel Trygvadottir and Amy Vandiver for including the technical replicate samples in their experiments. They also thank them, as well as Rafael Guerrero-Preston, for beta testing.
Funding: NIH (GM083084, GM103552, R01AG042187 and P50HG003233).
Conflict of Interest: none declared.
REFERENCES
- Aryee MJ, et al. Accurate genome-scale percentage DNA methylation estimates from microarray data. Biostatistics. 2011;12:197–210. doi: 10.1093/biostatistics/kxq055. [DOI] [PMC free article] [PubMed] [Google Scholar]
- Berman BP, et al. Regions of focal DNA hypermethylation and long-range hypomethylation in colorectal cancer coincide with nuclear lamina-associated domains. Nat. Genet. 2012;44:40–46. doi: 10.1038/ng.969. [DOI] [PMC free article] [PubMed] [Google Scholar]
- Bibikova M, et al. High density DNA methylation array with single CpG site resolution. Genomics. 2011;98:288–295. doi: 10.1016/j.ygeno.2011.07.007. [DOI] [PubMed] [Google Scholar]
- Bolstad BM, et al. A comparison of normalization methods for high density oligonucleotide array data based on variance and bias. Bioinformatics. 2003;19:185–193. doi: 10.1093/bioinformatics/19.2.185. [DOI] [PubMed] [Google Scholar]
- Chambers JM. Programming with Data: A Guide to the S Language. New York: Springer; 1998. [Google Scholar]
- Dawson MA, Kouzarides T. Cancer epigenetics: from mechanism to therapy. Cell. 2012;150:12–27. doi: 10.1016/j.cell.2012.06.013. [DOI] [PubMed] [Google Scholar]
- Dedeurwaerder S, et al. A comprehensive overview of Infinium HumanMethylation450 data processing. 2013 doi: 10.1093/bib/bbt054. Brief. Bioinform., [Epub ahead of print] [DOI] [PMC free article] [PubMed] [Google Scholar]
- Doi A, et al. Differential methylation of tissue- and cancer-specific CpG island shores distinguishes human induced pluripotent stem cells, embryonic stem cells and fibroblasts. Nat. Genet. 2009;41:1350–1353. doi: 10.1038/ng.471. [DOI] [PMC free article] [PubMed] [Google Scholar]
- Feinberg AP. Phenotypic plasticity and the epigenetics of human disease. Nature. 2007;447:433–440. doi: 10.1038/nature05919. [DOI] [PubMed] [Google Scholar]
- Feinberg AP, Tycko B. The history of cancer epigenetics. Nat. Rev. Cancer. 2004;4:143–153. doi: 10.1038/nrc1279. [DOI] [PubMed] [Google Scholar]
- Gardiner-Garden M, Frommer M. CpG islands in vertebrate genomes. J. Mol. Biol. 1987;196:261–282. doi: 10.1016/0022-2836(87)90689-9. [DOI] [PubMed] [Google Scholar]
- Hannum G, et al. Genome-wide methylation profiles reveal quantitative views of human aging rates. Mol. Cell. 2012;49:359–367. doi: 10.1016/j.molcel.2012.10.016. [DOI] [PMC free article] [PubMed] [Google Scholar]
- Hansen KD, et al. Increased methylation variation in epigenetic domains across cancer types. Nat. Genet. 2011;43:768–775. doi: 10.1038/ng.865. [DOI] [PMC free article] [PubMed] [Google Scholar]
- Irizarry RA, et al. Comprehensive high-throughput arrays for relative methylation (CHARM) Genome Res. 2008;18:780–790. doi: 10.1101/gr.7301508. [DOI] [PMC free article] [PubMed] [Google Scholar]
- Jaffe AE, et al. Bump hunting to identify differentially methylated regions in epigenetic epidemiology studies. Int. J. Epidemiol. 2012;41:200–209. doi: 10.1093/ije/dyr238. [DOI] [PMC free article] [PubMed] [Google Scholar]
- Krueger F, et al. DNA methylome analysis using short bisulfite sequencing data. Nat. Methods. 2012;9:145–151. doi: 10.1038/nmeth.1828. [DOI] [PubMed] [Google Scholar]
- Leek JT, et al. Tackling the widespread and critical impact of batch effects in high-throughput data. Nat. Rev. Genet. 2010;11:733–739. doi: 10.1038/nrg2825. [DOI] [PMC free article] [PubMed] [Google Scholar]
- Lin G, et al. Reproducibility Probability Score–incorporating measurement variability across laboratories for gene selection. Nat. Biotechnol. 2006;24:1476–1477. doi: 10.1038/nbt1206-1476. [DOI] [PubMed] [Google Scholar]
- Maksimovic J, et al. SWAN: Subset-quantile within array normalization for illumina infinium HumanMethylation450 BeadChips. Genome Biol. 2012;13:R44. doi: 10.1186/gb-2012-13-6-r44. [DOI] [PMC free article] [PubMed] [Google Scholar]
- Marabita F, et al. An evaluation of analysis pipelines for DNA methylation profiling using the Illumina HumanMethylation450 BeadChip platform. Epigenetics. 2013;8:333–346. doi: 10.4161/epi.24008. [DOI] [PMC free article] [PubMed] [Google Scholar]
- McCall MN, et al. Frozen robust multiarray analysis (fRMA) Biostatistics. 2010;11:242–253. doi: 10.1093/biostatistics/kxp059. [DOI] [PMC free article] [PubMed] [Google Scholar]
- McCall MN, et al. Assessing affymetrix GeneChip microarray quality. BMC Bioinformatics. 2011;12:137. doi: 10.1186/1471-2105-12-137. [DOI] [PMC free article] [PubMed] [Google Scholar]
- Okayama H, et al. Identification of genes upregulated in ALK-positive and EGFR/KRAS/ALK-negative lung adenocarcinomas. Cancer Res. 2012;72:100–111. doi: 10.1158/0008-5472.CAN-11-1403. [DOI] [PubMed] [Google Scholar]
- Pidsley R, et al. A data-driven approach to preprocessing Illumina 450K methylation array data. BMC Genomics. 2013;14:293. doi: 10.1186/1471-2164-14-293. [DOI] [PMC free article] [PubMed] [Google Scholar]
- Price ME, et al. Additional annotation enhances potential for biologically-relevant analysis of the Illumina Infinium HumanMethylation450 BeadChip array. Epigenetics Chromatin. 2013;6:4. doi: 10.1186/1756-8935-6-4. [DOI] [PMC free article] [PubMed] [Google Scholar]
- Rakyan VK, et al. Epigenome-wide association studies for common human diseases. Nat. Rev. Genet. 2011;12:529–541. doi: 10.1038/nrg3000. [DOI] [PMC free article] [PubMed] [Google Scholar]
- Skrzypczak M, et al. Modeling oncogenic signaling in colon tumors by multidirectional analyses of microarray data directed for maximization of analytical reliability. PLoS One. 2010;5:e13091. doi: 10.1371/journal.pone.0013091. [DOI] [PMC free article] [PubMed] [Google Scholar]
- Teschendorff AE, et al. A beta-mixture quantile normalization method for correcting probe design bias in Illumina Infinium 450 k DNA methylation data. Bioinformatics. 2013;29:189–196. doi: 10.1093/bioinformatics/bts680. [DOI] [PMC free article] [PubMed] [Google Scholar]
- Touleimat N, Tost J. Complete pipeline for Infinium((R)) Human Methylation 450K BeadChip data processing using subset quantile normalization for accurate DNA methylation estimation. Epigenomics. 2012;4:325–341. doi: 10.2217/epi.12.21. [DOI] [PubMed] [Google Scholar]
- Triche TJ, Jr, et al. Low-level processing of Illumina Infinium DNA Methylation BeadArrays. Nucleic Acids Res. 2013;41:e90. doi: 10.1093/nar/gkt090. [DOI] [PMC free article] [PubMed] [Google Scholar]
- Wang D, et al. IMA: an R package for high-throughput analysis of Illumina's 450K Infinium methylation data. Bioinformatics. 2012;28:729–730. doi: 10.1093/bioinformatics/bts013. [DOI] [PMC free article] [PubMed] [Google Scholar]
- Wessely F, Emes RD. Identification of DNA methylation biomarkers from Infinium arrays. Front. Genet. 2012;3:161. doi: 10.3389/fgene.2012.00161. [DOI] [PMC free article] [PubMed] [Google Scholar]
- Wu Z, Aryee MJ. Subset quantile normalization using negative control features. J. Comput. Biol. 2010;17:1385–1395. doi: 10.1089/cmb.2010.0049. [DOI] [PMC free article] [PubMed] [Google Scholar]
- Yousefi P, et al. Considerations for normalization of DNA methylation data by Illumina 450K BeadChip assay in population studies. Epigenetics. 2013;8:1141–1152. doi: 10.4161/epi.26037. [DOI] [PMC free article] [PubMed] [Google Scholar]
- Zhi D, et al. SNPs located at CpG sites modulate genome-epigenome interaction. Epigenetics. 2013;8:802–806. doi: 10.4161/epi.25501. [DOI] [PMC free article] [PubMed] [Google Scholar]
Associated Data
This section collects any data citations, data availability statements, or supplementary materials included in this article.