Abstract
The aortic dissection (AoD) of an ascending thoracic aortic aneurysm (ATAA) initiates when the hemodynamic loads exerted on the aneurysmal wall overcome the adhesive forces holding the elastic layers together. Parallel coupled, two-way fluid–structure interaction (FSI) analyses were performed on patient-specific ATAAs obtained from patients with either bicuspid aortic valve (BAV) or tricuspid aortic valve (TAV) to evaluate hemodynamic predictors and wall stresses imparting aneurysm enlargement and AoD. Results showed a left-handed circumferential flow with slower-moving helical pattern in the aneurysm's center for BAV ATAAs whereas a slight deviation of the blood flow toward the anterolateral region of the ascending aorta was observed for TAV ATAAs. Blood pressure and wall shear stress were found key hemodynamic predictors of aneurysm dilatation, and their dissimilarities are likely associated to the morphological anatomy of the aortic valve. We also observed discontinues, wall stresses on aneurysmal aorta, which was modeled as a composite with two elastic layers (i.e., inhomogeneity of vessel structural organization). This stress distribution was caused by differences on elastic material properties of aortic layers. Wall stress distribution suggests AoD just above sinotubular junction. Moreover, abnormal flow and lower elastic material properties that are likely intrinsic in BAV individuals render the aneurysm susceptible to the initiation of AoD.
Keywords: Fluid–structure interaction, Aortic dissection, Ascending thoracic aortic aneurysm, Bicuspid aortic valve
1. Introduction
Aortic dissection (AoD) is defined as the progressive separation of the layers of the thoracic aortic wall. Specifically, an intimal tear typically originates above the sinotubular junction (STJ) by permitting the blood to enter the aortic wall and progressively separating the medial plane along the axial direction of the aorta. Although AoD is pathologically distinct from ascending thoracic aortic aneurysm (ATAA), thoracic aneurysms are prone to developing dissection (Davies, 1998; Ince and Nienaber, 2007). A cause of difficulties in diagnosis, reported rates of 3–4 cases per 100,000 persons per year are probably underestimates of the true incidence of AoD. The morbidity risk for emergent surgery remains 24% worldwide according to data from the International Registry of Acute Aortic Dissection (Rampoldi et al., 2007).
Patients with ATAA frequently have bicuspid aortic valve (BAV) that is the most common heart defect (Ward, 2000) compared with the morphological, normal tricuspid aortic valve (TAV), even when matched for the degree of aortic stenosis or regurgitation (Hahn et al., 1992). An association between ATAA and BAV has been confirmed in numerous studies (Cripe et al., 2004; Keane et al., 2000). Furthermore, BAV individuals (1–2% of the population) with thoracic aneurysms have 9-fold higher risk of AoD (Davies et al., 2002).
The most relevant theory on the pathogenesis of ATAA associated to BAV suggests that a genetic or developmental defect in the proximal aortic tissue leads to weakness of aortic wall, thus imparting the risk of aneurysm formation (Milewicz et al., 2008). However, a flow-mediated mechanism for aneurysm dilatation should not be ruled out. Indeed, there are echocardiographic observations of increased blood systolic velocities at the aneterolateral region of the ascending aorta (AoA) in patients with BAV (Bauer et al., 2006) and specific segments of ATAA varing with the type of aortic valve leaflet fusion (Fazel et al., 2008) that cannot be easily explained by a genetic theory alone. Additionally, BAV ATAA typically bulge asymmetrically toward the right, greater curvature of the aorta, and this is possibly explained by abnormal flow patterns developing in individuals with BAV as observed by time-resolved three-dimensional phase-contrast MR imaging (also know as four-dimensional (4D) flow MR imaging). Hemodynamic disturbances may therefore engender elevated wall stresses and promote aortic dilatation (den Reijer et al., 2010; Hope et al., 2010, 2011; Weigang et al., 2008).
From a biomechanical prospective, AoD is a separation of the elastic layers of the degenerated aortic wall that occurs when the hemodynamic loads exerted on the aneurysmal wall exceed bonding forces that normally hold the mural layers together (Pasta et al., 2012; Rajagopal et al., 2007). Biomechanical studies demonstrated that maximum aortic diameter fails to predict rupture or dissection especially for small-sized ATAAs (McGloughlin and Doyle, 2010); therefore, predictors other than aortic size are needed to prevent aneurysm disease. Thus, computational fluid–solid interaction (FSI) analysis represents a valid finite element (FE) technique to investigate simultaneously the relevant hemodynamic and mechanical forces underlying the mechanics of AoD in ATAAs. FSI was used in several patient-specific simulations to study aortic aneurysms (Khanafer and Berguer, 2009; Molony et al., 2009).
The purpose of the present investigation was therefore to assess if difference exists on hemodynamic and wall stress arising in ATAAs. We speculate that the difference in both elastic properties of aortic layers and aortic valve morphology (BAV vs. TAV) influence directly the risk of AoD in ATAAs.
2. Material and methods
2.1. Geometry
Electrocardiogram (ECG)-gated computed tomography angiography (CTA) scans were used to reconstruct ATAA geometries identified from radiologic records of Mediterranean Institute for Transplantation and Advanced Specialized Therapies (IsMeTT). The study was approved by the local research ethics committee. Specifically, we segmented ATAAs of three patients with TAV and two patients with BAV which demographic data, BAV type, history of hypertension and presence of aortic stenosis or aortic insufficiency are reported in Table 1.
Table 1.
Clinical data of patients used for FSI analysis. Type 1 R/N BAV indicates fusion of right and non-coronary aortic leaflets while Type 0 BAV indicates a purely bicuspid with two symmetric leaflets.
| Patient ID | Valve | Leaflet fusion | Aneurysm diameter (mm) | Age (year) | Sex | History of hypertension | Aortic stenosis | Aortic insufficiency |
|---|---|---|---|---|---|---|---|---|
| (A) | BAV | Type 1 R/N | 57 | 48 | Male | |||
| (B) | BAV | Type 0 | 41 | 68 | Male | Yes | ||
| (C) | TAV | 39 | 62 | Male | ||||
| (D) | TAV | 44 | 68 | Female | ||||
| (E) | TAV | 45 | 76 | Female | Severe | Severe |
ECG-gated CTA scans were retro-reconstructed to obtain images at cardiac phase with the largest aortic valve opening area, which frequently occurs at 50–100 milliseconds after the R peak (Abbara et al., 2007). Reconstruction was therefore performed with the shape of aortic valve fully opened. ATAA geometries were reconstructed using the vascular modeling toolkit VMTK (http://www.vmtk.org). Images were segmented from the aortic valve, through the ascending aorta, the aortic arch and supra-aortic vessels and the descending aorta, ending at the level of the diaphragm. ATAA models were then exported to GAMBIT v2.3.6 (ANSYS Inc., Canonsburg, PA) for meshing both fluid (lumen) and structural (aneurysm wall) domains.
2.2. Fluid – structure interaction
Parallel coupled two-way FSI analyses were performed using the commercial software MpCCI v4.2 (Fraunhofer SCAI, Germany) to couple the structural component, ABAQUS v6.12 (SIMULIA Inc, Providence, RI), and the fluid solver, FLUENT v14.0.0 (ANSYS Inc., Canonsburg, PA). Fluid time step was set to 0.0068 s and data exchange occurred every time step with FLUENT sending the fluid-induced wall forces to ABAQUS, and ABAQUS sending the deformed nodal coordinates to FLUENT. Wall forces also include the frictional component induced by the fluid on the aortic wall, which causes the origin of the fluid shear stress. Transient simulations were accomplished after a total time of 0.68 s (i.e., 100nd time steps).
Both codes share a common boundary surface where the data exchange occurs. The MpCCI algorithm, which allows for non-matching meshes, identifies nodes or elements near each other based on an association scheme, and data are then transferred from one node to the other (Fraunhofer, 2008).
2.3. Structural model
ATAA wall was modeled as a hyperelastic, layered, incompressible and isotropic material, whose mechanical properties were derived from previously published experimental data (Pasta et al., 2012). Following delamination of ATAA tissue samples, tensile tests on the delaminated halves were performed to evaluate the elastic stress-stretch response of the outer (adventitia and dissected media) and inner (intima and dissected media) layers of the dissected aortic wall. Thus, the data sets were fit using the constitutive model developed by Raghavan and Vorp (2000) for modeling the human aorta:
In these formulation, W represents the strain energy, IB is the strain invariant of Left Cauchy-Green tensor while α and β are the model material parameters of the mechanical properties of ATAA wall layers.
Wall thicknesses were 1 mm and 0.7 mm for outer layer and inner layer, respectively, as measured experimentally (Pasta et al., 2012). Material nonlinearities due to large deformation were considered using Dynamic/Implicit formulation in ABAQUS FE software. ATAAs were meshed with triangular elements whereas tie contact conditions were used between outer and inner layers. For the aneurysmal wall, the structural density was 1120 kg/m3. For the aorta to deform in a physiological way, the distal ends of supra-aortic vessels, aortic valve and descending aorta were fixed in all directions. The luminal surface of inner layer was used to exchange data with FLUENT. The aortic valve leaflets were assumed rigid which geometry was obtained from ECG-gated CTA images at cardiac phase with the largest valve opening area.
2.4. Fluid model
Transient-time solver with 2nd order implicit time advanced scheme was used for fluid dynamic simulations. The blood flow was assumed laminar, incompressible and Newtonian with density of 1060 kg/m3 and viscosity of 0.00371 Pa × s. Continuity equation and linearized momentum equations were solved sequentially by a segregated algorithm (Pekkan et al., 2008). Pressure-implicit with splitting of operators (PISO) and skewness correction was set as pressure–velocity coupling algorithm to improve the convergence of the transient calculations in close vicinity of distorted cells. To eliminate numerical diffusion in calculations, 2nd order upwind scheme is applied to discretize the convective terms in momentum equations. Pressure staggering option (PRESTO) scheme as pressure interpolation method was set with 2nd order accurate discretization. Convergence was enforced by reducing the residual of the continuity equation by 10−5 at all time steps.
The total cardiac output was assumed at 5 L/min, and this flow was distributed between the supra-aortic vessels and the descending aorta with a ratio of 40/60 (Pekkan et al., 2008). Based on these assumptions, inlet aortic flow velocity and pressure boundary conditions were calculated at inlet and outlets, which were also extended six diameters normal to the vessel cross-section.
Dynamic mesh with smoothing and remeshing options were set at luminal ATAA wall surface to allow data exchange with ABAQUS. In FLUENT, remeshing of cells was adopted to handle with deforming mesh. Specifically, tetrahedral cells were remeshed based on whether they violate a user specified size and skewness criteria (i.e., 3% of the initial size or skewness lower than 0.75).
3. Results
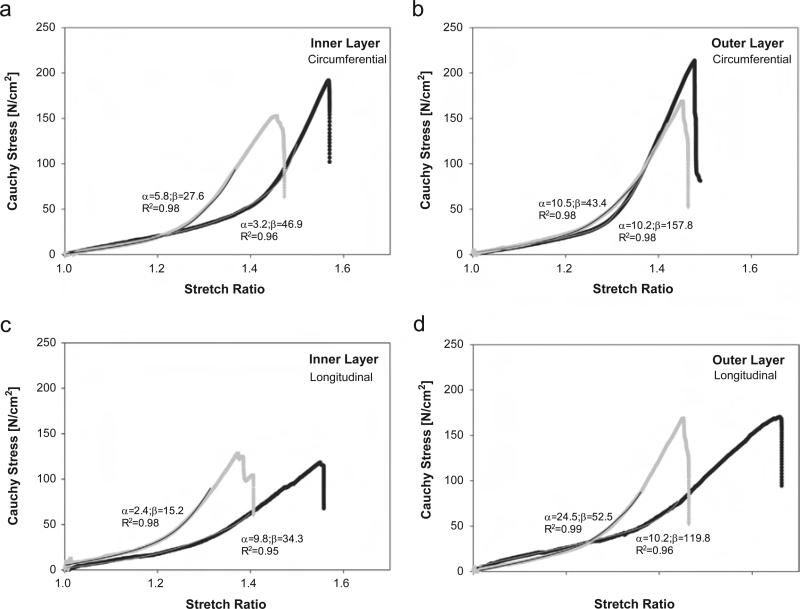
Representative tensile stress-stretch responses of both inner and outer layers of ATAAs are shown for both BAV ATAA and TAV ATAA (Fig. 1). The biomechanical model suits reasonably the stress-stretch data for all specimens analyzed (R2>.95). Table 2 summarizes the material parameters for both TAV ATAAs and BAV ATAAs. The mean values of α and β for both inner and outer layers were not significantly different between BAV ATAA and TAV ATAA.
Fig. 1.
Representative tensile stress-stretch response for inner and outer layer of ATAAs with BAV (black dot) and TAV (gray dot); individual material parameters and determination coefficient are reported for each curve.
Table 2.
Population mean values of material parameters obtained by fitting experimental data of all tensile tests on the inner and outer layers of ATAAs and used for FSI modeling. Material parameters are valid for stretch ratio below 1.3 for TAV ATAA and 1.45 for BAV ATAA, respectively. Data are mean ± SEM.
| Inner layer |
Outer layer |
|||
|---|---|---|---|---|
| α [N/cm2] | β [N/cm2] | α [N/cm2] | β [N/cm2] | |
| BAV ATAA (n = 10) | 7.6 ± 2.8 (R2 = 0.96) | 48.7 ± 9.4 (R2 = 0.95) | 14.9 ± 5.6 (R2 = 0.98) | 158.1 ± 15.8 (R2 = 0.97) |
| TAV ATAA (n = 7) | 2.4 ± 1.0 (R2 = 0.96) | 34.5 ± 8.9 (R2 = 0.97) | 12.1 ± 6.1 (R2 = 0.97) | 59.5 ± 13.8 (R2 = 0.98) |
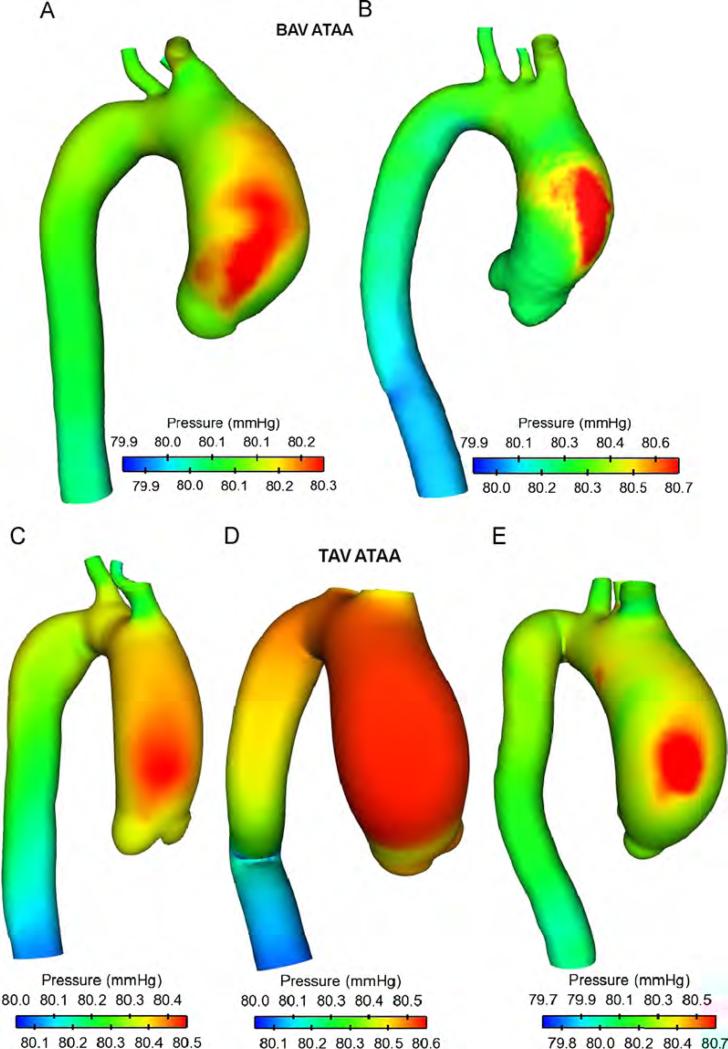
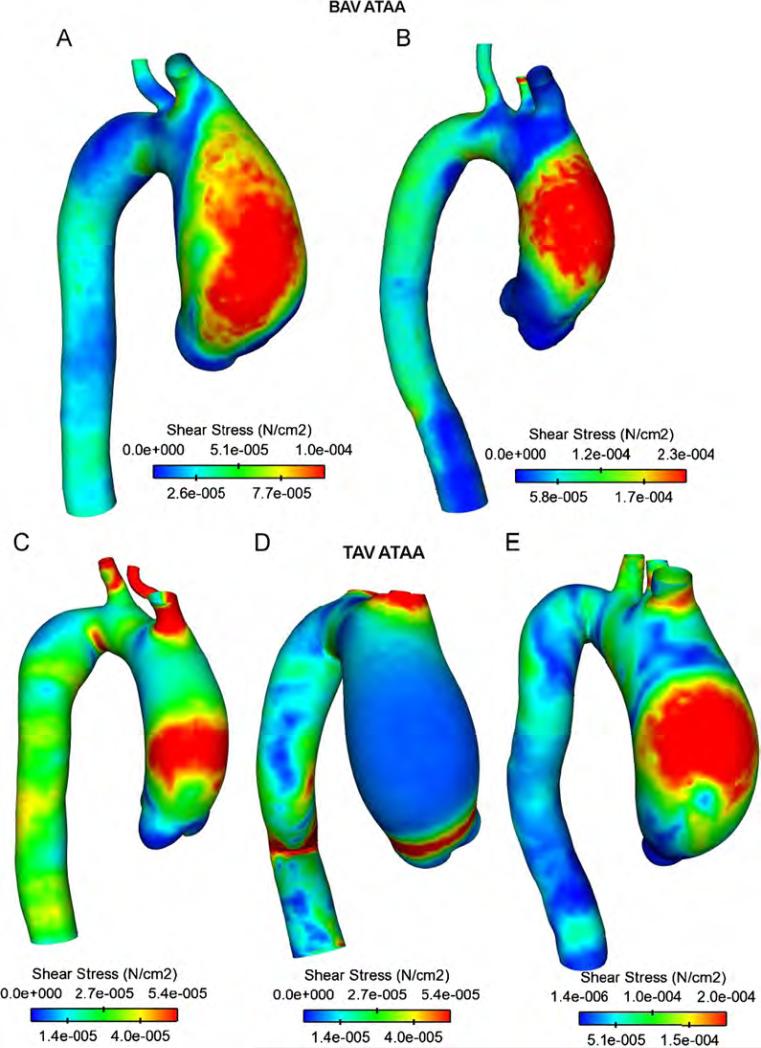
Maps of blood pressure for ATAA patients showing high blood pressure over cardiac cycle in the ascending aorta (AoA) close to the convex, greater curvature of the aneurysmal wall (Fig. 2). No remarkable difference was observed between BAV and TAV except for patient (D) in which blood pressure distributed uniformly on aneurysmal ascending aorta. The sites of maximum wall shear stress (WSS) were observed in the anterolateral region of AoA where high blood pressure occurred (Fig. 3). Specifically, regions of peak WSS for BAV ATAAs appeared more extended than those of patients with TAV. Increasing gradients of both blood pressure and WSS were also observed from the aortic valve to the aneurysmal ascending aorta except for patient (D) for which peak values of WSS were found close to STJ. These hemodynamic disturbances suggest that anterolateral region of aneurysmal aorta is critical for aneurysm development and enlargement.
Fig. 2.
Comparison of time-averaged blood pressure distribution for ATAA patients with BAV (top two models) and TAV (bottom three models).
Fig. 3.
Comparison of fluid shear stress for ATAA patients with BAV (top two models) and TAV (bottom three models).
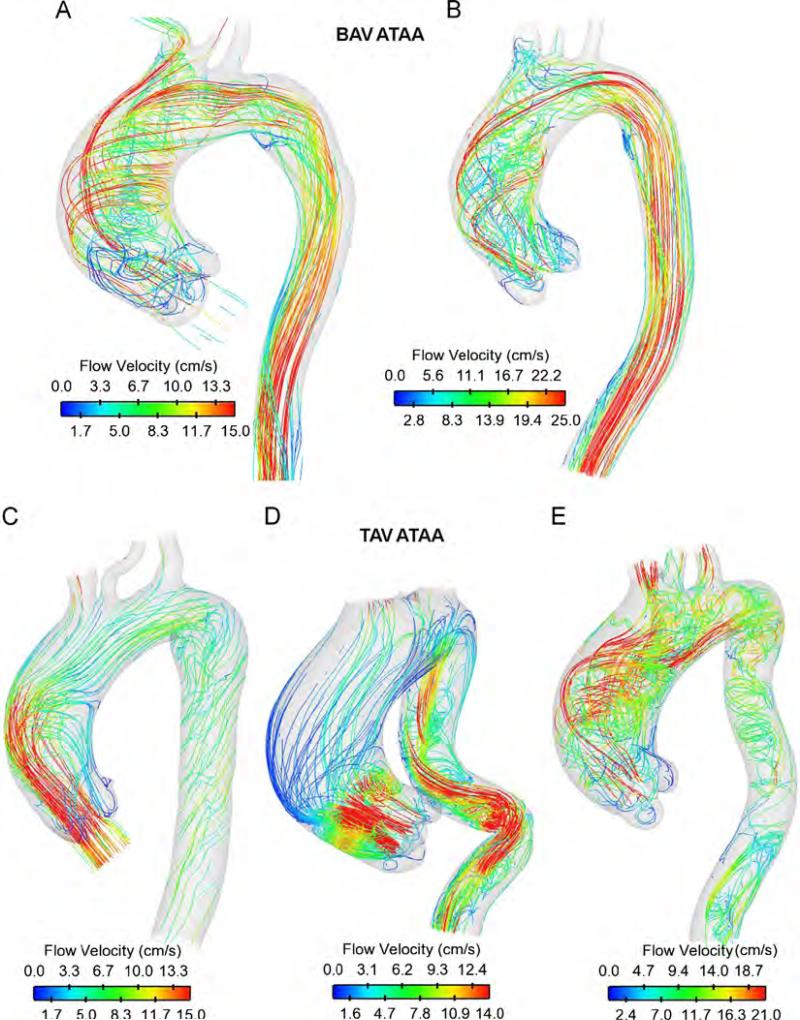
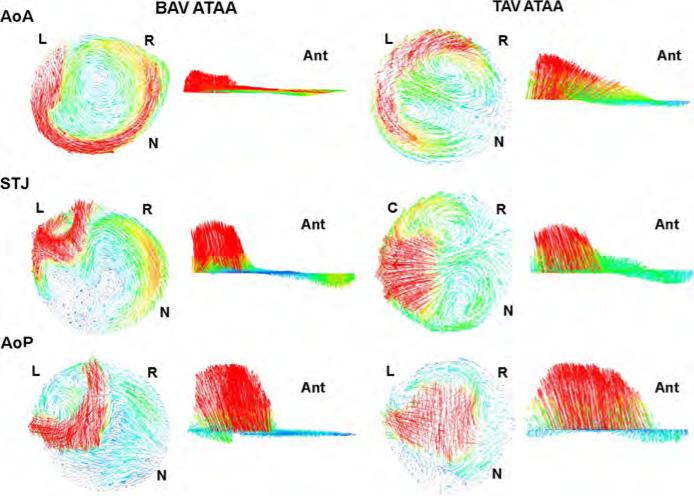
Hemodynamic characteristics for both TAV ATAAs and BAV ATAAs are illustrated by streamlines (Fig. 4) whereas vector analyses at three commonly used anatomical levels (i.e., aortic valve plane (AoP), STJ and AoA) are shown only for patients (A) and (C) (Fig. 5). For both patients (C) and (D) with non-stenotic TAV, parallel streamlines spanned the aneurysmal ascending aorta with minimal deviance from the initial direction of the aortic valve flow and slight degree of flow skewing close to the greater curvature of AoA (Figs. 4 and 5). Slow, minimally helical flow was seen in AoP (Fig. 5 for patients (C)). Additionally, the high blood flow velocity was manifested at same mid-ascending aortic location where the high blood pressure and WSS occurred (compare Fig. 4 with Figs. 2 and 3). In a different way, BAV ATAAs exhibited left-handed nested helical flows in the ascending thoracic aorta (Figs. 4 and 5), which are similar to those shown by Hope et al. (2010) using 4D flow MR imaging. Abnormal flow pattern in which streamlines wrapped back toward the aortic valve was observed at AoP for patient (A) with BAV (Fig. 5). Using qualitative visual criteria suggested by Sigovan et al. (2011), we observed mild flow eccentric flow at AoP and marked eccentric flow at STJ and AoA for patient (A) with BAV (see Table 3). Abnormal secondary flow pattern was marked for BAV ATAAs and TAV ATAA with severe aortic stenosis and regurgitation but not exhibited by patients with fully opened TAV (i.e, both patients (C) and (D)).
Fig. 4.
Streamlines of blood velocity over cardiac cycle for ATAA patients with BAV (top two models) and TAV (bottom three models).
Fig. 5.
Vector analysis at AoP, STJ and AoA anatomical levels for ATAA patient (A) with BAV and ATAA patient (C) with TAV; L=left-coronary artery, R=left-coronary artery, N=non-coronary artery and Antanterior direction.
Table 3.
Hemodynamic predictors and wall stress at three commonly used anatomical levels of anterolateral region of aneurysmal aorta. ATAA flow was graded as normal, mildly or markedly eccentric based on qualitative visual criteria suggested by Sigovan et al. (2011).
| BAV |
TAV |
|||||
|---|---|---|---|---|---|---|
| AoA | STJ | AoP | AoA | STJ | AoP | |
| Flow eccentricity | Marked | Marked | Mild | Mild | Normal | Normal |
| Pressure (mmHg) | 80.52 | 80.45 | 80.37 | 80.45 | 80.38 | 80.32 |
| WSS (N/cm2) | 8.2e–5 | 7.8e–5 | 6.5e–5 | 5.4e–5 | 3.0e–5 | 1.5e–5 |
| WPS (N/cm2) | 28 | 42 | 23.3 | 23 | 30 | 18 |
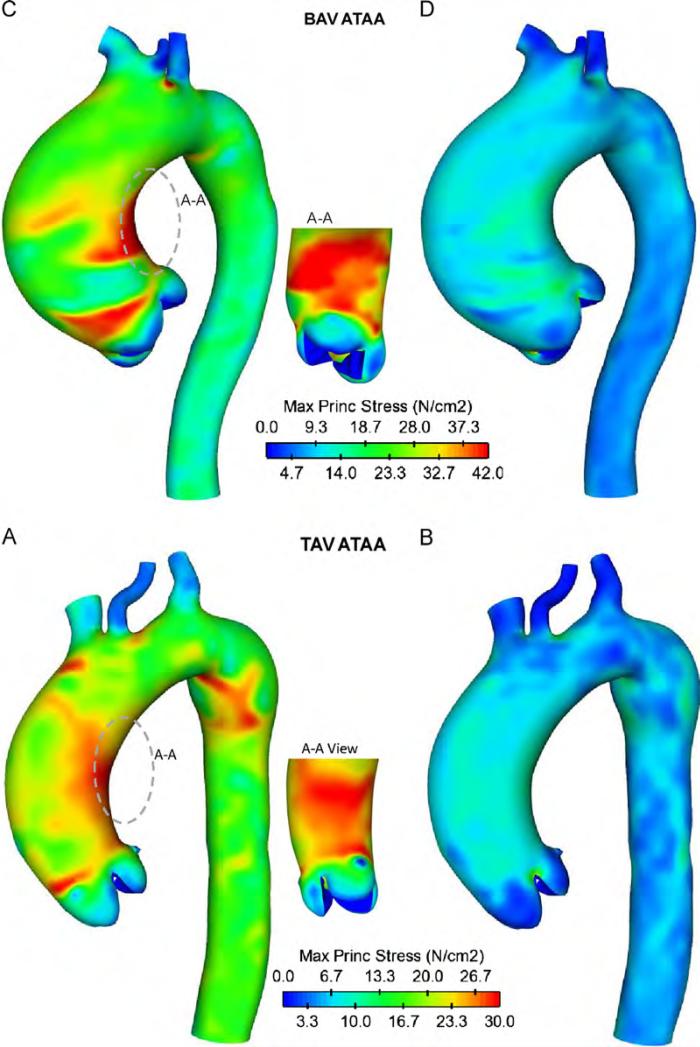
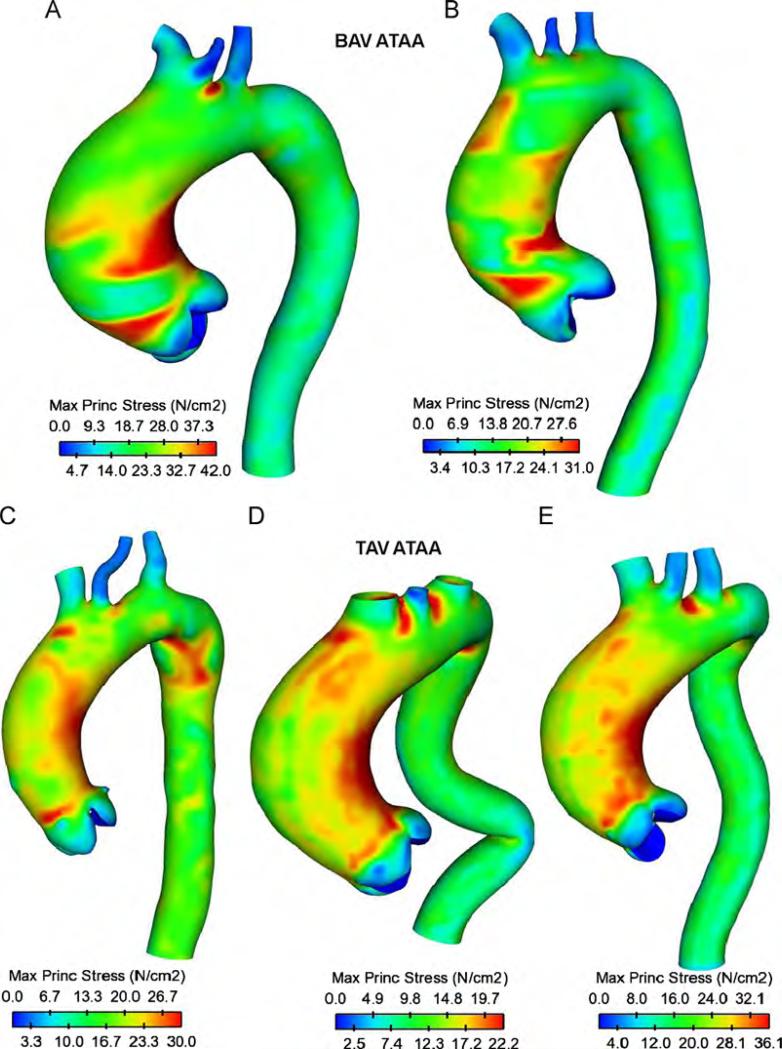
For inner aortic layer of patients (A) and (C), local maxima of wall principal stress (WPS) were found higher than that of outer layer (WPS=30 N/cm2 for inner layer and WPS 8.5 N/cm2 for outer layer of patient (C) Fig. 6). Patient (A) with BAV exhibited similar, but higher WPS than patient (C) with TAV (WPS=42 N/cm2 for inner layer and WPS=30 N/cm2 for outer layer of BAV ATAA Fig. 5C and D). These findings suggest that the stress is discontinuous at the interface between aortic layers in the two-layered ATAA model due to differences in material properties, and this will most commonly result in tearing of the aorta. Similar stress discontinuities between inner and outer layers were found for all patients with either BAV and TAV. Local maxima of wall stress occurred on either the anterolateral or posterolateral regions of the ascending aorta, but stresses on the greater curvature side tended to be slightly greater than those of smaller side. Local maxima of WPS occurred just above STJ where type A dissection frequently occurs. High wall stresses (WPS=27.5 N/cm2 for BAV ATAA and WPS=25.5 N/cm2 for TAV ATAA at inner layers) were also observed in theaortic arch distal to the ostia of the supra-aortic vessels where type B dissections frequently occur (Conrad and Cambria, 2008). This elevated stress region is most likely due to a stress concentration effect. Similar stress distributions at inner aortic layer were found for all ATAA patients with either BAV or TAV (Fig. 7). Findings suggest that stresses just above STJ for patients with BAV appear slightly higher than those of patients with TAV, suggesting a greater risk of AoD among patients with BAV (average WPS=36.5 N/cm2 for BAV ATAAs and average WPS=29.4 N/cm2 for TAV ATAAs).
Fig. 6.
Comparison of maximum principal stress for ATAA patient (A) with BAV and ATAA patient (C) with TAV at inner layer (left models) and outer layer (right models).
Fig. 7.
Comparison of maximum principal stress for ATAA patients with BAV (top two models) and TAV (bottom three models) at inner aortic layer.
Table 3 summarizes the values of hemodynamic predictors and wall stress at AoP, STJ and AoA of anterolateral aortic region for representative patients (A) and (C) with BAV and TAV, respectively.
4. Discussion
The current research uses FSI computational modeling to quantify the role of both aortic valve morphology (BAV vs. TAV) and material properties on hemodynamic and wall stress developing in patients with ATAAs. Specifically, hemodynamic predictors (i.e., blood pressure, flow patterns and WSS) were estimated to identify pathological disturbances leading to vessel dilatation and aneurysm development whereas wall stress (i.e., WPS) was estimated to understand mechanical factors that render the aorta susceptible to the initiation of AoD. Our results suggest that high hemodynamic stress and intrinsic aortic flow characterizing BAV predispose the aneurysmal aorta to an asymmetric, high wall stress distribution. Nevertheless, the discontinuity of wall stress at layer interface is caused by difference in elastic material properties of aortic layers, suggesting tearing of the aneurysmal aorta above STJ.
Although the material parameters of both inner and outer layers were not found significantly different between BAV and TAV, recent studies suggest that the mechanical behavior of the aneurysmal aorta is different along longitudinal direction compared to circumferential direction. Indeed, tensile testing performed on aortic layers extracted from both anterolateral and posterolateral region of aneurysmal aorta revealed that the media and adventitia are stronger circumferentially than longitudinally (Sokolis et al., 2012a, 2012b). It has been also reported that the Fung-type, anisotropic constitutive model provides appropriate description of the mechanical response of the ascending aorta.
The left-handed circumferential flow and slower-moving helical flow in the aneurysm's center found for BAV ATAAs (see Fig. 3) were common features to those reported by Hope and collaborators in a cohort of BAV individuals (Hope et al., 2010). They also documented left-handed helical flows only in patients with right-noncoronary leaflet fusion and normal flow in patients with non-stenotic TAV as found in this study. Aneurysms from individuals with TAV and aortic stenosis and regurgitation manifest abnormal flow patterns (compare patient (E) with patients (A) or (B) in Fig. 4), which are similar to those of BAV individuals (Hope et al., 2010). We also observed eccentric blood flow jet angle in BAV, and this is more marked at the more distal level of AoA (see Fig. 5 at STJ and AoA) where magnitudes of both blood pressure and WSS were found highest (Figs. 2 and 3). These results favor the hypothesis that intrinsic flow abnormalities associated with BAV are directly implicated in the development of aortic enlargement, and that enlargement is not solely a manifestation of a connective tissue disorders. Indeed, a significant correlation between nested helical flow and presence of BAV was found in several studies which used 4D flow MR imaging to assess blood flow at peak systole in the aneurysmal aorta with either TAV or BAV (den Reijer et al., 2010; Hope et al., 2010; Weigang et al., 2008). However, 4D flow MR imaging does not allow to evaluate noninvasively relevant hemodynamic predictors such as the WSS and blood pressure, which are instead predicted by our computational modeling technique. The latter highlighted high WSS and blood pressure at anterolateral region of AoA that may be linked to early smooth muscle cell apoptosis or changes to extracellular matrix protein expression (Dolan et al., 2011), suggesting aneurysm dilatation. In patients with non-stenotic TAV, the deviation of blood flow toward the AoA convexity is expected based on the normal offset of axes between the left ventricle and aortic root and explain the increase of both blood pressure and WSS in anterolateral region versus posterolateral region. This asymmetry is magnified in the patient with BAV for which the unequal-sized aortic leaflet dislocate flow, to varying degree, away from the aortic center by increasing both blood pressure and WSS in the right-anterolateral region of the aneurysmal aorta. Ultimately, these findings suggest that abnormal blood flow and hemodynamic indicators may predispose patients to aneurysm development, and that dissimilarities are likely due to the pathological, different valve morphology.
To our knowledge, this is the first biomechanical investigation taking into account a layered aorta with material properties derived by tensile testing on artificially dissected ATAA tissues. Our findings suggest that the region above STJ manifests a wall stress distribution at inner layer rather higher than that of outer layer. This is due to a lower tensile strength of the layer formed by the intima and dissected media than that made by the adventitia and dissected media (see Fig. 6). The increased wall stresses found above STJ are consistent with clinical observation of type A dissections (Bickerstaff et al., 1982). Additionally, the wall stress distribution at inner layer is more remarkable for BAV ATAAs rather than TAV ATAAs, and this is likely caused by significantly altered biomechanical properties of BAV ATAAs (Pasta et al., 2012). Thus, when the difference in the wall stress between aortic layers increases, and if it attains a critical value, the interface starts to delaminate (i.e, to dissect). Previous studies (Beller et al., 2004; Nathan et al., 2011) have neglected the importance of the structural organization of the aorta as a composite with different elastic layers (i.e., inhomogeneity) held together via adhesive forces that ensure the structural integrity of the aorta. As recently suggested by Rajagopal et al. (2007), if the aorta is assumed to be homogeneous and isotropic as it was assumed in other studies on ATAAs (Beller et al., 2004; Nathan et al., 2011; Thubrikar et al., 1999), then the stress due to hemodynamic loads (see Table 3) cannot engender stresses that are necessary for tearing the aneurysmal aorta. If on the other hand the aorta is anisotropic and layered and thus inhomogeneuos, it may occur that the hemodynamic loads exerted on the aneurysmal wall overcome the adhesive forces holding the aortic layers together by imparting the initiation of dissection. Additionally, the difference in the elastic properties of aortic layers contributes considerably to increase the discontinuity of wall stresses at layer interface just as composites can fail due to elevated interlaminar stress portending delamination.
The main limitation of the present methodology is that the ATAA was assumed as an isotropic body by neglecting the influence of normal and shear stresses generated by the anisotropic, non-linearly viscoelastic aortic wall. Indeed, the aortic layers are not homogenous, and this may determine difference in the evaluation of WPS using FE modeling (Sokolis et al., 2012b). Furthermore, this study adopts uniform thickness and equal material properties of aortic wall for all portions of the aneurysmal aorta, and this may change the wall stress distribution in the aortic wall. Indeed, several studies demonstrated evidences of regional differences in the elastic and failure properties of ATAAs as well as non-uniform distribution of tissue thickness (Choudhury et al., 2009; Duprey et al., 2010; Iliopoulos et al., 2009). Residual stress may also alter the stress discontinuities between aortic layers (Okamoto et al., 2002). For these reasons, future work will consider the use of Fung-type, anisotropic constitutive model for the aneurysmal aorta, including all aortic layers, by using data recently reported in literature (Sokolis et al., 2012b). Regional differences in material properties will be also considered.
We conclude that hemodynamic and wall stress act synergically on the onset of dissection in ATAAs, and that difference in valve morphologies and elastic material properties contributes in the development of abnormal flow and discontinous, high wall stress on aortic layers. Specifically, elevated blood pressure and WSS due to abnormal flow found in this study at AoA may induce to disruption of layering and formation of cellular forces between and within aortic layers (i.e., initiation of a defect). These may degenerate successively in AoD at the interface of aortic layers when the wall stress attains a critical value, which is magnified by difference in biomechanical material properties (i.e., weakening of structural integrity of aortic wall layers due to predisposing disorders to aneurysm growth).
Acknowledgments
The authors thank Mr. Armando Pasta of IsMeTT for his technical assistance with image acquisition and Professor Fabrizio Micari for his guidance and help with FE modeling. This research was funded by a grant from Fondazione RiMED provided to Dr. Pasta and Prof.
Micari. Dr Pasta also acknowledges the Italian Ministry of Education, University and Research for supporting his research.
Footnotes
Conflict of interest statement
The authors did not have any financial and personal relationships with other people or organizations that could inappropriately influence (bias) their work.
References
- Abbara S, Pena AJ, Maurovich-Horvat P, Butler J, Sosnovik DE, Lembcke A, Cury RC, Hoffmann U, Ferencik M, Brady TJ. Feasibility and optimization of aortic valve planimetry with MDCT. American Journal of Roentgenology. 2007;188:356–360. doi: 10.2214/AJR.06.0232. [DOI] [PubMed] [Google Scholar]
- Bauer M, Siniawski H, Pasic M, Schaumann B, Hetzer R. Different hemodynamic stress of the ascending aorta wall in patients with bicuspid and tricuspid aortic valve. Journal of Cardiac Surgery. 2006;21:218–220. doi: 10.1111/j.1540-8191.2006.00219.x. [DOI] [PubMed] [Google Scholar]
- Beller CJ, Labrosse MR, Thubrikar MJ, Robicsek F. Role of aortic root motion in the pathogenesis of aortic dissection. Circulation. 2004;109:763–769. doi: 10.1161/01.CIR.0000112569.27151.F7. [DOI] [PubMed] [Google Scholar]
- Bickerstaff LK, Pairolero PC, Hollier LH, Melton LJ, Van Peenen HJ, Cherry KJ, Joyce JW, Lie JT. Thoracic aortic aneurysms: a population-based study. Surgery. 1982;92:1103–1108. [PubMed] [Google Scholar]
- Choudhury N, Bouchot O, Rouleau L, Tremblay D, Cartier R, Butany J, Mongrain R, Leask RL. Local mechanical and structural properties of healthy and diseased human ascending aorta tissue. Cardiovascular Pathology. 2009;18:83–91. doi: 10.1016/j.carpath.2008.01.001. [DOI] [PubMed] [Google Scholar]
- Conrad MF, Cambria RP. Contemporary management of descending thoracic and thoracoabdominal aortic aneurysms: endovascular versus open. Circulation. 2008;117:841–852. doi: 10.1161/CIRCULATIONAHA.107.690958. [DOI] [PubMed] [Google Scholar]
- Cripe L, Andelfinger G, Martin LJ, Shooner K, Benson DW. Bicuspid aortic valve is heritable. Journal of the American College of Cardiology. 2004;44:138–143. doi: 10.1016/j.jacc.2004.03.050. [DOI] [PubMed] [Google Scholar]
- Davies MJ. Aortic aneurysm formation: lessons from human studies and experimental models. Circulation. 1998;98:193–195. doi: 10.1161/01.cir.98.3.193. [DOI] [PubMed] [Google Scholar]
- Davies RR, Goldstein LJ, Coady MA, Tittle SL, Rizzo JA, Kopf GS, Elefteriades JA. Yearly rupture or dissection rates for thoracic aortic aneurysms: simple prediction based on size. Annals of Thoracic Surgery. 2002;73:17–28. doi: 10.1016/s0003-4975(01)03236-2. [DOI] [PubMed] [Google Scholar]
- den Reijer PM, Sallee D, 3rd, van der Velden P, Zaaijer ER, Parks WJ, Ramamurthy S, Robbie TQ, Donati G, Lamphier C, Beekman RP, Brummer ME. Hemodynamic predictors of aortic dilatation in bicuspid aortic valve by velocity-encoded cardiovascular magnetic resonance. Journal of Cardiovascular Magnetic Resonance. 2010;12:4. doi: 10.1186/1532-429X-12-4. [DOI] [PMC free article] [PubMed] [Google Scholar]
- Dolan JM, Meng H, Singh S, Paluch R, Kolega J. High fluid shear stress and spatial shear stress gradients affect endothelial proliferation, survival, and alignment. Annals of Biomedical Engineering. 2011;39:1620–1631. doi: 10.1007/s10439-011-0267-8. [DOI] [PMC free article] [PubMed] [Google Scholar]
- Duprey A, Khanafer K, Schlicht M, Avril S, Williams D, Berguer R. In vitro characterisation of physiological and maximum elastic modulus of ascending thoracic aortic aneurysms using uniaxial tensile testing. European Journal of Vascular and Endovascular Surgery. 2010;39:700–707. doi: 10.1016/j.ejvs.2010.02.015. [DOI] [PubMed] [Google Scholar]
- Fazel SS, Mallidi HR, Lee RS, Sheehan MP, Liang D, Fleischman D, Herfkens R, Mitchell S, Miller DC. The aortopathy of bicuspid aortic valve disease has distinctive patterns and usually involves the transverse aortic arch. Journal of Thoracic and Cardiovascular Surgery. 2008;135:901–U954. doi: 10.1016/j.jtcvs.2008.01.022. [DOI] [PubMed] [Google Scholar]
- Fraunhofer SCAI. MpCCI Documentation. Sankt Augustin; Germany: 2008. [Google Scholar]
- Hahn RT, Roman MJ, Mogtader AH, Devereux RB. Association of aortic dilation with regurgitant, stenotic and functionally normal bicuspid aortic valves. Journal of the American College of Cardiology. 1992;19:283–288. doi: 10.1016/0735-1097(92)90479-7. [DOI] [PubMed] [Google Scholar]
- Hope MD, Hope TA, Crook SE, Ordovas KG, Urbania TH, Alley MT, Higgins CB. 4D flow CMR in assessment of valve-related ascending aortic disease. JACC Cardiovascular Imaging. 2011;4:781–787. doi: 10.1016/j.jcmg.2011.05.004. [DOI] [PubMed] [Google Scholar]
- Hope MD, Hope TA, Meadows AK, Ordovas KG, Urbania TH, Alley MT, Higgins CB. Bicuspid aortic valve: four-dimensional MR evaluation of ascending aortic systolic flow patterns. Radiology. 2010;255:53–61. doi: 10.1148/radiol.09091437. [DOI] [PubMed] [Google Scholar]
- Iliopoulos DC, Deveja RP, Kritharis EP, Perrea D, Sionis GD, Toutouzas K, Stefanadis C, Sokolis DP. Regional and directional variations in the mechanical properties of ascending thoracic aortic aneurysms. Medical Engineering & Physics. 2009;31:1–9. doi: 10.1016/j.medengphy.2008.03.002. [DOI] [PubMed] [Google Scholar]
- Ince H, Nienaber CA. Etiology, pathogenesis and management of thoracic aortic aneurysm. Nature Clinical Practice Cardiovascular Medicine. 2007;4:418–427. doi: 10.1038/ncpcardio0937. [DOI] [PubMed] [Google Scholar]
- Keane MG, Wiegers SE, Plappert T, Pochettino A, Bavaria JE, Sutton MGS. Bicuspid aortic valves are associated with aortic dilatation out of proportion to coexistent valvular lesions. Circulation. 2000;102:35–39. doi: 10.1161/01.cir.102.suppl_3.iii-35. [DOI] [PubMed] [Google Scholar]
- Khanafer K, Berguer R. Fluid-structure interaction analysis of turbulent pulsatile flow within a layered aortic wall as related to aortic dissection. Journal of Biomechanics. 2009;42:2642–2648. doi: 10.1016/j.jbiomech.2009.08.010. [DOI] [PubMed] [Google Scholar]
- McGloughlin TM, Doyle BJ. New approaches to abdominal aortic aneurysm rupture risk assessment: engineering insights with clinical gain. Arteriosclerosis, Thrombosis, and Vascular Biology. 2010;30:1687–1694. doi: 10.1161/ATVBAHA.110.204529. [DOI] [PubMed] [Google Scholar]
- Milewicz DM, Guo DC, Tran-Fadulu V, Lafont AL, Papke CL, Inamoto S, Kwartler CS, Pannu H. Genetic basis of thoracic aortic aneurysms and dissections: focus on smooth muscle cell contractile dysfunction. Annual Review of Genomics and Human Genetics. 2008;9:283–302. doi: 10.1146/annurev.genom.8.080706.092303. [DOI] [PubMed] [Google Scholar]
- Molony DS, Callanan A, Kavanagh EG, Walsh MT, McGloughlin TM. Fluid-structure interaction of a patient-specific abdominal aortic aneurysm treated with an endovascular stent-graft. BioMedical Engineering OnLine. 2009;8:24. doi: 10.1186/1475-925X-8-24. [DOI] [PMC free article] [PubMed] [Google Scholar]
- Nathan DP, Xu C, Gorman JH, III, Fairman RM, Bavaria JE, Gorman RC, Chandran KB, Jackson BM. Pathogenesis of acute aortic dissection: a finite element stress analysis. Annals of Thoracic Surgery. 2011;91:458–463. doi: 10.1016/j.athoracsur.2010.10.042. [DOI] [PubMed] [Google Scholar]
- Okamoto RJ, Wagenseil JE, DeLong WR, Peterson SJ, Kouchoukos NT, Sundt TM., 3rd Mechanical properties of dilated human ascending aorta. Annals of Biomedical Engineering. 2002;30:624–635. doi: 10.1114/1.1484220. [DOI] [PubMed] [Google Scholar]
- Pasta S, Phillippi JA, Gleason TG, Vorp DA. Effect of aneurysm on the mechanical dissection properties of the human ascending thoracic aorta. Journal of Thoracic and Cardiovascular Surgery. 2012;143:460–467. doi: 10.1016/j.jtcvs.2011.07.058. [DOI] [PMC free article] [PubMed] [Google Scholar]
- Pekkan K, Dur O, Sundareswaran K, Kanter K, Fogel M, Yoganathan A, Undar A. Neonatal aortic arch hemodynamics and perfusion during cardiopulmonary bypass. Journal of Biomechanical Engineering. 2008;130:061012. doi: 10.1115/1.2978988. [DOI] [PubMed] [Google Scholar]
- Raghavan ML, Vorp DA. Toward a biomechanical tool to evaluate rupture potential of abdominal aortic aneurysm: identification of a finite strain constitutive model and evaluation of its applicability. Journal of Biomechanics. 2000;33:475–482. doi: 10.1016/s0021-9290(99)00201-8. [DOI] [PubMed] [Google Scholar]
- Rajagopal K, Bridges C, Rajagopal KR. Towards an understanding of the mechanics underlying aortic dissection. Biomechanics and Modeling in Mechanobiology. 2007;6:345–359. doi: 10.1007/s10237-006-0069-3. [DOI] [PubMed] [Google Scholar]
- Rampoldi V, Trimarchi S, Eagle KA, Nienaber CA, Oh JK, Bossone E, Myrmel T, Sangiorgi GM, De Vincentiis C, Cooper JV, Fang J, Smith D, Tsai T, Raghupathy A, Fattori R, Sechtem U, Deeb MG, Sundt TM, 3rd, Isselbacher EM. Simple risk models to predict surgical mortality in acute type A aortic dissection: the International Registry of Acute Aortic Dissection score. Annals of Thoracic Surgery. 2007;83:55–61. doi: 10.1016/j.athoracsur.2006.08.007. [DOI] [PubMed] [Google Scholar]
- Sigovan M, Hope MD, Dyverfeldt P, Saloner D. Comparison of four-dimensional flow parameters for quantification of flow eccentricity in the ascending aorta. Journal of Magnetic Resonance Imaging. 2011;34:1226–1230. doi: 10.1002/jmri.22800. [DOI] [PubMed] [Google Scholar]
- Sokolis DP, Kritharis EP, Giagini AT, Lampropoulos KM, Papadodima SA, Iliopoulos DC. Biomechanical response of ascending thoracic aortic aneurysms: association with structural remodelling. Computer Methods in Biomechanics. 2012a;15:231–248. doi: 10.1080/10255842.2010.522186. [DOI] [PubMed] [Google Scholar]
- Sokolis DP, Kritharis EP, Iliopoulos DC. Effect of layer heterogeneity on the biomechanical properties of ascending thoracic aortic aneurysms. Medical & Biological Engineering & Computing. 2012b;50:1227–1237. doi: 10.1007/s11517-012-0949-x. [DOI] [PubMed] [Google Scholar]
- Thubrikar MJ, Agali P, Robicsek F. Wall stress as a possible mechanism for the development of transverse intimal tears in aortic dissections. Journal of Medical Engineering & Technology. 1999;23:127–134. doi: 10.1080/030919099294177. [DOI] [PubMed] [Google Scholar]
- Ward C. Clinical significance of the bicuspid aortic valve. Heart. 2000;83:81–85. doi: 10.1136/heart.83.1.81. [DOI] [PMC free article] [PubMed] [Google Scholar]
- Weigang E, Kari FA, Beyersdorf F, Luehr M, Etz CD, Frydrychowicz A, Harloff A, Markl M. Flow-sensitive four-dimensional magnetic resonance imaging: flow patterns in ascending aortic aneurysms. European Journal Cardio-Thoracic Surgery. 2008;34:11–16. doi: 10.1016/j.ejcts.2008.03.047. [DOI] [PubMed] [Google Scholar]


