

Abstract
Angiogenesis is a key pathological feature of experimental and human steatohepatitis, a common chronic liver disease that is associated with obesity. We demonstrated that hepatocytes generated a type of membrane-bound vesicle, microparticles, in response to conditions that mimicked the lipid accumulation that occurs in the liver in some forms of steatohepatitis and that these microparticles promoted angiogenesis. When applied to an endothelial cell line, medium conditioned by murine hepatocytes or a human hepatocyte cell line exposed to saturated free fatty acids induced migration and tube formation, two processes required for angiogenesis. Medium from hepatocytes in which caspase 3 was inhibited or medium in which the microparticles were removed by ultracentrifugation lacked proangiogenic activity. Isolated hepatocyte-derived microparticles induced migration and tube formation of an endothelial cell line in vitro and angiogenesis in mice, processes that depended on internalization of microparticles. Microparticle internalization required the interaction of the ectoenzyme Vanin-1 (VNN1), an abundant surface protein on the microparticles, with lipid raft domains of endothelial cells. Large quantities of hepatocyte-derived microparticles were detected in the blood of mice with diet-induced steatohepatitis, and microparticle quantity correlated with disease severity. Genetic ablation of caspase 3 or RNA interference directed against VNN1 protected mice from steatohepatitis-induced pathological angiogenesis in the liver and resulted in a loss of the proangiogenic effects of microparticles. Our data identify hepatocyte-derived microparticles as critical signals that contribute to angiogenesis and liver damage in steatohepatitis and suggest a therapeutic target for this condition.
Keywords: Obesity, hepatic steatosis, apoptosis, free fatty acids, fibrosis
Introduction
Nonalcoholic fatty liver disease (NAFLD) is a common form of chronic liver disease that affects both adults and children and is associated with obesity and insulin resistance (1, 2). One in three adults and 1 in 10 children or adolescents in the United States have hepatic steatosis, a stage within the spectrum of NAFLD that is characterized by triglyceride accumulation in liver cells and usually follows a benign nonprogressive clinical course (3). Nonalcoholic steatohepatitis (NASH) is defined as lipid accumulation with evidence of cellular damage, inflammation, neovascularization, and different degrees of scarring or fibrosis (4). NASH is a serious condition because about 25% of these patients can progress to cirrhosis and related complications, including portal hypertension, liver failure, and hepatocellular carcinoma (5, 6). Growing evidence suggests that angiogenesis plays a central role in the progression to NASH, particularly the development of fibrosis (7). Marked hepatic neovascularization occurs in patients with NASH, as well as in experimental models of the disease, which parallel the extent of fibrosis present (8–11). The mechanisms leading to angiogenesis in NASH as well as various other chronic liver conditions remain incompletely understood. Increased abundance and release of proangiogenic factors such as vascular endothelial growth factor (VEGF) by activated Kupffer cells, the resident liver macrophages, have been implicated, likely as a result of local hypoxia (7). Moreover, the degree of angiogenesis in the liver of NASH patients correlates with the activation of caspase 3 in hepatocytes (12). However, the molecular and signaling mechanisms linking lipid accumulation within hepatocytes to angiogenesis and a potential link between lipotoxicity and angiogenesis remain largely unknown. This leads us to hypothesize that lipid-overloaded hepatocytes may release proangiogenic signals that regulate endothelial cell migration and angiogenesis. Here, we present evidence that hepatocytes, after exposure to excessive amounts of saturated, but not unsaturated, free fatty acids (FFAs), secrete proangiogenic signals. Through several lines of evidence, we further identified hepatocyte-derived microparticles as the putative proangiogenic factor both in vitro and in vivo in a process involving caspase 3 activation in hepatocytes and Vanin-1 (VNN1)–dependent internalization of microparticles into endothelial cells. These findings uncover a mechanism that links hepatocyte lipotoxicity to angiogenesis and identifies a potential therapeutic target to inhibit angiogenesis and disease progression.
Results
Lipid-loaded hepatocytes release factors that induce endothelial cell migration and tube formation
Lipid accumulation in hepatocytes is a critical event in NASH development and is thought to be mainly a result of increased uptake of FFAs from the circulation (13). We and others have demonstrated that overloading hepatocytes with saturated FFAs such as palmitic acid, rather than monounsaturated or polyunsaturated FFAs, results in lipotoxicity (14–16). To determine whether accumulation of lipotoxic FFAs in hepatocytes results in the release of factor (or factors) that induces angiogenesis, we initially collected cell-free supernatants from media conditioned by HepG2 cells, a well-differentiated human and hepatoma cell line, or primary rat hepatocytes exposed to lipotoxic FFAs such as palmitic and stearic acid, as well as to nonlipotoxic FFAs (such as oleic acid) or controls (fig. S1). Cell-free supernatants from hepatocytes treated with palmitic or stearic acid, but not those from hepatocytes treated with oleic acid, induced an increase in tube formation, chemotaxis, and nonoriented migration in human umbilical vascular endothelial cells (HUVECs) to an extent similar to that induced by proangiogenic doses of the positive control VEGF-A (Fig. 1, A to C). These results suggest that overloading hepatocytes with lipotoxic FFAs results in the formation and release of proangiogenic factors.
Figure 1.
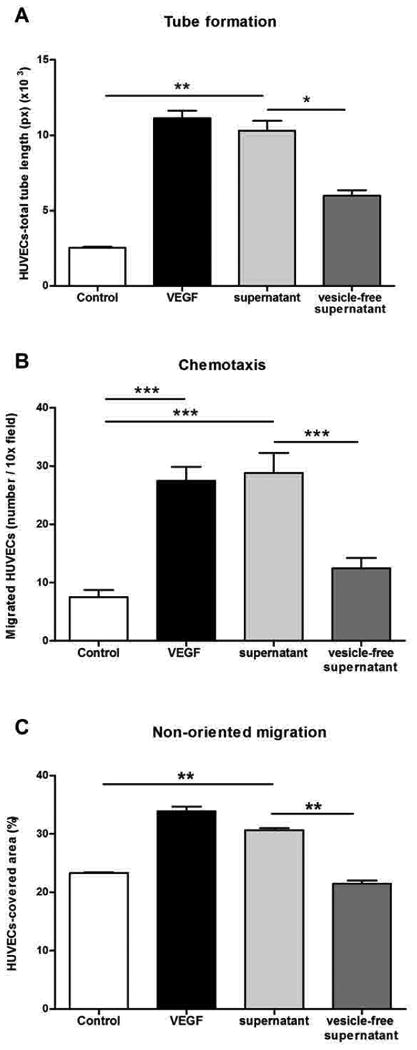
Lipid-loaded hepatocytes release factors that induce endothelial cell migration and angiogenesis. (A) Quantification of tube formation after exposure of HUVECs to palmitic acid–treated HepG2 cell supernatant (supernatant) or vesicle-free supernatant obtained by ultracentrifugation. *P < 0.05; **P < 0.01; ***P < 0.001, Kruskal-Wallis with Bonferroni correction. (B) Quantification of chemotaxis in Boyden chambers showing the number of migrated HUVECs after exposure to palmitic acid–treated HepG2 cell supernatant (supernatant) or vesicle-free supernatant. *P < 0.05; **P < 0.01; ***P < 0.001, analysis of variance (ANOVA) with Bonferroni correction. (C) Quantification of wound healing assay (to measure nonoriented migration) of HUVECs, monitored by confocal time-lapse microscopy for up to 48 hours. Quantification was reported as cell-covered area (%). VEGF was used as a positive control, and serum-free medium as a negative control. *P < 0.05; **P < 0.01; ***P < 0.001, Kruskal-Wallis with Bonferroni correction. Values represent means ± SD from three independent experiments.
The proangiogenic effects of lipid-loaded hepatocytes are mediated by the release of membrane vesicles
We then sought to determine the nature of the proangiogenic factor (or factors) released by stressed hepatocytes. During initial studies focused on physical and biochemical characterization of the proangiogenic factor (or factors), we removed cell vesicles from media conditioned by palmitic acid–treated hepatocytes by ultracentrifugation. We found that vesicle-free supernatants did not promote endothelial tube formation and migration in vitro (Fig. 1, A to C). These findings suggested that the proangiogenic activity was present in the membranous precipitate and led us to further characterize the membrane vesicles released by hepatocytes during lipotoxicity. We next performed dynamic light scattering analysis, transmission electron microscopy (TEM), and fluorescence-activated cell sorting (FACS) analysis and identified microparticles as the main membrane vesicle population released by hepatocytes during exposure to saturated FFAs (Fig. 2, A to C). The vesicles released in the supernatant had a diameter ranging between 100 and 1000 nm (mean, 220 nm) and a morphology similar to that of microparticles (Fig. 2, B and C) (17, 18). Moreover, FACS analysis showed that there were higher numbers of annexin V–positive microparticles in the supernatants of palmitic acid–treated cells than in those of control cells (Fig. 2, D and E). The release of microparticles was linked to lipotoxicity because incubation of hepatocytes with a nonlipotoxic FFA failed to induce an increase in microparticle formation (Fig. 2, D and E), whereas coincubation of cells with both a lipotoxic FFA (palmitic acid) and a nonlipotoxic FFA (oleic acid) abrogated the release of microparticles (fig. S2). Because microparticle generation by other cell types such as platelets requires caspase 3 (19, 20), we next assessed whether suppression of caspase 3 activity would abolish or reduce microparticle formation and release triggered by palmitic acid treatment. Coincubation of palmitic acid–treated hepatocytes with a selective caspase 3 inhibitor reduced the formation and release of microparticles (Fig. 2, F and G). We next characterized the composition of hepatocyte-derived microparticles using a proteomic approach by liquid chromatography–tandem mass spectrometry (LC-MS/MS) analysis. Table 1 lists the most abundant proteins identified in hepatocyte-derived microparticles, and table S1 lists all the proteins identified in three independent experiments. Hepatocyte-derived microparticles carry (in order of abundance) cytosolic, extracellular, plasma membrane, and nuclear proteins (fig. S3). These data demonstrate that during lipotoxicity, microparticles with a specific composition are released from hepatocytes in a process dependent on caspase 3 activation and that these hepatocyte-derived microparticles may be critical mediators of the angiogenic effects exerted by the supernatants of lipid-loaded hepatocytes.
Figure 2.
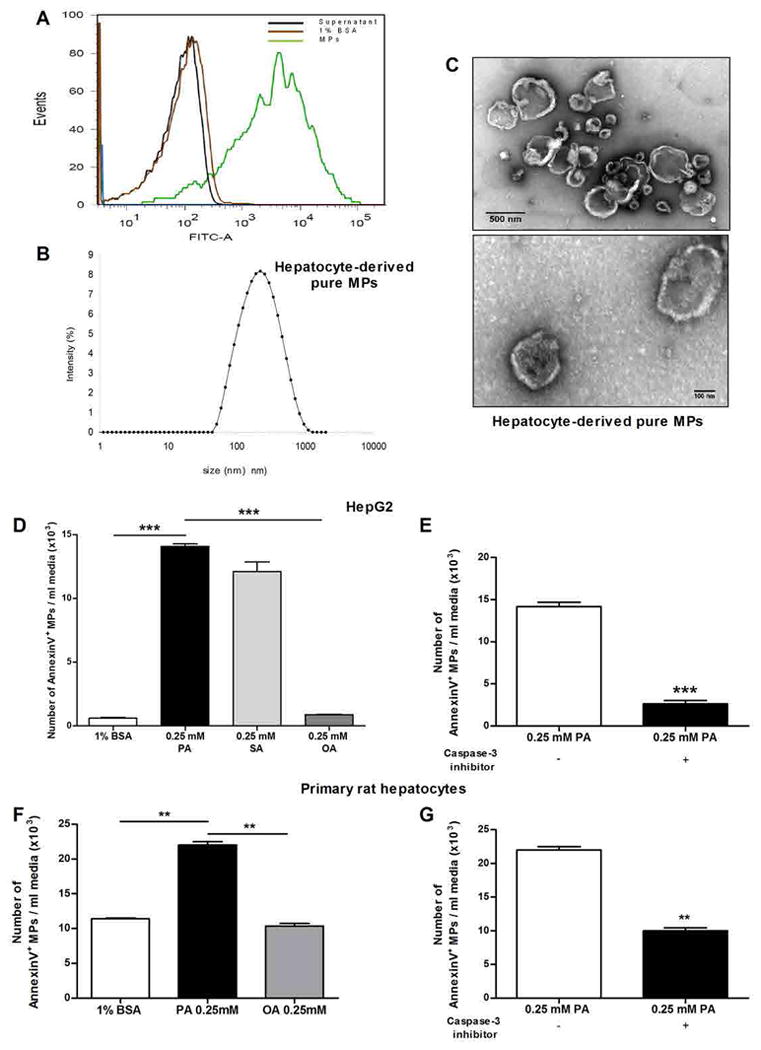
Microparticles are the main membrane vesicle population released by hepatocytes during exposure to lipotoxic fatty acids. (A) Flow cytometry analysis was performed to quantify annexin V fluorescein isothiocyanate (FITC)–positive microparticles (MPs; green peak) released by HepG2 after exposure to palmitic acid. The presence of hepatocyte-derived microparticles was measured in microparticle-free supernatant (brown peak) and 1% bovine serum albumin (BSA) (black peak), which were used as negative controls. The analysis is representative of three independent experiments. (B) Dynamic light scattering analysis of the size (diameter) of hepatocyte-derived microparticles released after exposure to palmitic acid. The analysis is representative of three independent experiments. (C) TEM micrographs of hepatocyte-derived microparticles released after palmitic acid treatment. Scale bars, 500 and 100 nm. Images are representative of three independent experiments. (D) Graph showing flow cytometric analysis to quantify annexin V–positive microparticles released by HepG2 treated with palmitic acid (PA), stearic acid (SA), oleic acid (OA), or BSA (control vehicle for FFAs). (E) Graph showing flow cytometric analysis to quantify annexin V–positive microparticles released by primary rat hepatocytes treated with palmitic acid, oleic acid, or BSA (control vehicle for FFAs). (D and E) *P < 0.05; **P < 0.01; ***P < 0.001, Kruskal-Wallis with Bonferroni correction. (F) Graph showing flow cytometric analysis of the number of annexin V–positive microparticles after coincubation of HepG2 with a caspase 3 inhibitor. (G) Graph of flow cytometric analysis of the number of annexin V–positive microparticles after coincubation of primary rat hepatocytes with a caspase 3 inhibitor. (F and G) *P < 0.05; **P < 0.01; ***P < 0.001, Mann-Whitney test. (D to G) Values represent means ± SD from three independent experiments.
Table 1. Identification of the highest expressed hepatocytes-derived MPs proteins based on LC-MS/MS data.
List of the most abundant proteins in hepatocyte-derived microparticles based on LC-MS/MS analysis. Pure hepatocyte-derived microparticles were isolated and processed for proteomics analysis. Some of the most abundant proteins are listed in the table with the corresponding UniProt accession code, sequence of coverage (%), number of peptides, and molecular mass based on the Gene Ontology Consortium. Proteomics data are representative of three independent experiments. Identification of the highest expressed hepatocyte-derived microparticle proteins based on LC-MS/MS data.
| Protein Name | Accession Code | Sequence coverage % | N. peptides | MW Kda |
|---|---|---|---|---|
| Maltase-glucoamylase | MGA_HUMAN | 17.99 | 20 | 196.9 |
| Ceruloplasmin precursor | CERU_HUMAN | 35.96 | 38 | 122.2 |
| Amine oxidase, copper containing 3 | AOC3_HUMAN | 15.07 | 10 | 84.6 |
| Apolipoprotein E precursor | APOE_HUMAN | 30.6 | 6 | 36.1 |
| Vitamin D-binding protein precursor | VTDB_HUMAN | 12.66 | 7 | 52.9 |
| Isocitrate dehydrogenase 1, soluble | IDHC_HUMAN | 12.56 | 4 | 46.6 |
| fumarylacetoacetate hydrolase | FAAA_HUMAN | 18.62 | 5 | 46.3 |
| Vanin-1 | VNN1_HUMAN | 13.06 | 3 | 57 |
| Transforming growth factor, beta-induced | BGH3_HUMAN | 10.25 | 3 | 74.6 |
Hepatocyte-derived microparticles are proangiogenic and induce endothelial cell migration and tube formation in vitro and angiogenesis in vivo in a process requiring VNN1-dependent internalization
We further explored the role of hepatocyte-derived microparticles in key events involved in angiogenesis. Isolated hepatocyte-derived microparticles from either HepG2 cells (Fig. 3, A to C) or primary rat hepatocytes (fig. S4, A to D) treated with palmitic acid resulted in increased migration and tube formation activity in HUVECs in vitro in a dose-dependent manner (fig. S5, A and B). Moreover, in the tube formation assays, we detected microparticles inside the tubular structures, suggesting that microparticles were internalized by HUVECs (fig. S6). Next, to elucidate whether hepatocyte-derived microparticles could contribute to angiogenesis in vivo, we intradermally injected hepatocyte-derived microparticles mixed with Matrigel into athymic BALB/c nude mice. Hepatocyte-derived microparticles induced angiogenesis in the Matrigel plugs to an extent similar to that induced by injecting VEGF mixed with Matrigel (Fig. 3D). Our proteomic analysis of microparticles led us to focus on VNN1 as a functional candidate for microparticle-induced proangiogenic responses in endothelial cells. VNN1 is an ectoenzyme (an enzyme localized to the cell surface) that contains a glycosylphosphatidylinositol (GPI)–anchored cleavage site on residue 491. VNN1 is found primarily in the liver, kidney epithelia, and intestine (21) and has been linked to promotion of cell adherence and migration (22). Western blot analysis confirmed that VNN1 was present in hepatocytes and in microparticles from palmitic acid–treated cells, but not in those from oleic acid–treated cells (Fig. 4A), and imaging analysis demonstrated that fluorescently labeled microparticles were internalized into HUVECs within 6 hours of incubation (Fig. 4B). Because GPI-anchored proteins are often associated with lipid raft domains in the plasma membrane, we investigated whether VNN1 promoted the internalization of microparticles through lipid rafts (23, 24). Caveolae are flask-like invaginations of the plasma membrane that are enriched in cholesterol, glycosphingolipids, and the structural proteins caveolins and are a subset of lipid rafts; they can participate in the uptake of extracellular vesicles (25–27). To determine whether the internalization of microparticles is mediated by the interaction of VNN1 with lipid raft domains of the endothelial cells, we incubated live HUVECs with cholera toxin B (CTB)–horseradish peroxidase (HRP) conjugate to label lipid rafts (28), then with VNN1-gold–labeled microparticles. Immunogold electron microscopy showed that VNN1-positive microparticles colocalized with lipid rafts and suggested that microparticles were taken up and trafficked in HUVECs through lipid rafts (Fig. 4C). Cholesterol depletion through combination treatment of cells with methyl-β-cyclodextrin (MβCD), which disrupts lipid rafts and caveolae (29), and a neutralizing antibody to caveolin-1 resulted in reduced internalization of microparticles into endothelial cells (Fig. 4D). Intracellular signal transduction through lipid raft and GPI-anchored proteins may require activation of small guanosine triphosphatases, such as RhoA and cdc42 (30–32). We found that the RhoA-associated kinase (ROCK) inhibitor Y27632 or knockdown of cdc42 in endothelial cells resulted in a significant decrease in tube formation and chemotaxis (Fig. 4, E and F). To further assess the role of VNN1 in the internalization of microparticles, we treated HepG2 cells with small interfering RNA (siRNA) for VNN1 or with control siRNA before incubating the cells with palmitic acid. VNN1 siRNA, but not control siRNA, reduced VNN1 abundance in both HepG2 cells and the microparticles released after exposure to palmitic acid (Fig. 5, A and B), although knockdown of VNN1 did not affect the number of microparticles released after exposure to palmitic acid (Fig. 5C). Furthermore, knockdown of VNN1 significantly reduced the internalization of microparticles by endothelial cells (Fig. 5, D to F) and the ability of microparticles to promote endothelial cell migration and tube formation (Fig. 5, G and H, and fig. S7, A and B). Blocking VNN1 on the surface of microparticles with a neutralizing VNN1 antibody resulted in effects on microparticle internalization and HUVEC migration and tube formation similar to those observed with VNN1 siRNA (fig. S8, A to E). VNN1 has pantetheinase activity, which results in reduction of intracellular glutathione in the target cell; however, application of VNN1-positive microparticles to HUVECs did not significantly alter glutathione activity (fig. S8F).
Figure 3.
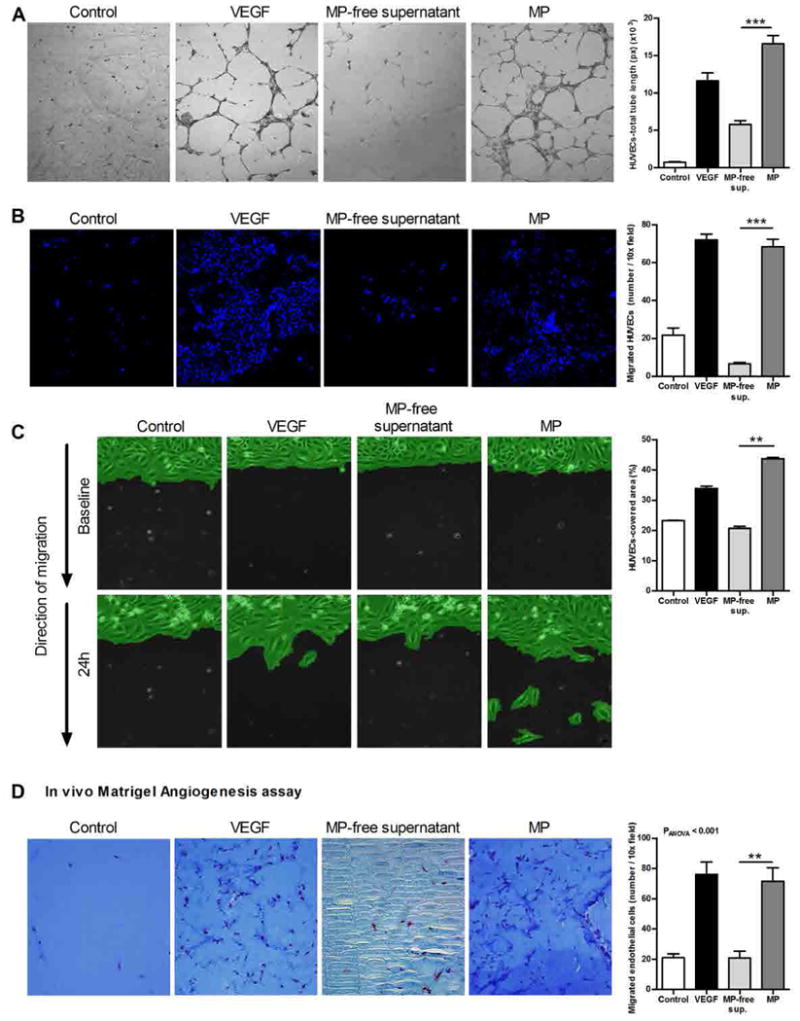
Endothelial cells tube formation and migration depend on MPs released from fat-laden HepG2 cells. Endothelial cell tube formation and migration depend on microparticles released from fat-laden HepG2 cells. (A) Representative micrographs and corresponding quantification of tube formation of HUVECs after exposure to microparticle (MP)–free supernatant or HepG2-derived microparticles. Scale bar, 50 µm. (B) Representative micrographs and corresponding quantification of chemotaxis in Boyden chamber assays of HUVECs exposed to HepG2-derived microparticles, microparticle-free supernatant, and controls. Scale bar, 50 µm. (C) Representative micrographs and corresponding quantification of wound healing assay of HUVECs. Scale bar, 50 µm. (D) Representative Masson's trichrome micrographs of angiogenesis and migration assay in vivo and corresponding quantification of the number of endothelial cells (ECs) (dark red) that migrated into the plug removed from athymic BALB/c nude mice (n = 5 mice per group) that received a subcutaneous injection of Matrigel in the presence or absence (control) of VEGF, microparticle-free supernatant, and HepG2-derived microparticles. Scale bar, 50 µm. VEGF was used as a positive control, and serum-free medium as a negative control (Control). Values in (B) and (C) represent means ± SD from three independent experiments.*P < 0.05; **P < 0.01; ***P < 0.001, Kruskal-Wallis with Bonferroni correction.
Figure 4.
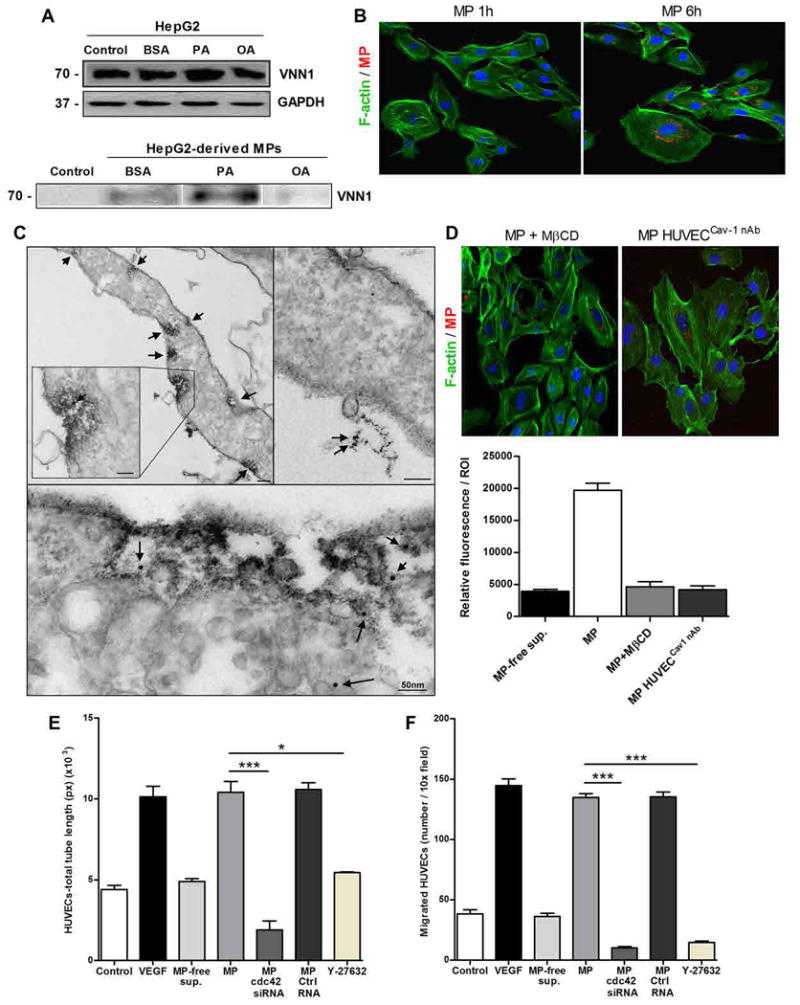
Hepatocyte-derived microparticles express VNN1 and are internalized into the endothelial cells. (A) Western blotting analysis of VNN1 in HepG2 and HepG2-derived microparticles (MPs) released after exposure to BSA (FFA control vehicle) and saturated [palmitic acid (PA)] or unsaturated [oleic acid (OA)] FFAs. Controls refer to untreated HepG2 or microparticle-free supernatant. (B) Internalization of HepG2-derived PKH26-positive microparticles (red) into HUVECs (F-actin fibers, green; nuclei, blue) assessed by indirect immunofluorescence after incubation with microparticles. Scale bar, 50 µm. (C) TEM micrographs of HUVECs incubated with CTB-HRP conjugate and VNN1 antibody–gold conjugate–labeled microparticles. CTB-HRP conjugate labeling is shown on the plasma membrane of HUVECs (arrows, top panel), and VNN1 antibody–gold conjugate is shown on microparticles internalized in the HUVECs (arrows, bottom panel). Scale bars, 50 nm. (D) Representative micrographs and corresponding quantification of internalization of microparticles assessed by immunofluorescence in HUVECs pretreated with MβCD or neutralizing antibody to caveolin-1 (cav-1 nAb). Micrographs show PKH26-positive microparticles (red), F-actin fibers of HUVECs (green), and nuclei [4′,6-diamidino-2-phenylindole (DAPI), blue]. Microparticle-free supernatant (microparticle-free sup.) was used as a negative control. Data in (A) to (D) are representative of three independent experiments. Scale bar, 50 µm. (E and F) Quantification of tube formation (E) and chemotaxis assay in Boyden chambers (F) of HUVECs pretreated with the ROCK inhibitor Y27632, cdc42 siRNA, or control siRNA (Ctrl siRNA). Values in (E) and (F) represent means ± SD from three independent experiments. *P < 0.05; **P < 0.01; ***P < 0.001, Kruskal-Wallis (E) and ANOVA (F) with Bonferroni correction.
Figure 5.
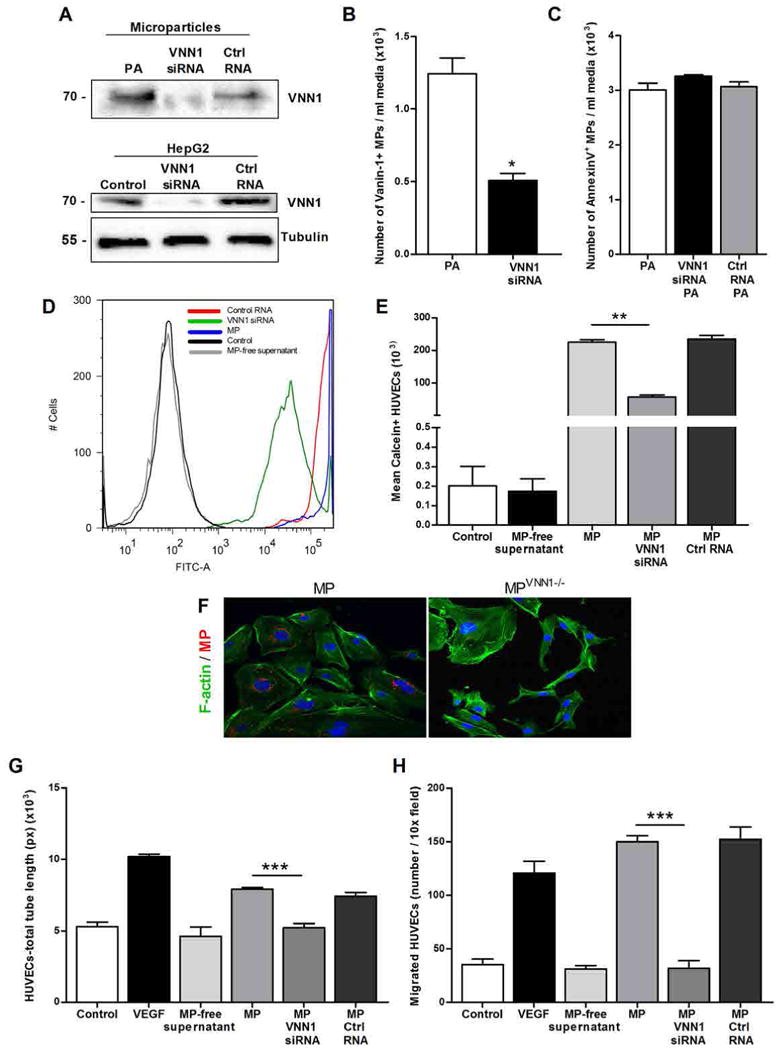
Knockdown of VNN1 reduces microparticle internalization and proangiogenic effects on endothelial cells. (A) Western blotting analysis of VNN1 in HepG2-derived microparticles and HepG2 cells treated with VNN1 siRNA or control siRNA (Ctrl siRNA) and exposed to palmitic acid (PA). Western blots are representative of three independent experiments. (B) Flow cytometry analysis of VNN1-positive microparticles (MPs) isolated from HepG2 cells exposed to palmitic acid in the presence or absence of VNN1 siRNA. *P < 0.05; **P < 0.01; ***P < 0.001, Mann-Whitney test. (C) Flow cytometry analysis of annexin V–positive microparticles released from HepG2 cells treated with VNN1 siRNA or control siRNA and exposed to palmitic acid. (D and E) Flow cytometry analysis (D) and corresponding quantification (E) of the number of calcein/FITC-positive HUVECs exposed to microparticles isolated from HepG2 cells treated with VNN1 siRNA or control siRNA and exposed to palmitic acid. *P < 0.05; **P < 0.01; ***P < 0.001, Kruskal-Wallis with Bonferroni correction. (F) Internalization of PKH26-positive HepG2-derived microparticles or microparticles lacking VNN1 (VNN1−/−) (red) into HUVECs (green), assessed by indirect immunofluorescence. Images are representative of three independent experiments. (G and H) Quantification of tube formation (G) and chemotaxis using Boyden chambers (H) of HUVECs incubated with microparticles isolated from HepG2 cells treated with VNN1 siRNA or control siRNA and exposed to palmitic acid. VEGF was used as a positive control, and serum-free medium as a negative control. Values in (B), (C), (E), (G), and (H) represent means ± SD from three independent experiments. *P < 0.05; **P < 0.01; ***P < 0.001, Kruskal-Wallis (G) and ANOVA (H) with Bonferroni correction.
VNN1 can promote the proliferation of vascular smooth muscle cells partly through the transcription factor PPAR γ (peroxisome proliferator–activated receptor γ) (33). However, we found that the proangiogenic effects of microparticles on HUVECs did not involve modulation of PPAR γ expression and were not associated with an increase in cell proliferation (fig. S9, A and B). This is consistent with a previous report demonstrating that cells organize themselves into tube-like structures mainly by changing their shape and establishing contacts with neighboring cells without proliferating to a substantial extent (34). In addition, the lipotoxicity-dependent increase in VNN1 abundance has been reported to depend on PPAR factors (35). In our study, the exposure of HepG2 cells to saturated and unsaturated FFAs increased the mRNA expression of PPARα and VNN1 but not that of PPAR γ (fig. S10, A to C). However, silencing of PPARα did not affect the mRNA expression of VNN1 in HepG2 cells in response to palmitic acid treatment (fig. S10, D and E), suggesting that the response was independent of PPARα. These results show that microparticle-mediated angiogenesis occurs through VNN1-dependent internalization into target cells.
Circulating microparticles are released during experimental NASH, are positive for VNN1, and have proangiogenic effects
We used a common dietary murine model of NASH to determine the potential role of hepatocyte-derived microparticles in hepatic angiogenesis during steatohepatitis development in vivo. C57BL/6 mice were placed on a methionine- and choline-deficient (MCD) diet, which results in steatosis associated with substantial inflammation and progressive fibrosis that is pathologically similar to severe steatohepatitis in humans (36, 37). Unlike mice receiving the control methionine- and choline-supplemented (MCS) diet, mice on the MCD diet showed an increase in circulating annexin V–positive microparticles, an increase that was partially reduced in caspase 3 knockout mice (Fig. 6A), suggesting that caspase 3 activity may be critical in the production and/or release of circulating microparticles during experimental NASH. Furthermore, VNN1 was present on the circulating microparticles isolated from wild-type MCD-fed mice but not on those isolated from mice that received the control diet or from caspase 3 knockout mice (Fig. 6B). In addition, MCD-fed mice had more annexin V–positive microparticles than mice fed a high-fat, high-carbohydrate diet (HF/HCarb), which results in hepatic steatosis in the absence of liver injury or inflammation (38, 39), indicating that the circulating numbers of microparticles correlated with the severity of liver pathology (fig. S11, A to C). Light scattering and electron microscopy analysis demonstrated that the size range and morphology of microparticles in the MCD-treated animals were similar to those found in supernatants of palmitic acid–treated hepatocytes (Fig. 6, C and D). Finally, electron microscopy showed the presence of abundant vesicles with a morphology characteristic of microparticles in liver sections from MCD-treated but not in those from MCS-treated mice. These vesicles were present predominantly in perisinusoidal areas or space of Disse, which is located between hepatocytes and a sinusoid, and could be easily distinguished from hepatocyte microvilli that typically extend into this space (Fig. 6C). To establish whether the circulating microparticles isolated from MCD- or MCS-fed mice originated from hepatocytes, we measured the abundance of the hepatocyte-specific microRNA miR-122 (40, 41) and found that miR-122 abundance was higher in circulating microparticles isolated from MCD-fed mice than in those isolated from mice on the control diet (Fig. 6E). Next, we wanted to determine whether circulating VNN1-positive microparticles in MCD-treated mice had similar biological effects on endothelial cells as those derived from hepatocytes in vitro. We treated HUVECs with microparticle-free plasma or microparticles isolated from the blood of C57BL/6 mice on MCD, HF/HCarb, or normal chow diets, and found that blood microparticles from MCD-treated mice induced tube formation and oriented migration in endothelial cells to a similar extent to those induced by microparticles from palmitic acid–treated hepatocytes (fig. S12, A and B). To evaluate the role of VNN1 in circulating microparticles, we treated C57BL/6 mice on the MCD with VNN1 siRNA or control siRNA. Hepatic VNN1 was reduced up to 90% in mice treated with VNN1 siRNA compared to phosphate-buffered saline (PBS)–treated mice (Fig. 7A), whereas the abundance of mRNA for VNN1 was unchanged in the kidney or intestine (fig. S13, A to C). Western blotting analysis of circulating microparticles confirmed that VNN1 was present in microparticles isolated from MCD-fed mice, but not in those isolated from MCS-fed mice, and that circulating microparticles lacking VNN1 were present only after treatment with VNN1 siRNA, but not after mock treatment or treatment with control siRNA (Fig. 7B). Knockdown of VNN1 did not influence the number of circulating microparticles (Fig. 7C). HUVECs treated with circulating microparticles lacking VNN1 showed reduced tube formation and chemotaxis compared to cells treated with microparticles from either mock or control siRNA–treated mice (Fig. 7, D to G). Additionally, mice on the MCD diet and treated with VNN1 siRNA showed reduced abundance not only of the mRNAs encoding the angiogenic markers VEGF-A and vascular endothelial cadherin (VE-cadherin) (42) but also of the mRNA encoding CD31, a histological marker for endothelial cells, compared to the mice treated with control siRNA or PBS (mock) (fig. S14, A to C).
Figure 6.
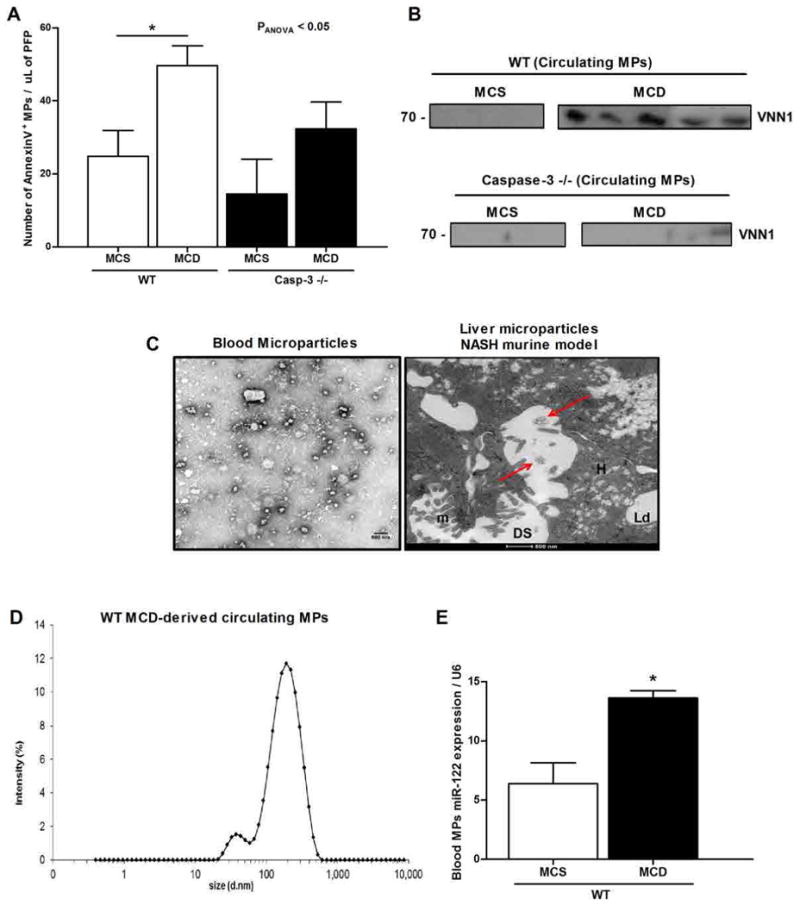
Microparticles are released into circulation in a diet-induced NASH murine model. (A) Flow cytometry analysis of circulating annexin V–positive microparticles (MPs) isolated from wild-type (WT; control) mice (n = 5) and caspase 3 knockout (Casp3−/−) mice (n = 5) fed with the MCD to induce NASH or the control diet (MCS). *P < 0.05; **P < 0.01; ***P < 0.001, Kruskal-Wallis with Bonferroni correction. (B) Western blotting analysis of VNN1 abundance in circulating microparticles isolated from MCS-fed (n = 3) or MCD-fed (n = 5) WT and caspase 3 knockout mice. The lanes were run on the same gel but were noncontiguous. (C) Representative TEM micrographs of circulating microparticles isolated from WT MCD-fed mice (left) and of microparticles localized in liver specimens from MCD-fed mice (right) (n = 5 mice). DS, space of Disse; m, microvilli; H, hepatocytes; Ld, lipid droplet. (D) Dynamic light scattering analysis of the size (diameter) of circulating purified microparticles from MCD-fed mice (n = 5). (E) Quantitative PCR of miR-122 abundance in the circulating microparticles isolated from MCD- or MCS-fed mice (n = 5 mice per group). Mean values were normalized to U6 small nuclear RNA (snRNA). Values represent means ± SD. *P < 0.05; **P < 0.01; ***P < 0.001, Mann-Whitney test.
Figure 7.
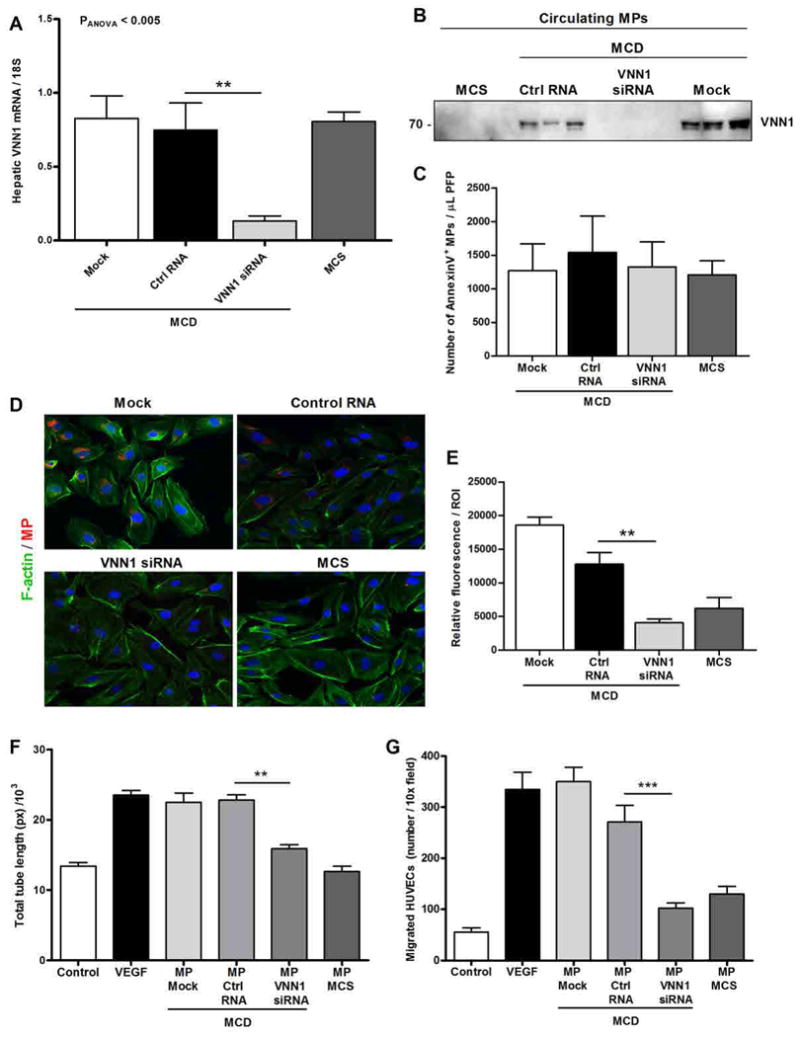
In vivo knockdown of hepatic VNN1 resulted in decreased microparticle internalization and proangiogenic effects on endothelial cells. (A) Quantitative PCR of hepatic VNN1 mRNA expression in mice (n = 8 mice per group) placed on MCD or control diet (MCS) for 6 weeks. MCD-fed mice received VNN1 siRNA, control siRNA (Ctrl siRNA), or PBS (mock) as vehicle. Mean values were normalized to 18S gene. (B) Western blotting analysis of VNN1 abundance in circulating microparticles (MPs) isolated from MCS-fed mice (control diet) and MCD-fed mice treated with VNN1 siRNA, control siRNA, or PBS (mock) (n = 3 mice per group). Each lane represents microparticles isolated from an individual mouse. (C) Flow cytometry analysis of annexin V–positive circulating microparticles collected from MCS-fed mice (control diet) and MCD-fed mice treated with VNN1 siRNA, control siRNA, or PBS (mock) (n = 8 mice per group). (D and E) Representative micrographs (D) and corresponding quantification (E) of internalization of microparticles isolated from MCS-fed mice (control diet) and MCD-fed mice treated with VNN1 siRNA, control siRNA, or PBS (mock) (n = 5 mice per group). Micrographs show PKH26-positive microparticles (red), F-actin fibers of HUVECs (green), and nuclei (DAPI, blue). (F and G) Quantification of tube formation (F) and chemotaxis assay using Boyden chambers (G) of HUVECs incubated with microparticles isolated from MCS-fed mice (control diet) and MCD-fed mice treated with VNN1 siRNA, control siRNA, or PBS (mock) (n = 5 mice per group). VEGF was used as a positive control, and serum-free medium as a negative control. Values in (C), (E), (F), and (G) represent means ± SD from three independent experiments. *P < 0.05; **P < 0.01; ***P < 0.001, Kruskal-Wallis with Bonferroni correction.
We also placed caspase 3 knockout (Casp3−/−) mice on the MCD or MCS diet. Histological examination showed that both Casp3−/− and wild-type mice on the MCD diet developed predominantly macrovesicular steatosis and lobular inflammation (fig. S15A), although the extent of pathological angiogenesis in Casp3−/− mice (fig. S15, A, B, and D) on the MCD diet was reduced (fig. S15, A, C, and D). Collectively, these findings identify hepatocyte-derived microparticles as a potential link between lipotoxicity and angiogenesis, with a crucial involvement of caspase 3 in this process.
Discussion
This study demonstrates that overloading hepatocytes with saturated lipotoxic FFAs results in the release of proangiogenic hepatocyte-derived microparticles in a process that requires caspase 3 activation. Proteomic analysis identified VNN1, an epithelial ectoenzyme involved in cell adhesion and migration, as an abundant surface protein in hepatocyte-derived microparticles, and functional studies demonstrate that the proangiogenic effects of microparticles require internalization by endothelial cells in a process dependent on VNN1 and lipid rafts. Angiogenesis plays a central role in chronic liver disease (7) and may be involved in the progression from hepatic steatosis, a generally benign condition characterized by overaccumulation of lipids in the liver, to NASH, which is a potentially more severe condition associated with lipid overloading of the liver, inflammation, and variable degrees of fibrosis. Indeed, marked hepatic neovascularization has been reported both in patients with NASH and in experimental models of the disease and correlates with the extent of detectable fibrosis (8–11, 43). The pathogenic mechanisms resulting in angiogenesis in NASH remain poorly understood, although increased production and release of certain proangiogenic factors such as VEGF-A, likely as a result of local hypoxia due to enlarged hepatocytes (which are swollen with accumulated lipids) or VEGF receptor 2 signaling, have been implicated (7, 44). We hypothesized that lipid-overloaded hepatocytes may release proangiogenic signals that regulate endothelial cell migration and angiogenesis. Here, we showed that lipotoxicity induced by incubation of hepatocytes with saturated FFAs such as palmitic acid results in the release of factors that induce endothelial cell migration and vascular tube formation. Although the contribution of inflammatory cells in angiogenesis during chronic liver damage has been characterized (45, 46), less is known about the potential contribution of hepatocytes to this process. We identified hepatocyte-derived microparticles as a link between hepatocyte lipotoxicity and angiogenesis. Circulating microparticles are increased in animal models of biliary cirrhosis and human cirrhosis and NASH (47–49). Microparticles are small membrane-bound particles or microvesicles released from the surface membrane of many cell types spontaneously or upon stimulation by various stressors (50, 51) and can participate in cell-to-cell communication (45, 50). Microparticle function depends on the cell type from which they originate and their content. Our analysis of the composition of hepatocyte-derived microparticles using proteomic approaches identified various proteins that appear to be specific for hepatocyte-derived microparticles (52–54), as well as proteins that are present in microparticles of other cell origins and in exosomes secreted by hepatocytes (43, 46, 52, 55). Future studies to compare the protein composition of hepatocyte-derived microparticles with those of microparticles from other cell types, as well as from exosomes secreted by hepatocytes, are warranted.
We demonstrated that a large number of microparticles were present in the liver and in circulation of mice fed the MCD diet, a common animal model of NASH (56), and that a substantial number of these circulating microparticles originated from hepatocytes. Furthermore, VNN1 was abundant on microparticles from mice on the MCD diet, and these microparticles promoted tube formation and migration of endothelial cells in vitro. siRNA-mediated targeting of VNN1 in mice on the MCD diet reduced the proangiogenic effects of the microparticles isolated from these mice but not their amount in the bloodstream. Moreover, MCD-fed animals showed increased pathological angiogenesis in the liver, which was reduced in VNN1 siRNA–treated animals. The localization of microparticles in the space of Disse, the location in the liver between hepatocytes and a sinusoid, suggests that these microparticles act in a paracrine manner. However, because the number of circulating VNN1-positive microparticles increased in the mouse model of NASH, we cannot rule out the possibility that microparticles released into the circulation act as long-range signals that may also contribute to pathological angiogenesis in the liver. The precise molecular mechanisms of microparticle release in hepatic angiogenesis and liver damage will require further investigation. Moreover, future studies are necessary to further dissect VNN1-mediated internalization and a potential role for its enzymatic function during the fusion of microparticles with lipid raft domains, as well as the role of other proteins, lipids, and RNA species including microRNAs (miRNAs) in microparticles that could have additional or synergistic effects to those induced by VNN1. In summary, our data support a model in which hepatocytes exposed to saturated lipotoxic FFAs such as palmitic acid release microparticles in a process requiring caspase 3 activation, which, in turn, can initiate endothelial cell migration and induce angiogenesis through VNN1-mediated microparticle internalization. Together, our results identify hepatocyte-derived VNN1-positive microparticles as an attractive potential target for developing novel antiangiogenic therapeutic strategies for the treatment of NASH as well as a circulating biomarker of liver damage.
Materials and Methods
Animal studies
C57BL/6 caspase 3 knockout (Casp3−/−) mice were provided by M. Woo (University of Toronto). These mice were generated by deleting exon 3 of the CPP32/caspase 3 gene as previously described (57). Casp3−/− and wild-type littermates (7 weeks old, 20 to 25 g in body weight) were placed on an MCD diet (MP Biomedicals). An MCS diet (MP Biomedicals) and chow diet were used as control diets. A Western diet with HF/HCarb content has been used as a model of diet-induced NAFLD. Total body weight was measured weekly in all mice. Mice were sacrificed after 6 weeks on their respective diets, and livers and blood were collected under deep anesthesia as previously detailed (34). Athymic BALB/c nude mice (Case Western Reserve University athymic nude mice facility, Cleveland, OH; 6 weeks old, 20 to 25 g in body weight) were used for the in vivo Matrigel migration and angiogenesis assay. All animals were treated in compliance with the Guide for the Care and Use of Laboratory Animals (National Academy of Science, Washington, DC), and animal procedures were approved by the University of California, San Diego, Institutional Animal Care and Use Committee.
Histopathology and immunohistochemistry
Liver tissue was fixed in 10% formalin and paraffin-embedded. Tissue sections (5 µm) were prepared and stained with hematoxylin and eosin to assess histological changes including the degree of steatosis, ballooning of hepatocytes, and inflammation under light microscopy. The presence of endothelial cells was assessed by immunostaining with polyclonal rabbit antibody against CD31 (1:25; Abcam) and polyclonal rabbit antibody against von Willebrand factor (1:300; Dako). Deparaffinized sections were immersed in 3% H2O2 in water for 15 min to eliminate endogenous peroxidase activity. Sections were processed for heat-induced epitope retrieval for 20 min with Dako Target Retrieval Solution (pH 6.0; Dako) and stained overnight at 4°C. After incubation with secondary antibody, immune complexes were detected with the Dako EnVision System with HRP according to the manufacturer's instructions. Quantification of CD31 staining was performed with customized histology quantification software provided by Wimasis, and the percentage of CD31 staining is reported.
Cell culture
Primary rat hepatocytes were purchased from Becton Dickinson (BD) and maintained in Hepato-STIM Hepatocyte Defined Medium (BD) supplemented with 5 µg of epidermal growth factor and 2 mM L-glutamine. The human hepatoma HepG2 cell line was maintained in Dulbecco's modified Eagle's medium (DMEM) (Life Technologies) supplemented with 10% fetal bovine serum (CellGro), penicillin (5000 U/ml), and streptomycin sulfate (5000 µg/ml) in 0.85% NaCl. HUVECs were maintained in EGM-2 growth medium (Lonza) supplemented with several angiogenic and growth factors (SingleQuots, Lonza) according to the manufacturer's instructions. Cells were cultured at 37°C in a 5% CO2 humidified environment and used between passages 2 and 6. During treatments, HUVECs were incubated with growth factor–free medium (EBM-2, Lonza). Palmitic, stearic, oleic, and linoleic acids (Sigma-Aldrich) were dissolved in 95% ethanol (100 mM stock solution) and stored at −20°C before the experiments.
Microparticle isolation and purification
For microparticle isolation, HepG2 and primary rat hepatocytes were seeded onto a 100-mm dish and cultured until they reached 80 to 85% confluency. Cells were incubated with 0.25 mM palmitic, stearic, oleic, or linoleic acid in serum-free DMEM, supplemented with 1.1% penicillin and streptomycin and 1% endotoxin-free BSA, for up to 24 hours. The amount of FFAs used was physiologically relevant and was comparable to that detected in obese patients (15). The uptake of FFAs from hepatocytes was evaluated with an Oil Red-O staining kit (Cayman) according to the manufacturer's instruction. To determine the effect of caspase 3 activity, we treated hepatocytes with the caspase 3 inhibitor Ac-DEVD-CHO (BD Pharmingen). Control cells were incubated with the same serum-free medium supplemented with the vehicle used to dissolve the FFAs. After 24 hours, the medium was collected and centrifuged twice at 3000 rpm for 15 min to remove cell debris and aggregates. Supernatants were then transferred to new tubes and ultracentrifuged at 100,000g for 90 min at 10°C to avoid contamination of exosomes (58). Supernatants were collected in new tubes and used as a microparticle-free control, and the pelleted microparticles were resuspended in 200 µl of PBS for flow cytometry or in 500 µl of EGM-2 growth medium for subsequent in vitro studies. The concentration of microparticles was determined by the bicinchoninic acid (BCA) protein assay, and different concentrations of microparticles (50, 125, 250, and 500 µg/ml) were used to perform dose-dependent angiogenesis in vitro assays. For selected purposes, in particular for the characterization analyses, crude microparticles were purified by 10 to 70% sucrose gradient ultracentrifugation at 150,000g for 18 hours at 10°C and collected as fractions in new tubes. Fractions were resolved by SDS–polyacrylamide gel electrophoresis precast gels (Bio-Rad) and then visualized by silver staining (Invitrogen) to detect proteins in each fraction. Fractions with a density between 1.17 and 1.25 mg/ml and corresponding to the microparticles were combined, resuspended in PBS, and ultracentrifuged at 100,000g for 1 hour at 10°C to remove sucrose. For the isolation of microparticles from Casp3−/− and wild-type mice, blood was collected by cardiac puncture into BD vacutainer tubes containing 100 µl of acid citrate dextrose (0.085 M sodium citrate, 0.0702 M citric acid, 0.111 M dextrose, pH 4.5) as anticoagulant (Medcompare). Whole blood was centrifuged for 15 min at 200g at room temperature to obtain the platelet-rich plasma (supernatant). Platelet-rich plasma was centrifuged again for 2 min at 13,000g at room temperature to remove contaminating platelets and obtain platelet-free plasma. Microparticles were incubated in the dark for 30 min at room temperature with or without 5 µl of Alexa Fluor 488–conjugated annexin V (Molecular Probe). The microparticle diameter was assessed by dynamic light scattering (Zetasizer, Malvern).
Flow cytometry
Flow cytometry analyses for microparticle or endothelial cell detection were performed with the BD LSRII flow cytometer system (BD Biosciences), and data were analyzed with FlowJo software (TreeStar Inc.). For microparticle analysis, a standardization was achieved with 1-µm latex fluorescent beads (Sigma-Aldrich) and ultraviolet 2.5-µm flow cytometry alignment beads (Invitrogen). Forward scatter and side scatter limits were plotted on logarithmic scales to cover a wide size range. Single staining controls were used to check fluorescence compensation settings and to set up positive regions. For endothelial cell analysis, cells were incubated with labeled microparticles for 16 hours, trypsinized, and resuspended in fresh medium.
Tube formation
HUVECs (0.5 × 10⁵ to 1 × 10⁵ cells per well) were seeded onto a coated 24-well plate with Matrigel (200 µl/cm2; BD) using the thick gel method and cultured in EBM-2 basal medium supplemented with 1.1% of streptomycin and penicillin in the presence of VEGF (100 ng/ml; PeproTech), hepatocyte-derived microparticles, microparticle-free supernatant, or conditioned supernatant collected after 24 hours of treatment with FFAs. In some studies, the RhoA-ROCK inhibitor Y27632 (10 µM) was used in association with microparticles in the treatment of endothelial cells. For the ex vivo studies, platelet-free plasma isolated from different groups of mice (chow-, HF/HCarb-, and MCD-fed mice and mice injected with control RNA, VNN1 siRNA, or PBS as vehicle) was ultracentrifuged at 100,000g for 1 hour at 10°C to pellet the blood microparticles. HUVECs were treated with microparticles (or microparticles purified from blood) and incubated for 5 hours at 37°C. Tube formation was investigated by capturing images on an inverted microscope at ×4 magnification. Tube formation image analysis was assessed with Wimtube software (Wimasis), and the values of total tube length (pixel) were used for statistical and data analysis.
Cell migration
In vitro migration studies were performed with HUVECs. Wound healing assays were performed to analyze chemokinesis (nonoriented migration) with a collagen-coated six-well culture plate, in which a silicon elastomer (polydimethylsiloxane) strip was placed vertically at the bottom of every well to create an artificial wound. HUVECs were plated and grown until they reached complete confluence. HUVECs were treated with EBM-2 supplemented with VEGF (100 ng/ml; PeproTech), hepatocyte-derived microparticles, microparticle-free supernatant, or supernatant collected after 24 hours of treatment with FFAs. The strips were removed carefully, and migration of cells was detected by a confocal microscope, capturing one image per field every 10 min for 48 hours. Mitomycin (1 µg/ml) was used to inhibit cell proliferation during wound healing assays. Data were analyzed with WimScratch software (Wimasis) to obtain the total cell-covered area (pixel). Boyden chamber assays were performed to analyze chemotaxis (oriented migration) by using cell culture inserts with 8-µm pore size (Millipore) and a 24-well plate. Each well was filled with 500 µl of serum-free EBM-2 medium in the presence or absence of the following chemoattractants: VEGF (100 ng/ml), hepatocyte-derived microparticles, and microparticle-free supernatant or conditioned supernatant. The inserts were placed on top of each well, and 150 µl of cell suspension (5 × 10⁴ cells) was added. Plates were incubated overnight at 37°C, and then the filters were removed and stained with Vectashield mounting medium with DAPI (Vector Labs). Migrated cells were detected with a fluorescence microscope, and the number of nuclei per field was counted. For the ex vivo studies, platelet-free plasma isolated from different groups of mice (chow-, HF/HCarb-, MCD-fed mice and mice injected with control siRNA, VNN1 siRNA, or PBS as vehicle) was ultracentrifuged at 100,000g for 1 hour at 10°C to pellet the blood microparticles.
In vivo Matrigel migration and angiogenesis assay
To determine the ability of hepatocyte-derived microparticles to induce angiogenesis, athymic BALB/c nude mice were subcutaneously injected with 0.5 to 1 ml of ice-cold Matrigel Matrix Growth Factors Reduced (BD), mixed with VEGF (100 ng/ml), hepatocyte-derived microparticles, or microparticle-free supernatant. A volume of Matrigel only was used as a negative control. After 14 days, Matrigel plugs were removed along with surrounding tissue for orientation, fixed in 10% formalin, and embedded in paraffin. Sections (5 µm) were successively stained for Masson's trichrome to detect endothelial cells (in dark red). The number of endothelial cells that migrated into the plug after the treatment was counted. The number of endothelial cells that migrated is reported in the graph as number per field.
Proliferation assay
Fat-laden HepG2-derived microparticles were treated with neutralizing rabbit antibody against VNN1 (4 µg/ml; Epitomics) for 30 min. Serum-starved HUVECs were treated with hepatocyte-derived microparticles, microparticle-free supernatant, VNN1-neutralized microparticles, VEGF (100 ng/ml), and negative control for up to 16 hours. Cells were then treated with the 5-bromo-2′-deoxyuridine (BrdU) for up to 4 hours. After the labeling medium was removed, cells were resuspended in anti-BrdU antibody (1:8, BD) for 30 min at room temperature. Goat anti-mouse immunoglobulin G–Alexa Fluor 488 (1:500; Life Technologies) was added, and cells were incubated for 30 min at room temperature. Cells were counterstained with propidium iodide. FITC-positive cells were detected by the BD LSRII flow cytometer system and quantified as described previously (59).
In vitro and in vivo siRNA-mediated knockdowns
HepG2 cells were trypsinized, and 8 × 10⁵ cells were seeded in a six-well plate. To knock down VNN1 or PPARα in hepatocytes, HepG2 cells were incubated with 50 nM siRNA for VNN1 or PPARα and control siRNA dissolved in Lipofectamine 2000 (Life Technologies). Transfection was performed according to the manufacturer's instructions. Forty-eight hours after transfection, cells were treated with 0.25 mM palmitic acid for 24 hours, and microparticles were isolated from the supernatant by ultracentrifugation. Additionally, a flow cytometric analysis of hepatocyte-derived microparticles was performed with a phycoerythrin-conjugated VNN1 antibody (Santa Cruz Biotechnology) to test the efficiency of the transfection. To knock down cdc42, HUVECs were trypsinized, seeded in a six-well plate, and incubated with 50 nM cdc42 siRNA and control siRNA dissolved in Lipofectamine 2000 (Life Technologies). Transfection was performed according to the manufacturer's protocol. Forty-eight hours after transfection, cells were used for chemotaxis and tube formation assays. In vivo VNN1 knockdown during experimental NASH was performed by injecting VNN1 Stealth RNA (Life Technologies), control siRNA, or PBS as vehicle (mock) on a weekly basis into C57BL/6 mice fed with the MCD diet for 6 weeks. To deliver siRNA, we used Invivofectamine Rx (Life Technologies) according to the manufacturer's instructions. For the siRNA injection, the following approach was used: week 1, 3, and 5 mice received siRNA– Invivofectamine Rx (1.5 mg/kg) or control siRNA, whereas week 2, 4, and 6 mice received siRNA– Invivofectamine Rx (0.75 mg/kg) or control siRNA. As previously described, the siRNA injection in vivo does not cause any major pathological consequences in the liver or side effects in mice (60).
Internalization of microparticles into endothelial cells
To investigate microparticle internalization into HUVECs by flow cytometry, microparticles were stained with 1 µM calcein AM (MPcalcein) (BD Biosciences), a fluorescent dye with an emission wavelength of 515 nm, for 1 hour in the dark at 37°C. Microparticles were centrifuged twice with PBS for 30 min at 35,000 rpm and resuspended in 500 µl of EGM-2 medium. To block microparticle internalization, MPcalcein were incubated with or without rabbit polyclonal VNN1 antibody (4 µg/ml) (S3055; Epitomics) for 30 min at room temperature. A rabbit glyceraldehyde-3-phosphate dehydrogenase (GAPDH) antibody (Abcam) was used as a control. After the incubation, microparticles were incubated with serum-starved HUVECs seeded in a 24-well plate (15 × 104 cells per well) for 6 hours at 37°C. Cells were trypsinized, and FITC-positive HUVECs were detected with the BD LSRII flow cytometer system (BD) and counted. For the immunofluorescence studies, HUVECs were seeded in four-chamber culture slides (BD Biosciences) and serum-starved for 4 hours. Microparticles were isolated from the supernatant of HepG2 cells treated with palmitic acid, resuspended in 1 ml of Diluent C (G8278, Sigma-Aldrich), and gently pipetted to ensure complete dispersion. The 1-ml microparticle suspension was added to 1 ml of Diluent C with 4 µl of PKH26 solution (MPPKH26), a lipophilic dye that stably integrates into the cell membrane (MINI26, Sigma-Aldrich). The microparticle suspension was incubated in the dark for 4 min, and then 2 ml of 1% BSA was added and kept for 1 min to stop the reaction. The microparticle suspension was ultracentrifuged for 30 min at 35,000 rpm, and the pellet was resuspended in 200 µl of HUVEC medium. HUVECs seeded in the culture slide were incubated with MPPKH26 for 1 and 6 hours at 37°C in the dark. After incubation, medium was removed from each well, and HUVECs were washed twice with PBS and fixed with 4% paraformaldehyde solution in PBS for 10 min at room temperature. HUVECs were then stained with 5 µl of Alexa Fluor 488–phalloidin (Invitrogen) in 200 µl of PBS according to the manufacturer's instructions. After being washed three times with PBS, HUVECs were stained with DAPI (Vector Labs). Slides were imaged with an Olympus FV1000 spectral confocal microscope. The role of lipid rafts in the internalization of microparticles into HUVECs was investigated by cholesterol depletion and inhibition of the lipid raft–associated protein caveolin-1. HUVECs (4×10³ cells per well) were seeded onto a 24-well plate, and depletion of cholesterol was assessed by treatment with 10 mM MβCD in serum-free EBM-2 medium for 15 min at 37°C, followed by washing with fresh medium. To inhibit caveolin-1, HUVECs seeded in a 24-well plate were treated with rabbit anti-human caveolin-1 neutralizing antibody (2.5 µg/ml) (Sigma Aldrich) in serum-free EBM-2 medium containing 0.01% Triton X-100 for 30 min at 37°C, as previously described (27). Cholesterol-depleted or caveolin-1 neutralizing antibody–treated HUVECs were incubated for 6 hours with MPPKH26 to assess the internalization by immunofluorescence. The interaction between VNN1 on the microparticle surface and lipid rafts on HUVECs was assessed by electron microscopy, as previously reported (61). After washing, 1 to 2 ml of cold 4% paraformaldehyde in 0.1 M phosphate buffer were pipetted onto the HUVECs, which were then gently lifted off tissue culture plates with cell lifters. After a short low-speed spin, the fixative was removed from the pellet, and fresh fixative was added to resuspend the cells. The cells were then fixed at 4°C for 1 hour and washed extensively. After blocking for 30 min with 1% BSA in PBS, cells were incubated overnight at 4°C with rabbit anti-human polyclonal antibody against VNN1 (Epitomics) with gentle rotation. After washing, 15-nm protein A–gold conjugate (1:25 in 1% BSA) (Ted Pella) was bound to VNN1 for 2 hours at room temperature, with gentle rotation. The cells were washed carefully, and HRP was reacted with 3,3′-diaminobenzidine (DAB;10 mg/ml) in PBS for 5 min and then with DAB in PBS with 0.0003% H2O2 for 30 min in the dark. After being washed, cells were refixed with 1% glutaraldehyde and processed for routine electron microscopy. After standard ethanol dehydration, pellets were embedded in LX112 medium (Ladd) and polymerized for 48 hours at 60°C. Blocks were sectioned at 70 nm, and grids were viewed unstained to enhance HRP-DAB reaction.
Electron and confocal microscopy
For TEM, microparticles were adhered to 100-mesh Formvar- and carbon-coated grids for 5 min at room temperature. Grids were washed once with water, stained with 1% uranyl acetate (Ladd Research Industries) for 1 min, dried, and viewed with a JEOL 1200 EXII TEM. Images were captured with a Gatan Orius 600 digital camera (Gatan). Liver samples were collected from mice on the MCD diet after a short liver perfusion with 10 ml of 4% paraformaldehyde in 0.15 M sodium cacodylate buffer (pH 7.4) with a 21-gauge needle. Samples were immersed in modified Karnovsky's fixative [2.5% glutaraldehyde and 2% paraformaldehyde in 0.15 M sodium cacodylate buffer (pH 7.4)] for at least 4 hours, postfixed in 1% osmium tetroxide in 0.15 M cacodylate buffer for 1 hour, and stained en bloc in 3% uranyl acetate for 1 hour. Samples were dehydrated in ethanol, embedded in Durcupan epoxy resin (Sigma-Aldrich), sectioned at 50 to 60 nm on a Leica UCT ultramicrotome, and picked up on Formvar- and carbon-coated copper grids. Sections were stained with 3% uranyl acetate for 5 min and Sato's lead stain for 1 min. Grids were viewed with a JEOL 1200 EX II TEM and photographed with a Gatan digital camera (Gatan). Images of microparticles internalized by HUVECs were captured by an Olympus FV1000 spectral confocal microscope with 40× lens and Alexa Fluor 488 and Texas Red filters. Analysis of images was performed with ImageJ software (version 1.4.3.67). For the immunogold electron microscopy related to the internalization of VNN1-positive microparticles through the lipid raft, see “Internalization of microparticles into endothelial cells.”
RNA isolation, real-time polymerase chain reaction, and miRNA analysis
Tissue (liver, intestine, spleen, or kidney) from MCD- and MCS-fed mice (Casp3−/−, wild type, treated with VNN1 siRNA or controls) was homogenized with the FastPrep 24 bead homogenization system. HUVECs or HepG2 cells were trypsinized, resuspended in lysis buffer, and homogenized by mechanical fraction with a 1-ml syringe. Total RNA was isolated with RNeasy kit (Qiagen) and reverse-transcribed with iScript cDNA Synthesis Kit (Bio-Rad) according to the manufacturer's instructions. The concentration and purity of RNA were assessed by NanoDrop (Thermo Scientific). Quantitative real-time polymerase chain reaction (PCR) was performed on a Bio-Rad Cycler (Bio-Rad) with the SYBR Green Real-Time PCR Master Mix (Kapa Biosystems) according to the manufacturer's instructions. The housekeeping gene 18S was used as an internal control. The PCR primers used to amplify each gene were as follows: VEGF-A, 5′-GCACATAGAGAGAATGAGCTTCC-3′ (forward) and 5′-CTCCGCTCTGAACAAGGCT-3′ (reverse); FGF-β, 5′-TTGTGTCTATCAAGGGAGTGTGT-3′ (forward) and 5′-TGCCACATACCAACTGGAGTATT-3′ (reverse); VE-cadherin, 5′-CACTGCTTTGGGAGCCTTC-3′ (forward) and 5′-GGGGCAGCGATTCATTTTTCT-3′ (reverse); PPARγ, 5′-TACTGTCGGTTTCAGAAATGCC-3′ (forward) and 5′-GTCAGCGGACTCTGGATTCAG-3′ (reverse); PPARα, 5′-TTCGCAATCCATCGGCGAG-3′ (forward) and 5′-CCACAGGATAAGTCACCGAGG-3′ (reverse); murine VNN1, 5′-CTTTCCTCGCGGCTGTTTAC-3′ (forward) and 5′-CCTCCAGGTATGGGTAGATCGT-3′ (reverse); human VNN1, 5′-ACGTGGACACCATAGTATTCCC-3′ (forward) and 5′-ATGCAAGGAAATTGACCCTCAT-3′ (reverse). For isolation and quantification of miR-122, platelet-free plasma isolated from MCD-fed mice was incubated with ribonuclease (10 µg/ml; Roche) for 30 min at 37°C to remove any RNAs adhering to the external leaflet of circulating microparticles. Circulating microparticles were then ultracentrifuged at 100,000g for 90 min at 10°C. Total encapsulated RNAs in microparticles, including miRNAs, were isolated with miRNeasy Mini Kit (Qiagen). Complementary DNA (cDNA) was synthesized using specific miRNA primers (Applied Biosystems) with TaqMan MicroRNA Reverse Transcription Kit (Applied Biosystems). miRNA abundance was detected with TaqMan probe (Applied Biosystems) on a 7300 Real-Time PCR System (Applied Biosystems). The U6 snRNA was used as an internal control and to normalize miR-122 expression.
Sample preparation for MS
Protein samples were diluted in TNE buffer [50 mM tris (pH 8.0), 100 mM NaCl, 1 mM EDTA]. RapiGest SF reagent (Waters Corp.) was added to a final concentration of 0.1%, and samples were boiled for 5 min. TCEP [tris(2-carboxyethyl)phosphine] was added to a final concentration of 1 mM, and the samples were incubated at 37°C for 30 min. Subsequently, the samples were carboxymethylated with iodoacetamide (0.5 mg/ml) for 30 min at 37°C, followed by neutralization with 2 mM TCEP (final concentration). Protein samples prepared as above were digested with trypsin (trypsin/protein ratio, 1:50) overnight at 37°C. RapiGest was degraded and removed by treating the samples with 250 mM HCl at 37°C for 1 hour, followed by centrifugation at 14,000 rpm for 30 min at 4°C. The soluble fraction was then added to a new tube, and the peptides were extracted and desalted with Aspire RP30 desalting columns (Thermo Scientific) (62).
LC-MS/MS analysis
Trypsin-digested peptides were analyzed by high-performance liquid chromatography (HPLC) coupled with tandem mass spectroscopy (LC-MS/MS) using nanospray ionization (63). The nanospray ionization experiments were performed with a TripleTOF 5600 hybrid mass spectrometer (AB Sciex) interfaced with nanoscale reversed-phase HPLC (Tempo) with a glass capillary (10-cm length×100-µm inner diameter) packed with 5-µm C18 Zorbax beads (Agilent Technologies). Peptides were eluted from the C18 column into the mass spectrometer with a linear gradient (5 to 60%) of acetonitrile (ACN) at a flow rate of 250 µl/min for 1 hour. The buffers used to create the ACN gradient were as follows: buffer A [98% H2O, 2% ACN, 0.2% formic acid, and 0.005% trifluoroacetic acid (TFA)] and buffer B (100% ACN, 0.2% formic acid, and 0.005% TFA). MS/MS data were acquired in a data-dependent manner in which the MS1 data were acquired for 250 ms at mass/charge ratios (m/z) of 400 to 1250 daltons, and the MS/MS data were acquired from m/z of 50 to 2000 daltons. The independent data acquisition criteria included 50 MS2 scans from the survey MS1 scan where the parent ion signal intensity was above 200 counts threshold and the charge state of parent ion was +2 to +4 ions and the exclusion time was set to 4 s. Finally, the collected data were analyzed with Mascot (Matrix Sciences) and ProteinPilot 4.0 (AB Sciex) for peptide identification.
Protein analysis
HepG2 were treated with 1% BSA and 0.25 mM palmitic acid or oleic acid for 24 hours. Whole-cell lysates were digested in 400 µl of radioimmunoprecipitation assay buffer containing Protease Inhibitor Cocktail tablets (Roche). Microparticles were isolated from the same cells or from animal blood and resuspended in lysis buffer. Proteins were measured with the Pierce BCA Protein Assay Kit (Thermo Scientific). About 10 µg of protein for microparticles and 30 to 40 µg of protein for HepG2 cells were resolved by 4 to 20% tris-HCl gel electrophoresis (Bio-Rad) and transferred onto polyvinylidene difluoride membranes (Bio-Rad). The membranes were blocked for 1 hour at room temperature with 3 to 5% low-fat milk (Bio-Rad) in 1× PBS, 0.1% Tween 20 (PBS-T). Primary rabbit anti-human polyclonal antibody against VNN1 (Epitomics), anti-mouse VNN1 (Proteintech), antibody against vascular cell adhesion molecule–1 (Santa Cruz Biotechnology), mouse monoclonal antibody against intercellular adhesion molecule–1 (Abnova), and anti-GAPDH (Cell Signaling) were incubated overnight at 4°C. After being washed with PBS-T, the membranes were incubated with goat anti-rabbit or mouse secondary antibody, and proteins were visualized with SuperSignal West Pico chemiluminescence substrate (Pierce Biotechnology). Densitometry analysis of the specific protein bands was performed with ImageJ (version 1.4.3.67).
Statistical analysis
Data are presented as means ± SD unless otherwise indicated. Differences between three or more groups were compared by ANOVA. If data deviated from the normal distribution, a nonparametric Kruskal-Wallis test was performed. If a significant effect was detected, post hoc pairwise comparisons were performed with Bonferroni correction. Differences between two groups of data with a nonnormal distribution were compared by the Mann-Whitney test. The Kolmogorov-Smirnov test was used to determine the normal distribution of data. Differences were considered to be statistically significant at P < 0.05. Statistical analysis was performed with GraphPad Prism 4.0c.
Supplementary Material
Supplemental Figure 1. HepG2 exposed to different saturated and unsaturated free fatty acids. Representative micrographs of Oil red-O staining for lipid droplets in HepG2 exposed to 1% BSA (control) or 0.25 mM of oleic, palmitic and stearic acid for 24 h. 20× magnification was used for acquisition of the pictures.
Supplemental Figure 2. Effect of lipotoxic FFAs is counteracted by non-lipotoxic FFAs. HepG2 were exposed to 0.25 mM of palmitic acid, oleic acid and a mixture of both up to 24 hrs. MPs were isolated from the supernatant and Annexin V+ positive MPs were detected by flow cytometry and quantity is reported in the graph. Values represent mean ± S.D. * P < 0.05; ** P < 0.01; ***P < 0.001 compared to controls.
Supplemental Figure 3. Cellular localization and molecular function of proteins from hepatocyte-derived MPs. All the proteins obtained by three different proteomics analysis of MPs from HepG2 cells exposed to palmitic acid were organized based on cellular localization (top pie chart) and molecular function (bottom pie chart). Percentages over the total number of proteins were reported in the pie charts.
Supplemental Figure 4. MPs released by fat-laden rat primary hepatocytes are potent inducers of angiogenesis. (A) Representative micrographs of tube formation of HUVECs after exposure up to 6 h to rat primary hepatocytes-derived MPs, MP-free supernatant or controls. (B) HUVECs total tube length has been measured and reported in the histogram. (C) Representative micrographs of chemotaxis assay (Boyden's chamber assay) of HUVECs were tested with primary hepatocytes-derived MPs, MP-free supernatant or controls, as described in Methods. A 10× magnification was used for microscopic pictures. (D) An average of HUVECs migrated into the filter was measured and reported in the graph. VEGF (100 ng/ml) was used as a positive control. Values represent mean ± S.D. from three independent experiments. * P < 0.05; ** P < 0.01; ***P < 0.001 compared to controls.
Supplemental Figure 5. Pro-angiogenic effect of hepatocytes-derived MPs is dose-dependent. HepG2 were treated with 0.25 mM of palmitic acid up to 24 h and MPs were isolated from the supernatant by ultracentrifugation. MPs samples were quantified by BCA protein assay and the concentration has been determined. Different doses (50, 125, 250 and 500 µg/mL) have been used for assessing (A) HUVECs tube formation and (B) chemotaxis assay (Boyden's chamber assay). Quantification graphs are reported in the figure. A dose of 100 ng/mL of VEGF has been used as positive control. Values represent mean ± S.D. * P < 0.05; ** P < 0.01; ***P < 0.001 compared to controls.
Supplemental Figure 6. Endothelial cells angiogenesis in vitro depends on internalization of MPs into HUVECs. Representative micrographs of tube formation of HUVECs after exposure to HepG2-derived MPsCalcein up to 6 hours. HUVECs tubes were detected by an Olympus FV1000 Spectral Confocal with 20× lens.
Supplemental Figure 7. Genetic suppression of VNN1 expression on MPs significantly reduced the pro-angiogenic effects of MPs on endothelial cell migration and tube formation. HepG2 were exposed to palmitic acid (PA) for 24 h and then treated with VNN1 siRNA or control RNA (Ctrl RNA). Representative micrographs of (A) tube formation and (B) chemotaxis (Boyden's chamber assay) of HUVECs treated with hepatocyte-derived MPs, MP-free supernatant (MP-free sup.) or controls for 6 h and 16 h, respectively. A dose of 100 ng/mL of VEGF was used as positive control. A 4× magnification was used for acquisition of pictures.
Supplemental Figure 8. Pro-angiogenic effect of hepatocytes-derived microparticles acts through VNN1-dependent internalization. (A) Fat-laden HepG2-derived MPs were stained with 1 µM of Calcein AM-FITC (MPsCalcein), washed to removed unspecific bound and incubated with or without a neutralizing antibody anti-VNN1 (4 µg/mL) (VNN1 nAb) and anti-GAPDH for 30 minutes. MPs were then incubated with HUVECs for 6 hours and FITC-positive events were detected by FACS. (B) Number of FITC-positive HUVECs exposed to MPCalcein with or without VNN1 were reported in graph; (C) tube formation of HUVECs after exposure for 6 hours to HepG2-derived MPs with or without VNN1 or controls; (D) chemotaxis assay of HUVECs was performed with HepG2-derived MPs with or without VNN1 or controls as described in Methods. (E) Protein expression of endothelial cells markers activation, ICAM-1 and VCAM-1, after exposure up to 6 hours with hepatocytes-derived MPs or MPs pre-incubated with a VNN1 neutralizing antibody. GAPDH was used as loading control. (F) Glutathione activity assay analysis in HUVECs treated with HepG2-derived MPs with or without VNN1 or controls. Glutathione activity is reported in RFU. * P < 0.05; ** P < 0.01; ***P < 0.001, compared to controls.
Supplemental Figure 9. Proangiogenic effects of VNN1 positive MPs are not mediated by induction of endothelial cell proliferation or modulation of PPAR-γ expression. Fat-laden HepG2-derived MPs were incubated with or without a rabbit polyclonal antibody anti-VNN1 (4 µg/mL) for 30 minutes. A BrdU proliferation assay has been performed with HUVECs incubated for 16 h with MPs, MPs and VNN1 neutralizing Ab or controls. (A) Flow cytometry analysis gating (P3) proliferating-FITC-positive HUVECs. A BrdU negative staining has been included as negative control. (B) RNA was isolated from HUVECs that were incubated for 16 h with MPs, MPs and VNN1 nAb or controls in order to determine the expression of PPAR-γ by quantitative PCR. The housekeeping gene 18S was used as an internal control. Values represent mean ± S.D. * P < 0.05; ** P < 0.01; ***P < 0.001 compared to controls.
Supplemental Figure 10. Increase of VNN1 in hepatocytes during lipotoxicity is independent of PPARα and γ. (A) Quantitative PCR of PPARγ expression in HepG2 treated with 0.25 mM of palmitic acid (PA) or 1% BSA (vehicle) for 24 h. (B) Quantitative PCR for PPARα and (C) VNN1 in HepG2 treated with 1% BSA, 0.25 mM of palmitic acid (PA), oleic acid (OA) or palmitic acid/oleic acid mix for 24 h. (D) Quantitative PCR for PPARα and (E) VNN1 in HepG2 exposed to 1% BSA, 0.25 mM of palmitic acid (PA), oleic acid (OA) or palmitic acid/oleic acid mix for 24 h and treated with PPARα siRNA or control RNA (Ctrl RNA).
Supplementary Figure 11. Release of circulating microparticles depends on the stage of NASH. C57/B6 mice (n=5) were put on a MCD, high fat/high carbohydrates (HF/HCarb) or chow diet for 6 weeks. (A) Circulating MPs were isolated as described in Methods and Annexin V+ MPs were detected by flow cytometry. (B) H-E staining. (C) NAFLD activity score. Values represent mean ± S.D. * P < 0.05; ** P < 0.01; ***P < 0.001 compared to controls.
Supplementary Figure 12. Circulating MPs from mice with NASH stimulate angiogenesis ex vivo. C57/B6 mice were put on a MCD, high fat/high carbohydrates (HF/HCarb) and chow diet for 6 weeks, platelet-free plasma was harvested and MPs were isolated as described in Methods. MPs and MPs-free supernatant were used to induce HUVECs tube formation and oriented migration (Boyden's chamber assay) ex vivo. Quantification of (A) HUVECs tube formation (total tube length) and (B) chemotaxis assay (Boyden's chamber assay) is reported in the graph. A dose of 100 ng/mL of VEGF has been used as positive control. Values represent mean ± S.D. * P < 0.05; ** P < 0.01; ***P < 0.001 compared to controls.
Supplemental Figure 13. Liver specific in vivo silencing of VNN1 does not affect VNN1 expression in other tissues. Expression of VNN1 was assessed in (A) kidney, (B) intestine and (C) spleen harvested from MCD-fed mice treated with VNN1 siRNA, control RNA (CTRL RNA) or PBS (Mock) to confirm the liver-specific knockdown of VNN1. The housekeeping gene 18S was used as an internal control. Values represent mean ± S.D. * P < 0.05; ** P < 0.01; ***P < 0.001 compared to controls.
Supplemental Figure 14. Casp3-/- mice are protected from MCD-induced pathological angiogenesis and liver fibrosis. (A) Representative micrographs for H-E staining, immunostaining for CD-31, vonWillebrand factor (vWF) and Sirius red staining of liver specimens harvested from WT and Caspase-3 KO mice fed the MCD or control diet (MCS) diet for 6 weeks. A 10× magnification was used for micrographs. (B) Total area in pixel (px) is reported in the graph to show the quantification of CD31 immunostaining. (C) Percentage of fibrosis was measured by using Image J. (C) RNA was isolated from liver samples of C57BL/6 Casp3-/- and WT mice, fed a MCD or MCS diet. Analysis of the transcripts for the pro-angiogenic genes (VEGF-B and FGF-ß) and pro-fibrogenic genes (Collagen type I and α-SMA) was assessed by quantitative PCR. The housekeeping gene 18S was used as an internal control. Values represent mean ± S.D. * P < 0.05; ** P < 0.01; ***P < 0.001 compared to controls.
Supplemental Table 1. Identification of the whole hepatocytes-derived microparticles proteins based on the LC-MS/MS-derived sequences. Pure hepatocytes-derived microparticles were isolated and processed for a complete proteomics analysis as described in the ‘Methods’ paragraph. The proteins detected are listed in the table with the corresponding uniprot accession code, number of peptides, biological function and cellular localization.
Acknowledgments
We thank J. Drazba and E. Diskin for the valuable technical support, the University of California, San Diego (UCSD), Neuroscience Core, especially J. Santini, for microscopy assistance and grant NS047101. We also thank B. Papouchado for the histopathological analysis, M. Farquhar for the use of the electron microscopy facility, T. Meerloo and Y. Jones for electron microscopy sample preparation, M. Ghassemian for the proteomic analysis, and A. Narasimha and S. Dowdy for critical input. We thank the Moores Cancer Center Histology Core for technical assistance and expertise. We acknowledge H. Li of the UCSD Moores Cancer Center-Division of Biostatistics and Bioinformatics for advice on statistical analysis. We thank P. Naquet for his thoughtful and constructive feedback on the MS.
Funding: This work was supported by NIH grants DK076852 and DK082451 to A.E.F., Veteran Affairs Merit Award from the Department of Veterans Affairs BX001963 to H.H.P., and NIH grants HL091071 and HL107200 to H.H.P.
Abbreviations used
- MPs
microparticles
- FFA
free fatty acids
- VNN1
Vanin-1 (murine or human)
- PFP
platelet-free plasma
- MCD
methionine choline deficient
- MCS
methionine choline supplemented
- HF/HCarb
high fat/high carbohydrates
- PA
palmitic acid
- SA
stearic acid
- OA
oleic acid
- TGF-β
transforming growth factor-beta
- EGF
epidermal growth factor
- FGF-β/-α
fibroblast growth factor beta and alpha
- α-SMA
alpha-smooth muscle actin
- CTGF
connective tissue growth factor
- HUVEC
human umbilical vein endothelial cell
- HepG2
human hepatoma cell line
- GPI-AP
glycosylphosphatidylinositol-anchored protein
- MβCD
Methyl-β-cyclodextrin
Footnotes
Financial Disclosures: None
Author contributions: D.P. participated in the design of experiments, performed experiments in vivo and in vitro, interpreted the data, and drafted and revised the manuscript; A.E. participated in project design, performed in vivo siRNA experiments, and interpreted the data; I.R.N. performed electron microscopy experiments for internalization of microparticles; N.A. and X.d.M.d.J. designed, prepared, and provided Stealth RNA for VNN1 in vivo; A.M. helped with experiments related to microparticle characterization; M.B. provided technical support; M.L. assisted with animal experiments and data analysis; S.T. provided technical support for caspase 3 knockout mice; M.P. contributed to drafting of the manuscript; H.H.P. contributed to the design of experiments related to lipid drafts and helped with interpretation of the data; and A.E.F. conceived the idea, helped design the experiments, provided the funding for the study, and helped draft and critically revise the manuscript.
Competing interests: UCSD has filed a patent related to this study. A.E.F. is on the scientific advisory board for Gilead, Vertex, Abbott, Genentech, and Takeda and is listed as coinventor on pending and issued patents filed by the Cleveland Clinic and UCSD that refer to the use of biomarkers in fatty liver disorders. The other authors declare that they have no competing interests.
Data and materials availability: The MS raw data have been deposited at Peptide Atlas with identifier number of PASS00327 and data tag of microparticle_HepG2.
References
- 1.Alisi A, Feldstein AE, Villani A, Raponi M, Nobili V. Pediatric nonalcoholic fatty liver disease: A multidisciplinary approach. Nat Rev Gastroenterol Hepatol. 2012;9:152–161. doi: 10.1038/nrgastro.2011.273. [DOI] [PubMed] [Google Scholar]
- 2.Angulo P. Nonalcoholic fatty liver disease. N Engl J Med. 2002;346:1221–1231. doi: 10.1056/NEJMra011775. [DOI] [PubMed] [Google Scholar]
- 3.Wieckowska A, Feldstein AE. Nonalcoholic fatty liver disease in the pediatric population: A review. Curr Opin Pediatr. 2005;17:636–641. doi: 10.1097/01.mop.0000172816.79637.c5. [DOI] [PubMed] [Google Scholar]
- 4.Brunt EM. Pathology of fatty liver disease. Mod Pathol. 2007;20(suppl. 1):S40–S48. doi: 10.1038/modpathol.3800680. [DOI] [PubMed] [Google Scholar]
- 5.Adams LA, Lymp JF, St Sauver J, Sanderson SO, Lindor KD, Feldstein A, Angulo P. The natural history of nonalcoholic fatty liver disease: A population-based cohort study. Gastroenterology. 2005;129:113–121. doi: 10.1053/j.gastro.2005.04.014. [DOI] [PubMed] [Google Scholar]
- 6.Ascha MS, Hanouneh IA, Lopez R, Tamimi TA, Feldstein AF, Zein NN. The incidence and risk factors of hepatocellular carcinoma in patients with nonalcoholic steatohepatitis. Hepatology. 2010;51:1972–1978. doi: 10.1002/hep.23527. [DOI] [PubMed] [Google Scholar]
- 7.Coulon S, Heindryckx F, Geerts A, Van Steenkiste C, Colle I, Van Vlierberghe H. Angiogenesis in chronic liver disease and its complications. Liver Int. 2011;31:146–162. doi: 10.1111/j.1478-3231.2010.02369.x. [DOI] [PubMed] [Google Scholar]
- 8.Yilmaz Y, Yonal O, Kurt R, Alahdab YO, Ozdogan O, Celikel CA, Ulukaya E, Imeryuz N, Kalayci C, Avsar E. Circulating levels of vascular endothelial growth factor A and its soluble receptor in patients with biopsy-proven nonalcoholic fatty liver disease. Arch Med Res. 2011;42:38–43. doi: 10.1016/j.arcmed.2010.12.001. [DOI] [PubMed] [Google Scholar]
- 9.Kitade M, Yoshiji H, Kojima H, Ikenaka Y, Noguchi R, Kaji K, Yoshii J, Yanase K, Namisaki T, Asada K, Yamazaki M, Tsujimoto T, Akahane T, Uemura M, Fukui H. Leptin-mediated neovascularization is a prerequisite for progression of nonalcoholic steatohepatitis in rats. Hepatology. 2006;44:983–991. doi: 10.1002/hep.21338. [DOI] [PubMed] [Google Scholar]
- 10.Kitade M, Yoshiji H, Kojima H, Ikenaka Y, Noguchi R, Kaji K, Yoshii J, Yanase K, Namisaki T, Yamazaki M, Tsujimoto T, Moriya K, Kawaratani H, Akahane T, Fukui H. Neovascularization and oxidative stress in the progression of non-alcoholic steatohepatitis. Mol Med Rep. 2008;1:543–548. [PubMed] [Google Scholar]
- 11.Yoshiji H, Noguchi R, Ikenaka Y, Namisaki T, Kitade M, Kaji K, Shirai Y, Yoshii J, Yanase K, Yamazaki M, Tsujimoto T, Kawaratani H, Akahane T, Aihara Y, Fukui H. Losartan, an angiotensin-II type 1 receptor blocker, attenuates the liver fibrosis development of non-alcoholic steatohepatitis in the rat. BMC Res Notes. 2009;2:70. doi: 10.1186/1756-0500-2-70. [DOI] [PMC free article] [PubMed] [Google Scholar]
- 12.Kitade M, Yoshiji H, Noguchi R, Ikenaka Y, Kaji K, Shirai Y, Yamazaki M, Uemura M, Yamao J, Fujimoto M, Mitoro A, Toyohara M, Sawai M, Yoshida M, Morioka C, Tsujimoto T, Kawaratani H, Fukui H. Crosstalk between angiogenesis, cytokeratin-18, and insulin resistance in the progression of non-alcoholic steatohepatitis. World J Gastroenterol. 2009;15:5193–5199. doi: 10.3748/wjg.15.5193. [DOI] [PMC free article] [PubMed] [Google Scholar]
- 13.Browning JD, Horton JD. Molecular mediators of hepatic steatosis and liver injury. J Clin Invest. 2004;114:147–152. doi: 10.1172/JCI22422. [DOI] [PMC free article] [PubMed] [Google Scholar]
- 14.Trauner M, Arrese M, Wagner M. Fatty liver and lipotoxicity. Biochim Biophys Acta. 2010;1801:299–310. doi: 10.1016/j.bbalip.2009.10.007. [DOI] [PubMed] [Google Scholar]
- 15.Feldstein AE, Werneburg NW, Canbay A, Guicciardi ME, Bronk SF, Rydzewski R, Burgart LJ, Gores GJ. Free fatty acids promote hepatic lipotoxicity by stimulating TNF-α expression via a lysosomal pathway. Hepatology. 2004;40:185–194. doi: 10.1002/hep.20283. [DOI] [PubMed] [Google Scholar]
- 16.Li ZZ, Berk M, McIntyre TM, Feldstein AE. Hepatic lipid partitioning and liver damage in nonalcoholic fatty liver disease: Role of stearoyl-CoA desaturase. J Biol Chem. 2009;284:5637–5644. doi: 10.1074/jbc.M807616200. [DOI] [PMC free article] [PubMed] [Google Scholar]
- 17.György B, Szabó TG, Pásztói M, Pál Z, Misják P, Aradi B, László V, Pállinger E, Pap E, Kittel A, Nagy G, Falus A, Buzás EI. Membrane vesicles, current state-of-the-art: Emerging role of extracellular vesicles. Cell Mol Life Sci. 2011;68:2667–2688. doi: 10.1007/s00018-011-0689-3. [DOI] [PMC free article] [PubMed] [Google Scholar]
- 18.Andaloussi SEL, Mäger I, Breakefield XO, Wood MJ. Extracellular vesicles: Biology and emerging therapeutic opportunities. Nat Rev Drug Discov. 2013;12:347–357. doi: 10.1038/nrd3978. [DOI] [PubMed] [Google Scholar]
- 19.Coleman ML, Sahai EA, Yeo M, Bosch M, Dewar A, Olson MF. Membrane blebbing during apoptosis results from caspase-mediated activation of ROCK I. Nat Cell Biol. 2001;3:339–345. doi: 10.1038/35070009. [DOI] [PubMed] [Google Scholar]
- 20.Sebbagh M, Renvoizé C, Hamelin J, Riché N, Bertoglio J, Bréard J. Caspase-3-mediated cleavage of ROCK I induces MLC phosphorylation and apoptotic membrane blebbing. Nat Cell Biol. 2001;3:346–352. doi: 10.1038/35070019. [DOI] [PubMed] [Google Scholar]
- 21.Pitari G, Malergue F, Martin F, Philippe JM, Massucci MT, Chabret C, Maras B, Duprè S, Naquet P, Galland F. Pantetheinase activity of membrane-bound Vanin-1: Lack of free cysteamine in tissues of Vanin-1 deficient mice. FEBS Lett. 2000;483:149–154. doi: 10.1016/s0014-5793(00)02110-4. [DOI] [PubMed] [Google Scholar]
- 22.Berruyer C, Pouyet L, Millet V, Martin FM, LeGoffic A, Canonici A, Garcia S, Bagnis C, Naquet P, Galland F. Vanin-1 licenses inflammatory mediator production by gut epithelial cells and controls colitis by antagonizing peroxisome proliferator-activated receptor activity. J Exp Med. 2006;203:2817–2827. doi: 10.1084/jem.20061640. [DOI] [PMC free article] [PubMed] [Google Scholar]
- 23.Simons K, Toomre D. Lipid rafts and signal transduction. Nat Rev Mol Cell Biol. 2000;1:31–39. doi: 10.1038/35036052. [DOI] [PubMed] [Google Scholar]
- 24.Chazal N, Gerlier D. Virus entry, assembly, budding, and membrane rafts. Microbiol Mol Biol Rev. 2003;67:226–237. doi: 10.1128/MMBR.67.2.226-237.2003. [DOI] [PMC free article] [PubMed] [Google Scholar]
- 25.Patel HH, Insel PA. Lipid rafts and caveolae and their role in compartmentation of redox signaling. Antioxid Redox Signal. 2009;11:1357–1372. doi: 10.1089/ars.2008.2365. [DOI] [PMC free article] [PubMed] [Google Scholar]
- 26.Svensson KJ, Christianson HC, Wittrup A, Bourseau-Guilmain E, Lindqvist E, Svensson LM, Mörgelin M, Belting M. Exosome uptake depends on ERK1/2-heat shock protein 27 signaling and lipid raft-mediated endocytosis negatively regulated by caveolin-1. J Biol Chem. 2013;288:17713–17724. doi: 10.1074/jbc.M112.445403. [DOI] [PMC free article] [PubMed] [Google Scholar]
- 27.Park H, Go YM, Darji R, Choi JW, Lisanti MP, Maland MC, Jo H. Caveolin-1 regulates shear stress-dependent activation of extracellular signal-regulated kinase. Am J Physiol Heart Circ Physiol. 2000;278:H1285–H1293. doi: 10.1152/ajpheart.2000.278.4.H1285. [DOI] [PubMed] [Google Scholar]
- 28.Koteish A, Diehl AM. Animal models of steatosis. Semin Liver Dis. 2001;21:89–104. doi: 10.1055/s-2001-12932. [DOI] [PubMed] [Google Scholar]
- 29.Christian AE, Haynes MP, Phillips MC, Rothblat GH. Use of cyclodextrins for manipulating cellular cholesterol content. J Lipid Res. 1997;38:2264–2272. [PubMed] [Google Scholar]
- 30.Sabharanjak S, Sharma P, Parton RG, Mayor S. GPI-anchored proteins are delivered to recycling endosomes via a distinct cdc42-regulated, clathrin-independent pinocytic pathway. Dev Cell. 2002;2:411–423. doi: 10.1016/s1534-5807(02)00145-4. [DOI] [PubMed] [Google Scholar]
- 31.Lakhan SE, Sabharanjak S, De A. Endocytosis of glycosylphosphatidylinositol-anchored proteins. J Biomed Sci. 2009;16:93. doi: 10.1186/1423-0127-16-93. [DOI] [PMC free article] [PubMed] [Google Scholar]
- 32.Nakabayashi H, Shimizu K. HA1077, a Rho kinase inhibitor, suppresses glioma-induced angiogenesis by targeting the Rho-ROCK and the mitogen-activated protein kinase kinase/extracellular signal-regulated kinase (MEK/ERK) signal pathways. Cancer Sci. 2011;102:393–399. doi: 10.1111/j.1349-7006.2010.01794.x. [DOI] [PubMed] [Google Scholar]
- 33.Dammanahalli KJ, Stevens S, Terkeltaub R. Vanin-1 pantetheinase drives smooth muscle cell activation in post-arterial injury neointimal hyperplasia. PLOS One. 2012;7:e39106. doi: 10.1371/journal.pone.0039106. [DOI] [PMC free article] [PubMed] [Google Scholar]
- 34.Liebl J, Weitensteiner SB, Vereb G, Takács L, Fürst R, Vollmar AM, Zahler S. Cyclin-dependent kinase 5 regulates endothelial cell migration and angiogenesis. J Biol Chem. 2010;285:35932–35943. doi: 10.1074/jbc.M110.126177. [DOI] [PMC free article] [PubMed] [Google Scholar]
- 35.Rogue A, Lambert C, Josse R, Antherieu S, Spire C, Claude N, Guillouzo A. Comparative gene expression profiles induced by PPAR and PPARα/agonists in human hepatocytes. PLOS One. 2011;6:e18816. doi: 10.1371/journal.pone.0018816. [DOI] [PMC free article] [PubMed] [Google Scholar]
- 36.Kohli R, Feldstein AE. NASH animal models: Are we there yet? J Hepatol. 2011;55:941–943. doi: 10.1016/j.jhep.2011.04.010. [DOI] [PubMed] [Google Scholar]
- 37.Yamaguchi K, Yang L, McCall S, Huang J, Yu XX, Pandey SK, Bhanot S, Monia BP, Li YX, Diehl AM. Inhibiting triglyceride synthesis improves hepatic steatosis but exacerbates liver damage and fibrosis in obese mice with nonalcoholic steatohepatitis. Hepatology. 2007;45:1366–1374. doi: 10.1002/hep.21655. [DOI] [PubMed] [Google Scholar]
- 38.Fu JH, Sun HS, Wang Y, Zheng WQ, Shi ZY, Wang QJ. The effects of a fat- and sugar-enriched diet and chronic stress on nonalcoholic fatty liver disease in male Wistar rats. Dig Dis Sci. 2010;55:2227–2236. doi: 10.1007/s10620-009-1019-6. [DOI] [PubMed] [Google Scholar]
- 39.Nascimento FA, Barbosa-da-Silva S, Fernandes-Santos C, Mandarim-de-Lacerda CA, Aguila MB. Adipose tissue, liver and pancreas structural alterations in C57BL/6 mice fed high-fat-high-sucrose diet supplemented with fish oil (n-3 fatty acid rich oil) Exp Toxicol Pathol. 2010;62:17–25. doi: 10.1016/j.etp.2008.12.008. [DOI] [PubMed] [Google Scholar]
- 40.Castoldi M, Vujic Spasic M, Altamura S, Elmén J, Lindow M, Kiss J, Stolte J, Sparla R, D'Alessandro LA, Klingmüller U, Fleming RE, Longerich T, Gröne HJ, Benes V, Kauppinen S, Hentze MW, Muckenthaler MU. The liver-specific microRNA miR-122 controls systemic iron homeostasis in mice. J Clin Invest. 2011;121:1386–1396. doi: 10.1172/JCI44883. [DOI] [PMC free article] [PubMed] [Google Scholar]
- 41.Bala S, Petrasek J, Mundkur S, Catalano D, Levin I, Ward J, Alao H, Kodys K, Szabo G. Circulating microRNAs in exosomes indicate hepatocyte injury and inflammation in alcoholic, drug-induced, and inflammatory liver diseases. Hepatology. 2012;56:1946–1957. doi: 10.1002/hep.25873. [DOI] [PMC free article] [PubMed] [Google Scholar]
- 42.Carmeliet P, Lampugnani MG, Moons L, Breviario F, Compernolle V, Bono F, Balconi G, Spagnuolo R, Oosthuyse B, Dewerchin M, Zanetti A, Angellilo A, Mattot V, Nuyens D, Lutgens E, Clotman F, de Ruiter MC, Gittenberger-de Groot A, Poelmann R, Lupu F, Herbert JM, Collen D, Dejana E. Targeted deficiency or cytosolic truncation of the VE-cadherin gene in mice impairs VEGF-mediated endothelial survival and angiogenesis. Cell. 1999;98:147–157. doi: 10.1016/s0092-8674(00)81010-7. [DOI] [PubMed] [Google Scholar]
- 43.Paternostro C, David E, Novo E, Parola M. Hypoxia, angiogenesis and liver fibrogenesis in the progression of chronic liver diseases. World J Gastroenterol. 2010;16:281–288. doi: 10.3748/wjg.v16.i3.281. [DOI] [PMC free article] [PubMed] [Google Scholar]
- 44.Coulon S, Legry V, Heindryckx F, Van Steenkiste C, Casteleyn C, Olievier K, Libbrecht L, Carmeliet P, Jonckx B, Stassen JM, Van Vlierberghe H, Leclercq I, Colle I, Geerts A. Role of vascular endothelial growth factor in the pathophysiology of nonalcoholic steatohepatitis in two rodent models. Hepatology. 2013;57:1793–1805. doi: 10.1002/hep.26219. [DOI] [PubMed] [Google Scholar]
- 45.Moldovan NI. Role of monocytes and macrophages in adult angiogenesis: A light at the tunnel's end. J Hematother Stem Cell Res. 2002;11:179–194. doi: 10.1089/152581602753658394. [DOI] [PubMed] [Google Scholar]
- 46.Giraudo E, Inoue M, Hanahan D. An amino-bisphosphonate targets MMP-9–expressing macrophages and angiogenesis to impair cervical carcinogenesis. J Clin Invest. 2004;114:623–633. doi: 10.1172/JCI22087. [DOI] [PMC free article] [PubMed] [Google Scholar]
- 47.Rautou PE, Bresson J, Sainte-Marie Y, Vion AC, Paradis V, Renard JM, Devue C, Heymes C, Letteron P, Elkrief L, Lebrec D, Valla D, Tedgui A, Moreau R, Boulanger CM. Abnormal plasma microparticles impair vasoconstrictor responses in patients with cirrhosis. Gastroenterology. 2012;143:166–176. doi: 10.1053/j.gastro.2012.03.040. e166. [DOI] [PubMed] [Google Scholar]
- 48.Witek RP, Yang L, Liu R, Jung Y, Omenetti A, Syn WK, Choi SS, Cheong Y, Fearing CM, Agboola KM, Chen W, Diehl AM. Liver cell–derived microparticles activate hedgehog signaling and alter gene expression in hepatic endothelial cells. Gastroenterology. 2009;136:320–330. doi: 10.1053/j.gastro.2008.09.066. e322. [DOI] [PMC free article] [PubMed] [Google Scholar]
- 49.Kornek M, Lynch M, Mehta SH, Lai M, Exley M, Afdhal NH, Schuppan D. Circulating microparticles as disease-specific biomarkers of severity of inflammation in patients with hepatitis C or nonalcoholic steatohepatitis. Gastroenterology. 2012;143:448–458. doi: 10.1053/j.gastro.2012.04.031. [DOI] [PMC free article] [PubMed] [Google Scholar]
- 50.Morel O, Morel N, Jesel L, Freyssinet JM, Toti F. Microparticles: A critical component in the nexus between inflammation, immunity, and thrombosis. Semin Immunopathol. 2011;33:469–486. doi: 10.1007/s00281-010-0239-3. [DOI] [PubMed] [Google Scholar]
- 51.Rautou PE, Vion AC, Amabile N, Chironi G, Simon A, Tedgui A, Boulanger CM. Microparticles, vascular function, and atherothrombosis. Circ Res. 2011;109:593–606. doi: 10.1161/CIRCRESAHA.110.233163. [DOI] [PubMed] [Google Scholar]
- 52.Miguet L, Pacaud K, Felden C, Hugel B, Martinez MC, Freyssinet JM, Herbrecht R, Potier N, van Dorsselaer A, Mauvieux L. Proteomic analysis of malignant lymphocyte membrane microparticles using double ionization coverage optimization. Proteomics. 2006;6:153–171. doi: 10.1002/pmic.200500133. [DOI] [PubMed] [Google Scholar]
- 53.Peterson DB, Sander T, Kaul S, Wakim BT, Halligan B, Twigger S, Pritchard KA, Jr, Oldham KT, Ou JS. Comparative proteomic analysis of PAI-1 and TNF-alpha-derived endothelial microparticles. Proteomics. 2008;8:2430–2446. doi: 10.1002/pmic.200701029. [DOI] [PMC free article] [PubMed] [Google Scholar]
- 54.Prokopi M, Pula G, Mayr U, Devue C, Gallagher J, Xiao Q, Boulanger CM, Westwood N, Urbich C, Willeit J, Steiner M, Breuss J, Xu Q, Kiechl S, Mayr M. Proteomic analysis reveals presence of platelet microparticles in endothelial progenitor cell cultures. Blood. 2009;114:723–732. doi: 10.1182/blood-2009-02-205930. [DOI] [PubMed] [Google Scholar]
- 55.Conde-Vancells J, Rodriguez-Suarez E, Embade N, Gil D, Matthiesen R, Valle M, Elortza F, Lu SC, Mato JM, Falcon-Perez JM. Characterization and comprehensive proteome profiling of exosomes secreted by hepatocytes. J Proteome Res. 2008;7:5157–5166. doi: 10.1021/pr8004887. [DOI] [PMC free article] [PubMed] [Google Scholar]
- 56.Nanji AA. Animal models of nonalcoholic fatty liver disease and steatohepatitis. Clin Liver Dis. 2004;8:559–574. doi: 10.1016/j.cld.2004.04.002. [DOI] [PubMed] [Google Scholar]
- 57.Woo M, Hakem R, Soengas MS, Duncan GS, Shahinian A, Kägi D, Hakem A, McCurrach M, Khoo W, Kaufman SA, Senaldi G, Howard T, Lowe SW, Mak TW. Essential contribution of caspase 3/CPP32 to apoptosis and its associated nuclear changes. Genes Dev. 1998;12:806–819. doi: 10.1101/gad.12.6.806. [DOI] [PMC free article] [PubMed] [Google Scholar]
- 58.Kornek M, Popov Y, Libermann TA, Afdhal NH, Schuppan D. Human T cell microparticles circulate in blood of hepatitis patients and induce fibrolytic activation of hepatic stellate cells. Hepatology. 2011;53:230–242. doi: 10.1002/hep.23999. [DOI] [PMC free article] [PubMed] [Google Scholar]
- 59.Havens CG, Ho A, Yoshioka N, Dowdy SF. Regulation of late G1/S phase transition and APC Cdh1 by reactive oxygen species. Mol Cell Biol. 2006;26:4701–4711. doi: 10.1128/MCB.00303-06. [DOI] [PMC free article] [PubMed] [Google Scholar]
- 60.Wada S, Obika S, Shibata MA, Yamamoto T, Nakatani M, Yamaoka T, Torigoe H, Harada-Shiba M. Development of a 2′,4′-BNA/LNA-based siRNA for dyslipidemia and assessment of the effects of its chemical modifications in vivo. Mol Ther Nucleic Acids. 2012;1:e45. doi: 10.1038/mtna.2012.32. [DOI] [PMC free article] [PubMed] [Google Scholar]
- 61.Torgersen ML, Skretting G, van Deurs B, Sandvig K. Internalization of cholera toxin by different endocytic mechanisms. J Cell Sci. 2001;114:3737–3747. doi: 10.1242/jcs.114.20.3737. [DOI] [PubMed] [Google Scholar]
- 62.Guttman M, Betts GN, Barnes H, Ghassemian M, van der Geer P, Komives EA. Interactions of the NPXY microdomains of the low density lipoprotein receptor-related protein 1. Proteomics. 2009;9:5016–5028. doi: 10.1002/pmic.200900457. [DOI] [PMC free article] [PubMed] [Google Scholar]
- 63.McCormack AL, Schieltz DM, Goode B, Yang S, Barnes G, Drubin D, Yates JR., III Direct analysis and identification of proteins in mixtures by LC/MS/MS and database searching at the low-femtomole level. Anal Chem. 1997;69:767–776. doi: 10.1021/ac960799q. [DOI] [PubMed] [Google Scholar]
Associated Data
This section collects any data citations, data availability statements, or supplementary materials included in this article.
Supplementary Materials
Supplemental Figure 1. HepG2 exposed to different saturated and unsaturated free fatty acids. Representative micrographs of Oil red-O staining for lipid droplets in HepG2 exposed to 1% BSA (control) or 0.25 mM of oleic, palmitic and stearic acid for 24 h. 20× magnification was used for acquisition of the pictures.
Supplemental Figure 2. Effect of lipotoxic FFAs is counteracted by non-lipotoxic FFAs. HepG2 were exposed to 0.25 mM of palmitic acid, oleic acid and a mixture of both up to 24 hrs. MPs were isolated from the supernatant and Annexin V+ positive MPs were detected by flow cytometry and quantity is reported in the graph. Values represent mean ± S.D. * P < 0.05; ** P < 0.01; ***P < 0.001 compared to controls.
Supplemental Figure 3. Cellular localization and molecular function of proteins from hepatocyte-derived MPs. All the proteins obtained by three different proteomics analysis of MPs from HepG2 cells exposed to palmitic acid were organized based on cellular localization (top pie chart) and molecular function (bottom pie chart). Percentages over the total number of proteins were reported in the pie charts.
Supplemental Figure 4. MPs released by fat-laden rat primary hepatocytes are potent inducers of angiogenesis. (A) Representative micrographs of tube formation of HUVECs after exposure up to 6 h to rat primary hepatocytes-derived MPs, MP-free supernatant or controls. (B) HUVECs total tube length has been measured and reported in the histogram. (C) Representative micrographs of chemotaxis assay (Boyden's chamber assay) of HUVECs were tested with primary hepatocytes-derived MPs, MP-free supernatant or controls, as described in Methods. A 10× magnification was used for microscopic pictures. (D) An average of HUVECs migrated into the filter was measured and reported in the graph. VEGF (100 ng/ml) was used as a positive control. Values represent mean ± S.D. from three independent experiments. * P < 0.05; ** P < 0.01; ***P < 0.001 compared to controls.
Supplemental Figure 5. Pro-angiogenic effect of hepatocytes-derived MPs is dose-dependent. HepG2 were treated with 0.25 mM of palmitic acid up to 24 h and MPs were isolated from the supernatant by ultracentrifugation. MPs samples were quantified by BCA protein assay and the concentration has been determined. Different doses (50, 125, 250 and 500 µg/mL) have been used for assessing (A) HUVECs tube formation and (B) chemotaxis assay (Boyden's chamber assay). Quantification graphs are reported in the figure. A dose of 100 ng/mL of VEGF has been used as positive control. Values represent mean ± S.D. * P < 0.05; ** P < 0.01; ***P < 0.001 compared to controls.
Supplemental Figure 6. Endothelial cells angiogenesis in vitro depends on internalization of MPs into HUVECs. Representative micrographs of tube formation of HUVECs after exposure to HepG2-derived MPsCalcein up to 6 hours. HUVECs tubes were detected by an Olympus FV1000 Spectral Confocal with 20× lens.
Supplemental Figure 7. Genetic suppression of VNN1 expression on MPs significantly reduced the pro-angiogenic effects of MPs on endothelial cell migration and tube formation. HepG2 were exposed to palmitic acid (PA) for 24 h and then treated with VNN1 siRNA or control RNA (Ctrl RNA). Representative micrographs of (A) tube formation and (B) chemotaxis (Boyden's chamber assay) of HUVECs treated with hepatocyte-derived MPs, MP-free supernatant (MP-free sup.) or controls for 6 h and 16 h, respectively. A dose of 100 ng/mL of VEGF was used as positive control. A 4× magnification was used for acquisition of pictures.
Supplemental Figure 8. Pro-angiogenic effect of hepatocytes-derived microparticles acts through VNN1-dependent internalization. (A) Fat-laden HepG2-derived MPs were stained with 1 µM of Calcein AM-FITC (MPsCalcein), washed to removed unspecific bound and incubated with or without a neutralizing antibody anti-VNN1 (4 µg/mL) (VNN1 nAb) and anti-GAPDH for 30 minutes. MPs were then incubated with HUVECs for 6 hours and FITC-positive events were detected by FACS. (B) Number of FITC-positive HUVECs exposed to MPCalcein with or without VNN1 were reported in graph; (C) tube formation of HUVECs after exposure for 6 hours to HepG2-derived MPs with or without VNN1 or controls; (D) chemotaxis assay of HUVECs was performed with HepG2-derived MPs with or without VNN1 or controls as described in Methods. (E) Protein expression of endothelial cells markers activation, ICAM-1 and VCAM-1, after exposure up to 6 hours with hepatocytes-derived MPs or MPs pre-incubated with a VNN1 neutralizing antibody. GAPDH was used as loading control. (F) Glutathione activity assay analysis in HUVECs treated with HepG2-derived MPs with or without VNN1 or controls. Glutathione activity is reported in RFU. * P < 0.05; ** P < 0.01; ***P < 0.001, compared to controls.
Supplemental Figure 9. Proangiogenic effects of VNN1 positive MPs are not mediated by induction of endothelial cell proliferation or modulation of PPAR-γ expression. Fat-laden HepG2-derived MPs were incubated with or without a rabbit polyclonal antibody anti-VNN1 (4 µg/mL) for 30 minutes. A BrdU proliferation assay has been performed with HUVECs incubated for 16 h with MPs, MPs and VNN1 neutralizing Ab or controls. (A) Flow cytometry analysis gating (P3) proliferating-FITC-positive HUVECs. A BrdU negative staining has been included as negative control. (B) RNA was isolated from HUVECs that were incubated for 16 h with MPs, MPs and VNN1 nAb or controls in order to determine the expression of PPAR-γ by quantitative PCR. The housekeeping gene 18S was used as an internal control. Values represent mean ± S.D. * P < 0.05; ** P < 0.01; ***P < 0.001 compared to controls.
Supplemental Figure 10. Increase of VNN1 in hepatocytes during lipotoxicity is independent of PPARα and γ. (A) Quantitative PCR of PPARγ expression in HepG2 treated with 0.25 mM of palmitic acid (PA) or 1% BSA (vehicle) for 24 h. (B) Quantitative PCR for PPARα and (C) VNN1 in HepG2 treated with 1% BSA, 0.25 mM of palmitic acid (PA), oleic acid (OA) or palmitic acid/oleic acid mix for 24 h. (D) Quantitative PCR for PPARα and (E) VNN1 in HepG2 exposed to 1% BSA, 0.25 mM of palmitic acid (PA), oleic acid (OA) or palmitic acid/oleic acid mix for 24 h and treated with PPARα siRNA or control RNA (Ctrl RNA).
Supplementary Figure 11. Release of circulating microparticles depends on the stage of NASH. C57/B6 mice (n=5) were put on a MCD, high fat/high carbohydrates (HF/HCarb) or chow diet for 6 weeks. (A) Circulating MPs were isolated as described in Methods and Annexin V+ MPs were detected by flow cytometry. (B) H-E staining. (C) NAFLD activity score. Values represent mean ± S.D. * P < 0.05; ** P < 0.01; ***P < 0.001 compared to controls.
Supplementary Figure 12. Circulating MPs from mice with NASH stimulate angiogenesis ex vivo. C57/B6 mice were put on a MCD, high fat/high carbohydrates (HF/HCarb) and chow diet for 6 weeks, platelet-free plasma was harvested and MPs were isolated as described in Methods. MPs and MPs-free supernatant were used to induce HUVECs tube formation and oriented migration (Boyden's chamber assay) ex vivo. Quantification of (A) HUVECs tube formation (total tube length) and (B) chemotaxis assay (Boyden's chamber assay) is reported in the graph. A dose of 100 ng/mL of VEGF has been used as positive control. Values represent mean ± S.D. * P < 0.05; ** P < 0.01; ***P < 0.001 compared to controls.
Supplemental Figure 13. Liver specific in vivo silencing of VNN1 does not affect VNN1 expression in other tissues. Expression of VNN1 was assessed in (A) kidney, (B) intestine and (C) spleen harvested from MCD-fed mice treated with VNN1 siRNA, control RNA (CTRL RNA) or PBS (Mock) to confirm the liver-specific knockdown of VNN1. The housekeeping gene 18S was used as an internal control. Values represent mean ± S.D. * P < 0.05; ** P < 0.01; ***P < 0.001 compared to controls.
Supplemental Figure 14. Casp3-/- mice are protected from MCD-induced pathological angiogenesis and liver fibrosis. (A) Representative micrographs for H-E staining, immunostaining for CD-31, vonWillebrand factor (vWF) and Sirius red staining of liver specimens harvested from WT and Caspase-3 KO mice fed the MCD or control diet (MCS) diet for 6 weeks. A 10× magnification was used for micrographs. (B) Total area in pixel (px) is reported in the graph to show the quantification of CD31 immunostaining. (C) Percentage of fibrosis was measured by using Image J. (C) RNA was isolated from liver samples of C57BL/6 Casp3-/- and WT mice, fed a MCD or MCS diet. Analysis of the transcripts for the pro-angiogenic genes (VEGF-B and FGF-ß) and pro-fibrogenic genes (Collagen type I and α-SMA) was assessed by quantitative PCR. The housekeeping gene 18S was used as an internal control. Values represent mean ± S.D. * P < 0.05; ** P < 0.01; ***P < 0.001 compared to controls.
Supplemental Table 1. Identification of the whole hepatocytes-derived microparticles proteins based on the LC-MS/MS-derived sequences. Pure hepatocytes-derived microparticles were isolated and processed for a complete proteomics analysis as described in the ‘Methods’ paragraph. The proteins detected are listed in the table with the corresponding uniprot accession code, number of peptides, biological function and cellular localization.