

Abstract
Several genome-wide scans have been performed to detect loci that regulate BMD, but these have yielded inconsistent results, with limited replication of linkage peaks in different studies. In an effort to improve statistical power for detection of these loci, we performed a meta-analysis of genome-wide scans in which spine or hip BMD were studied. Evidence was gained to suggest that several chromosomal loci regulate BMD in a site-specific and sex-specific manner.
Introduction
BMD is a heritable trait and an important predictor of osteoporotic fracture risk. Several genome-wide scans have been performed in an attempt to detect loci that regulate BMD, but there has been limited replication of linkage peaks between studies. In an attempt to resolve these inconsistencies, we conducted a collaborative meta-analysis of genome-wide linkage scans in which femoral neck BMD (FN-BMD) or lumbar spine BMD (LS-BMD) had been studied.
Materials and Methods
Data were accumulated from nine genome-wide scans involving 11,842 subjects. Data were analyzed separately for LS-BMD and FN-BMD and by sex. For each study, genomic bins of 30 cM were defined and ranked according to the maximum LOD score they contained. While various densitometers were used in different studies, the ranking approach that we used means that the results are not confounded by the fact that different measurement devices were used. Significance for high average rank and heterogeneity was obtained through Monte Carlo testing.
Results
For LS-BMD, the quantitative trait locus (QTL) with greatest significance was on chromosome 1p13.3-q23.3 (p = 0.004), but this exhibited high heterogeneity and the effect was specific for women. Other significant LS-BMD QTLs were on chromosomes 12q24.31-qter, 3p25.3-p22.1, 11p12-q13.3, and 1q32-q42.3, including one on 18p11-q12.3 that had not been detected by individual studies. For FN-BMD, the strongest QTL was on chromosome 9q31.1-q33.3 (p = 0.002). Other significant QTLs were identified on chromosomes 17p12-q21.33, 14q13.1-q24.1, 9q21.32-q31.1, and 5q14.3-q23.2. There was no correlation in average ranks of bins between men and women and the loci that regulated BMD in men and women and at different sites were largely distinct.
Conclusions
This large-scale meta-analysis provided evidence for replication of several QTLs identified in previous studies and also identified a QTL on chromosome 18p11-q12.3, which had not been detected by individual studies. However, despite the large sample size, none of the individual loci identified reached genome-wide significance.
Keywords: osteoporosis, BMD, linkage, meta-analysis, genome search, genome scan
INTRODUCTION
Osteoporosis is A common disease characterized by reduced BMD and an increased risk of fragility fractures that account for considerable morbidity and mortality and significant health care costs in developed countries.(1) BMD is one of the most important clinical predictors of osteoporotic fracture risk,(2) and evidence from twin and family studies suggests that between 50% and 85% of the variance in BMD is genetically determined.(3–5) Polymorphisms have been identified in many candidate genes that have been associated with BMD or osteoporotic fractures.(6) Few of these have been validated with large-scale evidence, however,(7) and those that have account for only a small proportion of the genetic contribution to BMD and susceptibility to osteoporotic fractures.(8) Genetic influences are thought to contribute mainly to the acquisition of peak bone mass, occurring in young adulthood.(9) While some investigators have reported that bone loss may be genetically determined,(10) others have found no evidence for genetic effects on bone loss,(11) even though there is good evidence that bone turnover is genetically determined.(12) Many genome-wide linkage searches for quantitative trait loci (QTLs) that regulate BMD have been performed, but few of these studies have identified loci that meet the criteria for genome-wide significance, and there has been limited replication of linkage peaks between studies.(13)
The difficulty in detecting significant linkage to BMD despite its high heritability may be caused by many factors. Many of the genome-wide scans for BMD have enrolled large numbers of individuals, However, BMD, like other complex traits, is thought to be regulated by many genes, each with modest effect sizes and the interaction of these genes with multiple environmental factors. Such effects are difficult to detect even with studies of several thousand individuals.(14) Other factors that could contribute to the lack of replication include differences in the design and enrollment criteria and true genetic heterogeneity between study populations.
A meta-analysis can improve the power to detecting linkage, especially if sample size is a factor in explaining the differences between single studies. Moreover, given the debate about the apparent inconsistency of the observed results across genome-wide linkage scans, it is interesting to test the extent of heterogeneity across these studies. Here, we present the results of a collaborative meta-analysis of genome-wide linkage searches for BMD. We have applied methods that evaluate both the overall evidence for linkage to specific chromosomal regions(15) and the diversity of linkage across studies.(16,17) We also tried to explain this diversity with separate analyses for different skeletal sites and subgroup analyses for men and women, in view of emerging evidence that suggests that the loci that regulate BMD do so in a site- and sex-specific manner in both humans and experimental animals.(18–20)
MATERIALS AND METHODS
Eligible genome-wide searches
We considered genome-wide searches where lumbar spine (LS) or femoral neck (FN) BMD had been measured by DXA. We did not consider studies or subsets of studies where data were derived only for specific chromosomal regions, such as candidate locus linkage studies.
We searched PubMED (last search updated August 2005) using “osteoporosis,” “bone mineral density,” “genome search,” and “scan.” We also perused the bibliography of identified articles and relevant reviews. Identified studies were scrutinized for eligibility and potential overlap of study populations. In the event of overlap, only the largest study was used to avoid duplication of data. We communicated with the principal investigators of each study and invited them to contribute data to the meta-analysis. We assembled relevant information on study design and enrollment criteria, ethnicity, the number of families and individuals studied, the skeletal sites evaluated, details of age and sex, the number of markers studied, and details of covariates that had been included in linkage analysis for the individual studies. The meta-analysis was restricted to autosomal loci for spine BMD or hip BMD.
Genome search meta-analysis and testing for between-scan heterogeneity
Data from the individual genome scans were combined using the genome search meta-analysis (GSMA) method as previously described.(15,21,22) Using this approach, which is the standard method for conducting a meta-analysis of genome-wide scans, the genome is divided into 120 regions (bins) of ~30 cM in size using a defined set of markers.(15) By convention, the bins are identified using the chromosome number and the number of the bin in that chromosome (e.g., “bin 7.5” is the fifth bin of the seventh chromosome). We recorded the maximum multipoint LOD score observed in each bin, ranked the LOD scores according to their magnitude, and assigned the highest rank to the highest LOD value. Ties were handled by ascribing the same rank to all bins with tied scores. A Monte Carlo test was used to estimate the statistical significance prank of the summary ranks or average ranks (summary ranks divided by number of scans) for each chromosomal region across all available genome-wide searches.(15) A bin that has very high ranks in all scans will tend to have a very high average rank, whereas a bin with very low ranks in all scans will have a very low average rank. The pord statistic shows the probability of observing such an average rank by chance in bins that occupy that order.(22) This conveys information on whether a bin with kth order has a high or low average rank given its order. While various densitometers were used in the different genome-wide scans, individual studies used a single measurement device or devices that were cross-calibrated.(23) In view of this, the results are not confounded by the fact that different measurement devices were used in different studies
As previously described,(16,17) we evaluated three heterogeneity metrics (Q, Ha, and B), which estimate the diversity in the ranks of each chromosomal region across genome-wide searches. The statistical significance of these heterogeneity metrics was tested against Monte Carlo test distributions using permutations of the ranks of each scan and allowing also for ties.(17) Analyses of statistical significance for heterogeneity were performed using two different approaches.(17) First, we estimated whether the observed between-scan heterogeneity is significantly high or significantly low regardless of the observed average rank of the tested chromosomal region (unrestricted analysis). Second, we estimated whether the observed between-scan heterogeneity is significantly high or significantly low restricting the analysis to bins with similar (±2) average ranks.(17) The rationale for this second approach is that the observed heterogeneity metrics depend on each bin’s average rank. We differentiated significantly low between-scan heterogeneity, where genome-wide searches generally agree in the relative rank of a bin, from significantly high between-scan heterogeneity, where large differences exist in relative rank of a bin between studies. Inferences on the presence of either low or high between-scan heterogeneity were based on one-sided tests (p < 0.05 for left- or right-sided testing, respectively). It should be noted that heterogeneity tests may be underpowered when only few studies are available. All Monte Carlo analyses were run using both weighted and unweighted methods. The former calculations weighted each scan by the square root of individuals genotyped in each study. For average ranks, formal statistical significance was tested at the α = 0.05 level. This is a liberal level and does not take into account the possibility of multiple comparisons. Accounting for all 120 bins gives a threshold for genome wide significance of p ≤ 0.00042,(22) although it should be noted that this is a conservative threshold, because the bins are interdependent. Given that genome-wide approaches are exploratory, we present p values here without further adjustment, acknowledging the potential for higher type 1 error. Analyses used the HEGESMA software(16) with 10,000 replications. Inferences on average rank and presence of between-scan heterogeneity are one-tailed, unless otherwise specified.
Skeletal site analyses and sex subgroup analyses
Each participating team provided data on the maximum LOD scores in each bin for each of the following analyses: First, all analyses were performed separately for LS BMD and FN BMD. Analyses were performed for both sexes combined. Second, for each skeletal site, analyses were performed for men and women separately.
In studies where sex-specific analysis had not been performed as part of the original genome-wide scan, investigators provided an additional analysis according to sex for the purpose of the meta-analysis. These study-specific unpublished data are available on request.
We examined whether the identified bins with significant average rank overlapped between the two skeletal sites and between the sexes for each site. We also estimated the Spearman rank correlation coefficients for the average weighted ranks across all 120 bins in LS versus FN (all subjects), men versus women in LS, and men versus women in FN.
RESULTS
Eligible studies
Relevant details from the studies that were included in the analysis are summarized in Table 1. Of the 11 genome-wide search articles on BMD that were identified,(24–34) we excluded a study in which only forearm BMD was measured(32) and another that used a composite phenotype in which information on BMD and fracture were combined,(33) because these could not be combined quantitatively with the other studies. Eight of the nine studies included analyses of LS BMD and six included analyses of FN BMD (five included analyses of BMD at both sites). Seven studies included populations of primarily European white ancestry; one included subjects of Mexican-American ancestry(27); and one included a subset of families (n = 83 individuals) of black descent.(31) Overall 3045 families with 11,842 subjects were analyzed.
Table 1.
Characteristics of Participating Studies
| S1(24) Shen |
S2(25) Karasik |
S3(26) Devoto |
S4(27) Kammerer |
S5(28) Ralston |
S6(29) Wilson |
S7(29) Wilson |
S8(31) Peacock |
S9(34) Koller |
|
|---|---|---|---|---|---|---|---|---|---|
| Skeletal sites | |||||||||
| Lumbar spine | + | + | + | − | + | + | + | + | + |
| Femoral neck | − | + | + | + | + | − | − | + | + |
| Families | 79 | 323 | 40 | 29 | 715 | 1094 | 254 | 225 | 286 |
| Subjects | 1816 | 1557 | 254 | 664 | 3658 | 2188 | 587 | 482 | 636 |
| Location | United States | United States | Canada | United States (Mex) |
United Kingdom, Denmark Netherlands |
United Kingdom | United Kingdom, Belgium Australia, New Zealand |
United States | United States |
| Study design | |||||||||
| Proband definition | Yes | No | Yes | No | Yes | No | Yes | No | No |
| Linkage method | NPL | NPL | NPL | NPL | NPL | NPL | NPL | NPL | NPL |
| Subjects included | Families | Families | Families | Families | Families | Twins | Sibs | Sibs | Sibs |
| ZBMD threshold | < −1.28, >1.28 | — | < −2.0 | — | < −2.0 | — | < −1.5 | — | — |
| Site | LS or hip | — | LS | — | LS or hip | — | LS or hip | — | — |
| Mean age [years (SD)] | 49 (16) | 61 (13) | 47 (16) | 43 (16) | 48 (16) | 48 (16) | 59 (16) | 35 (11) | 34 (7) |
| Sex (n)* | M (768) | M (660) | M (103) | M (259) | M (1398) | — | — | M (482) | — |
| F (1048) | F (871) | F (151) | F (261) | F (2260) | F (2188) | F (587) | — | F (636) | |
| Adjustments | |||||||||
| Age† | + | + | + | + | + | − | + | + | + |
| Sex‡ | + | + | + | + | + | − | − | − | − |
| Height, weight, BMI | + | + | + | + | + | − | − | + | + |
| Other§ | − | + | + | + | − | − | − | + | − |
| DNA markers | 432 | 401 | 363 | 416 | 400 | 737 | 1008 | 402 | 270 |
Number of subjects analyzed in the sex subgroup analyses; postmenopausal women were excluded in the sex subgroup analysis of S4. S6 and S7 are described in the same publication.
Studies 2, 3, and 4 also adjusted for age2.
Studies 1 and 3 also performed an age × sex adjustment.
Other adjustments included alcohol and caffeine intake, smoking, physical activity, and estrogen use in women for study 2; ethnicity for study 3; physical activity for study 4; and race for study 8.
NPL, nonparametric linkage; BMI, body mass index; F, female; FN, femoral neck; LS, lumbar spine; M, male; Mex, Mexican American.
The methods of recruitment varied between studies. Three studies focused on analysis of families where the proband had low BMD values or a clinical diagnosis of osteoporosis.(26,28,29) In another study, families were enrolled because the proband had low BMD (54 families), but a few families were enrolled where the proband had normal BMD (3 families), and others were enrolled because the proband had high BMD (25 families).(24) In other studies, families were recruited where the probands were unselected with regard to BMD values.(25,27,29,31,34) The mean age of the study populations varied between 34 and 61 years of age, and the number of markers used in the genome scans varied between 270 and 1008. Five of the nine data sets included both male and female subjects in their original published analyses. For all these five data sets, investigators also provided separate data for sex-specific LOD scores. In all, we analyzed data on a total of 3670 men and 8002 women (LS analyses: 3411 men and 7741 women; FN analyses: 2902 men and 4179 women).
LS BMD
For LS BMD, eight chromosomal regions had a statistically significantly high average rank in the weighted analysis as summarized in Table 2 and Fig. 1. The lowest p values for average rank were seen for bin 1.6 (p = 0.004) and bin 3.2 (p = 0.006). The ordered rank statistic was not formally significant for any of the bins with high average ranks. The results were similar in unweighted analysis, with the exception of bins 18.1 and 11.4, where the p values fell outside the threshold for significance (p = 0.055 and p = 0.102), and bin 6.4, which was not significant in the weighted analysis (p = 0.069) but was significant in the unweighted analysis (p = 0.019).
Table 2.
Results of Weighted Analyses for Lumbar Spine BMD
| Average rank |
Left-sided p for low heterogeneity (restricted*) |
||||||
|---|---|---|---|---|---|---|---|
| Bin | Cytogenetic location | Observed | prank | pord | Q | Ha | B |
| 1.6 | 1p13.3-q23.3 | 93.34 | 0.004 | 0.439 | 0.782 (0.983) | 0.503 (0.894) | 0.464 (0.972) |
| 3.2 | 3p25.3-p22.1 | 92.52 | 0.006 | 0.151 | 0.580 (0.909) | 0.465 (0.851) | 0.443 (0.947) |
| 11.3 | 11p12-q13.3 | 89.02 | 0.014 | 0.218 | 0.630 (0.873) | 0.511 (0.800) | 0.363 (0.769) |
| 18.2 | 18p11-q12.3 | 88.72 | 0.014 | 0.087 | 0.006 (0.025) | 0.007 (0.026) | 0.007 (0.026) |
| 18.1 | 18pter-p11 | 85.51 | 0.028 | 0.232 | 0.140 (0.274) | 0.123 (0.234) | 0.087 (0.186) |
| 1.9 | 1q32-q42.3 | 84.88 | 0.030 | 0.157 | 0.111 (0.216) | 0.223 (0.378) | 0.115 (0.228) |
| 12.6 | 12q24.31-qter | 84.65 | 0.032 | 0.079 | 0.572 (0.743) | 0.516 (0.702) | 0.550 (0.802) |
| 11.4 | 11q13.3-q22.1 | 84.03 | 0.036 | 0.053 | 0.509 (0.673) | 0.511 (0.684) | 0.424 (0.653) |
Only bins with p value for average rank ≤0.05 in the weighted analyses are shown. Three heterogeneity statistics (Q, Ha, and B) are shown as described by Zintzaras and Ioannidis.(17) For heterogeneity, left-sided p < 0.05 signifies low heterogeneity and left-sided p ≥ 0.95 (right-sided p < 0.05) signifies high heterogeneity. The relative weights for the included studies are as follows: 0.15 for S1, 0.14 for S2, 0.06 for S3, 0.22 for S5, 0.17 for S6, 0.09 for S7, 0.08 for S8, and 0.09 for S9.
Heterogeneity metrics restricted for the average rank statistic of the pertinent bin.
pord, p value for the pord statistic; prank, p value for average rank.
FIG. 1.

Plot of ranks vs. genomic bins. Weighted mean rank scores for LOD scores corresponding to each genomic bin studied are shown for the femoral neck (top) and lumbar spine (bottom). The data shown are from the weighted analysis with both sexes combined. Chromosomal boundaries are indicated by the vertical interrupted lines. Significance levels corresponding to p = 0.05 and p = 0.01 boundaries for the mean rank scores are indicated by the horizontal lines.
Of the regions with high average rank, bin 1.6 showed evidence of significantly high heterogeneity (left-sided p ≥ 0.95, i.e., right-sided p < 0.05) across the studies after accounting for its average rank. This region had been in the top 10% of five studies and had achieved good ranks in another two, but the LOD was zero in one study.(24) Conversely, for bin 18.2, there was low heterogeneity (left-sided p = 0.01 or less for all three metrics) even when we accounted for the high average rank. Bin 18.2 was never in the top 10% in any study, but it was always in the top 50% of ranks across all studies.
FN BMD
For FN BMD, seven chromosomal regions yielded a high average rank in weighted analysis as summarized in Table 3 and Fig. 1. The results were similar in unweighted analysis, with the exception of bin 14.3, where the p value fell outside the threshold for significance (p = 0.095). The lowest p values in weighted analysis were seen for bins 9.5 (p = 0.002) and 14.2 (p = 0.003). Interestingly, bin 9.4, immediately adjacent to bin 9.5, was also identified as having a significantly high average rank (p = 0.022). The ordered rank statistic was not statistically significant for any of the regions with high average rank, except for bin 14.2.
Table 3.
Results of Weighted Analyses for Femoral Neck BMD
| Average rank |
Left-sided p for low heterogeneity (restricted*) |
||||||
|---|---|---|---|---|---|---|---|
| Bin | Cytogenetic location | Observed | prank | pord | Q | Ha | B |
| 9.5 | 9p31.1-q33.3 | 101.33 | 0.002 | 0.212 | 0.030 (0.299) | 0.041 (0.327) | 0.046 (0.411) |
| 14.2 | 14q13.1-q24.1 | 99.88 | 0.003 | 0.047 | 0.512 (0.945) | 0.525 (0.958) | 0.247 (0.912) |
| 17.2 | 17p12-q21.33 | 95.27 | 0.010 | 0.097 | 0.019 (0.093) | 0.017 (0.076) | 0.029 (0.123) |
| 14.3 | 14q23.3-q32.12 | 91.20 | 0.022 | 0.256 | 0.634 (0.836) | 0.649 (0.855) | 0.491 (0.823) |
| 9.4 | 9q21.32-q31.1 | 91.20 | 0.022 | 0.104 | 0.281 (0.519) | 0.250 (0.461) | 0.327 (0.636) |
| 5.4 | 5q14.3-q23.2 | 88.01 | 0.038 | 0.283 | 0.624 (0.766) | 0.523 (0.688) | 0.588 (0.812) |
Only bins with p value for average rank ≤0.05 in the weighted analyses are shown. Three heterogeneity statistics (Q, Ha, and B) are shown as described by Zintzaras and Ioannidis.(17) For heterogeneity, left-sided p < 0.05 signifies low heterogeneity and left-sided p ≥ 0.95 (right-sided p < 0.05) signifies high heterogeneity. The relative weights for the included studies are as follows: 0.21 for S2, 0.08 for S3, 0.14 for S4, 0.32 for S5, 0.12 for S8, and 0.13 for S9.
Heterogeneity metrics restricted for the average rank statistic of the pertinent bin.
pord, p value for the pord statistic; prank, p value for average rank.
None of the chromosomal regions with high average rank for FN BMD had evidence of significantly high heterogeneity across the combined data sets in weighted analyses, regardless of whether analyses were rank-restricted or not. Bin 14.2 had high heterogeneity when its average rank was taken into account but only with the Ha statistic. For bins 9.5 and 17.2, there was evidence for significantly low heterogeneity both in unweighted and weighted analyses with the rank-unrestricted approach; heterogeneity was not significantly low once the average rank of these bins was taken into account.
Comparison of skeletal sites
There was no overlap in the bins that yielded statistically significant results in terms of average rank between FN BMD and LS BMD, but the overall distribution of average ranks for all 120 bins showed a modest correlation between the two skeletal sites, reflected by the fact that the Spearman correlation coefficient for the weighted average ranks for LS and FN BMD was 0.32 (p < 0.001; Fig. 2).
FIG. 2.
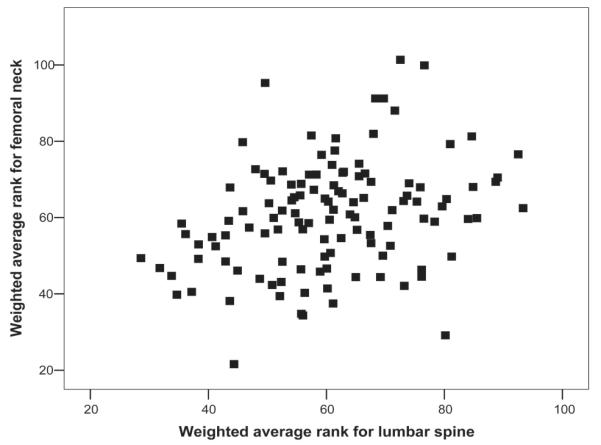
Correlation between the weighted average ranks across all 120 bins for femoral neck vs. lumbar spine. Plots of unweighted average ranks are similar (data not shown).
Gender subgroup analyses
Subgroup analyses for men and women highlighted a number of different chromosomal regions for each sex, both for LS and FN BMD (Table 4). The results for weighted and unweighted analysis were broadly similar. Heterogeneity signals were uncommon for either low or high heterogeneity. There was no overlap in the bins with high average rank across sexes, with the exception of bins 3.2 and 15.2, where high average ranks were seen for both sexes. However, even then, these signals pertained to a different skeletal site in men and women.
Table 4.
Subgroup Analysis in Men and Women
| Unweighted analyses |
Weighted analyses |
|||||
|---|---|---|---|---|---|---|
| Bin | Average rank | prank | Heterogeneity (restricted)* | Average rank | prank | Heterogeneity (restricted)* |
| Men LS | ||||||
| 7.2 | 96.60 | 0.008 | − (−) | 95.45 | 0.013 | − (−) |
| 6.5 | 95.60 | 0.010 | No (no) | 101.50 | 0.004 | No (no) |
| 15.2 | 94.40 | 0.013 | − (no) | 91.94 | 0.027 | No (no) |
| 6.4 | 94.40 | 0.013 | No (++) | 105.68 | 0.001 | No (+) |
| 5.3 | 94.10 | 0.013 | No (no) | 94.50 | 0.018 | No (no) |
| 12.6 | 92.20 | 0.019 | No (no) | 83.97 | 0.079 | No (no) |
| 6.6 | 89.20 | 0.031 | No (no) | 91.03 | 0.030 | No (no) |
| 7.3 | 88.70 | 0.034 | − (no) | 87.67 | 0.049 | − (no) |
| 9.1 | 88.40 | 0.036 | No (no) | 80.01 | 0.120 | No (no) |
| Women LS | ||||||
| 1.6 | 87.71 | 0.016 | No (no) | 90.01 | 0.018 | No (no) |
| 3.1 | 86.43 | 0.024 | No (no) | 94.38 | 0.008 | No (no) |
| 3.2 | 85.93 | 0.025 | No (no) | 94.81 | 0.007 | No (no) |
| 11.3 | 83.71 | 0.036 | No (no) | 89.18 | 0.022 | No (no) |
| 1.5 | 83.21 | 0.041 | No (no) | 78.19 | 0.115 | No (no) |
| 11.2 | 79.86 | 0.067 | No (no) | 85.23 | 0.042 | No (no) |
| Men FN | ||||||
| 12.3 | 91.40 | 0.021 | No (no) | 87.06 | 0.051 | No (no) |
| 22.1 | 90.90 | 0.023 | No (no) | 85.90 | 0.059 | No (no) |
| 9.4 | 89.90 | 0.028 | No (no) | 89.69 | 0.036 | No (no) |
| 2.8 | 88.00 | 0.037 | No (no) | 88.45 | 0.043 | No (no) |
| 3.2 | 86.80 | 0.045 | No (no) | 82.60 | 0.086 | No (no) |
| Women FN | ||||||
| 15.2 | 101.80 | 0.002 | − (no) | 97.63 | 0.009 | No (no) |
| 17.1 | 101.40 | 0.003 | − (no) | 100.59 | 0.004 | − (no) |
| 17.2 | 93.80 | 0.015 | No (no) | 87.64 | 0.050 | No (no) |
| 15.1 | 90.80 | 0.023 | No (no) | 85.36 | 0.067 | − (no) |
| 1.9 | 88.60 | 0.034 | No (no) | 84.89 | 0.076 | No (no) |
| 18.4 | 86.10 | 0.049 | No (no) | 75.73 | 0.187 | No (no) |
| 4.6 | 82.00 | 0.082 | No (no) | 88.20 | 0.047 | No (no) |
| 15.3 | 74.80 | 0.183 | +++ (+++) | 89.64 | 0.038 | No (++) |
For heterogeneity testing, significantly low heterogeneity is given by the minus sign and significantly high heterogeneity is given by the plus sign; the number of signs corresponds to how many of the three heterogeneity statistics give significant results.
FN, femoral neck; LS, lumbar spine.
Most of the bins that had been identified as having significantly high average ranks in the combined-sex analyses also gave a signal for one sex (1.6, 1.9, 3.2, 6.4, 9.4, 11.3, 12.6, and 17.2). However, the bin with the lowest p value for average rank in the overall analysis (9.5 for femoral neck) gave no significant signal in either sex subgroup. The bin that gave the lowest p value for average rank in a sex subgroup analysis (bin 6.4, p = 0.001 for men, LS in weighted analysis) also yielded a significantly high average rank in the overall analysis for the same skeletal site. However, the other three bins with p values <0.005 in the sex subgroup analysis (6.5, 15.2, and 17.1) gave no signal in the overall analysis.
There was no concordance between the weighted average ranks for men and those for women either at the LS or at the FN (data not shown).
Details of LOD scores from individual studies for the regions that gave significant results for average rank at a p value of 0.01 or less in the weighted analyses are summarized in Table 5, which shows that none of the loci identified reached the threshold for genome-wide significance within individual studies. LOD scores exceeded the threshold for suggesting linkage for some studies within bins 1.6 (3.08, study 9), 6.4 (LOD 2.25, study 8), 3.1 (LOD 3.29, study 1), and 17.1 (LOD 2.74, study 3).
Table 5.
LOD Scores From Individual Studies Identified by Genome Scan Meta-Analysis (p for Average Rank ≤0.01 by Weighted Analyses)
| LOD scores from individual studies |
|||||||||||||
|---|---|---|---|---|---|---|---|---|---|---|---|---|---|
| Bin | prank | Site | Sex | S1 | S2 | S3 | S4 | S5 | S6 | S7 | S8 | S9 | Max LOD |
| 1.6 | 0.004 | LS | Both | 0.00 | 0.74 | 1.43 | N/A | 1.41 | 0.84 | 0.21 | 1.59 | 3.08 | 3.08 |
| 3.2 | 0.006 | LS | Both | 0.62 | 0.00 | 0.15 | N/A | 1.56 | 1.18 | 0.99 | 0.88 | 1.57 | 1.57 |
| 6.5 | 0.004 | LS | Male | 0.42 | 1.51 | 0.08 | N/A | 1.54 | N/A | N/A | 1.62 | N/A | 1.62 |
| 6.4 | 0.001 | LS | Male | 0.87 | 1.75 | 0.00 | N/A | 1.34 | N/A | N/A | 2.25 | N/A | 2.25 |
| 3.1 | 0.008 | LS | Female | 3.29 | 0.32 | 0.00 | N/A | 1.70 | 0.28 | 0.19 | N/A | 1.57 | 3.29 |
| 3.2 | 0.007 | LS | Female | 0.77 | 0.01 | 0.00 | N/A | 1.77 | 1.18 | 1.00 | N/A | 1.58 | 1.77 |
| 9.5 | 0.002 | FN | Both | N/A | 1.22 | 0.77 | 1.14 | 0.21 | N/A | N/A | 1.73 | 0.44 | 1.73 |
| 17.2 | 0.010 | FN | Both | N/A | 0.58 | 0.53 | 0.36 | 0.23 | N/A | N/A | 0.90 | 1.40 | 1.40 |
| 14.2 | 0.003 | FN | Both | N/A | 0.54 | 0.00 | 1.19 | 1.67 | N/A | N/A | 1.92 | 0.42 | 1.67 |
| 15.2 | 0.009 | FN | Female | N/A | 0.87 | 1.16 | 0.32 | 0.28 | N/A | N/A | N/A | 1.70 | 1.70 |
| 17.1 | 0.004 | FN | Female | N/A | 0.68 | 2.74 | 0.30 | 0.72 | N/A | N/A | N/A | 0.45 | 2.74 |
Values shown are maximum multipoint LOD scores for individual studies for the genomic bins in which the prank: value was significant at a threshold of p = 0.01 or less.
prank, p value for average rank; LS, lumbar spine; FN, femoral neck; N/A, not applicable (sex and/or skeletal site not assessed).
DISCUSSION
This collaborative study has identified several chromosomal regions that are likely to contain genes that regulate the heritability of BMD in men and women. There was little overlap between loci that were identified as potentially containing regulators of FN BMD and LS BMD in the meta-analysis. This is in agreement with the results of individual genome-wide scans, which generally have shown little overlap between QTLs for regulation of BMD at the spine and hip.(13) However, there was correlation in the ranks of different bins between the two skeletal sites when all bins were considered. This is consistent with a framework whereby the genes that regulate BMD do so partly in a site-specific manner, although some genes may also exist with effects on both skeletal sites. The relative proportion of site-specific and -nonspecific effects requires further study. In subgroup analyses, the bins with the most significant results were also different in men and women. This suggests that sex-specific effects play prominent roles in regulating BMD in humans,(20) as they do in animals.(18,19) The mechanisms by which certain genes exert differential effects on BMD in different sexes and at different skeletal sites is currently unclear, but environmental interactions might provide a possible explanation. For example, recent studies have shown that rare mutations of the LRP5 gene affect bone mass similarly in both sexes, but that common polymorphisms are particularly associated with BMD in men.(35,36) The LRP5 pathway has also been suggested as a mediator of the effects of mechanical loading in the skeleton.(37) Because men typically are more physically active than women, this could provide a potential reason for the greater effect of LRP5 alleles in men. Interactions with mechanical loading or other environmental factors could potentially account for the sex- and site-specific effects observed in this study, but additional research will be required to clarify this issue.
Low power and high false discovery rates are potential problems for genome-wide linkage scans for common diseases,(38) and genuine phenotype heterogeneity adds further difficulty to the detection of loci for these conditions. For most common diseases, replication of linkage peaks has been extremely poor across different studies.(39) Meta-analysis can potentially improve power by increasing sample size and allowing detection of QTLs of modest effect size that are below the threshold for significance in individual genome scans. Another benefit of meta-analysis is that the large sample size allows for subgroup analyses that might theoretically help to dissect out the causes of genetic heterogeneity. To our knowledge, this is the largest meta-analysis of genome-wide searches for any disease where data have been available directly from the investigators of each scan. It is also the first such application where subgroup analyses have been possible with such large-scale evidence. Another meta-analysis of published data from genome-wide scans for BMD has recently been published.(40) This identified some of the regions reported in this study, but other loci were detected that did not feature in this study. These differences are likely to be because of the fact that we had access to all the linkage data for each region, whereas in the previous study, the investigators could only report on linkage peaks that were reported in the original papers. Because reporting of linkage peaks varies markedly between studies, this study gives a more accurate synthesis of data across studies and also provides information on sex-specific effects that have not been previously reported.
Despite the fact that we analyzed data on >11,000 participants, the signals that we obtained did not reach genome-wide statistical significance, although many more loci were identified that would have been expected by chance. Therefore, it is clear that many of the regions identified contain genes that regulate BMD, although inferences in the significance of individual peaks should be made with caution. Several of the site- and sex-specific findings in particular may still be caused by type 1 and 2 errors, but false discovery rates are likely to be reduced compared with single studies. The results presented here emphasize the challenge faced by investigators who seek to identify chromosomal regions and genes that regulate susceptibility to complex traits such as osteoporosis, even when large numbers of subjects are studied. The potential reasons for lack of consistency between major linkage peaks in different studies are many but could be caused in part by the fact many of the scans included subjects over a wide age range, whereas others were restricted to younger individuals who had attained peak bone mass. Further meta-analysis of individual level data represents a possible way to resolve these issues,(41) although this was beyond the scope of this study.
There is extensive evidence to suggest that peak bone mass is strongly heritable,(42) whereas the evidence for a genetic effect on age-related bone loss is controversial.(10,11) The inclusion of older subjects could have impaired our ability to detect loci that regulate peak BMD, even though age was included as a covariate in most of the studies presented here. Several investigators who took part in this study have previously reported that stratification of subjects on the basis of age identifies linkage peaks that are mostly distinct from those obtained by variance component modeling with inclusion of age in the linkage model.(27,28,43)
Notwithstanding these caveats, some identified chromosomal areas should be discussed for further illustration. Among several regions implicated in LS BMD regulation, bin 1.6 showed the highest average rank. However, the results were heterogeneous across studies. This bin also gave a significant signal in women but not men. This is an example where our approach identified heterogeneity and also offers a potential explanation in that the genes contained within bin 1.6 may exert sex-specific effects.
Chromosome 3 also yielded interesting signals. Bin 3.2 was on the list of significant average ranks overall and for the female subgroup in the LS analyses. Moreover, the neighboring bin 3.3 (61–90 cM) gave the highest LOD scores in the two separate scans on women,(29) and thus, 3.1 gave a significant signal in the female subgroup meta-analysis. A microsatellite marker close to the parathyroid receptor 1 (PTHR1) gene within this genomic region was also linked to LS BMD by researchers who studied a subgroup of participants from the FAMOS study.(44) Moreover, other investigators recently reported evidence of an association between a polymorphism in the promoter of PTHR1 gene and FN BMD in young women.(45) In view of this, the 50- to 70-cM region in chromosome 3 requires more thorough investigation.
Bin 18.2 had not been originally pinpointed by any of the previous single studies, but the rank for LS BMD was consistently high in all studies. Between-study heterogeneity was significantly low. A neighboring region (bin 18.1) also had a significantly high average rank. Interestingly, the same chromosome 18 region was also found to have a high linkage signal (maximum at 11 cM) in another genome-wide linkage search,(33) where the evaluated phenotype was a combination of LS BMD and vertebral fractures. In that same study,(33) there was no linkage with FN BMD, and this was also true in our meta-analysis.
For FN BMD, the highest average rank was found for bin 9.5, and the adjacent 9.4 also showed significant results for the average rank. Therefore, it may be useful to focus further work in the vicinity of 110–130 cM on chromosome 9. The region ranked high in almost all scans, and in the Framingham study, where a subgroup analysis was performed by sex and age group,(43) the highest LOD was observed in the middle of the two bins at 120 cM (marker D9S930).
The linkage of bin 17.2 with FN BMD was identified only through the meta-analysis: its ranks were consistently high across previous studies but not so high to be identified in any single study. It was also formally significant in the female subgroup analysis. In another genome-wide linkage study but with a combined BMD/fracture phenotype,(33) the same region also had a LOD peak of 2.02. Interestingly, this region contains the COLIA1 Sp1 polymorphism, which has been found to be associated with BMD in the GENOMOS study, involving >20,000 subjects from various European countries.(8) It should be acknowledged that there was some overlap with this study in the sense that one subject from each family in the FAMOS cohort (n = 715) was analyzed as part of GENOMOS. However, because the results from FAMOS were based on linkage compared with the association approach used in GENOMOS, the actual overlap is minimal. It remains to be determined, however, whether this single nucleotide polymorphism (SNP) contributes to the linkage signal in this chromosomal region. Another gene that had proposed in early years as a major regulator of bone mass, the vitamin D receptor (VDR), is located at locus 12q12-q14, where we found no linkage signal. In concordance with this finding, the large-scale association analysis of GENOMOS recently found no effect of VDR on BMD.(46)
An important strength of this collaborative meta-analysis was that the original data were contributed by the participating teams, which allowed for consistent data synthesis. This may explain why we generally saw little evidence of high residual between-study heterogeneity after accounting for skeletal site and sex. Despite this, the participating teams used different recruitment criteria, study designs, and proband definitions, and because of this, we may have missed some sources of heterogeneity. For example, there is evidence that genetic effects on BMD can differ across age groups and that these differences are not adequately captured by simply entering age into the linkage model.(27,28,43) We did not perform separate analyses according to age group or separate pre- and postmenopausal women because this information was not available for all the participating studies. Ethnic differences are also a potential issue, but this is likely to be less important in this study where >98% of the analyzed individuals were of white descent.
Acknowledging these caveats, the collaborative meta-analysis reported here provided replication for several QTLs identified in previous genome-wide scans and identified a novel QTL that had not been picked up by individual studies. Overall, these data suggest that the significant QTLs identified contain genes that regulate BMD, and in agreement with previous reports, our analysis supports the hypothesis that these genes regulate BMD in a site- and sex-specific manner. Identifying these genes remains challenging, but is likely to be facilitated by technical advances in haplotype analysis(47) and the availability of increasingly dense maps of SNPs that may be targeted at areas suggested by the meta-analysis.
ACKNOWLEDGMENTS
The San Antonio family Osteoporosis Study is funded by Grants R01 AR43351 and P01 HL45522 from the National Institutes of Health. Work performed at Indiana University was supported by NIH Grants P01 AG-18397 and M01 RR-00750. The FAMOS study was funded by Oxagen and also receives funding from the European Commission under Grant QLK6-CT-2002-02629 (the GENOMOS project). The authors thank the FAMOS investigators (Juliet Compston, University of Cambridge, UK; Cyrus Cooper, University of Southampton, UK; Emma Duncan, Nuffield Orthopaedic Centre, Oxford, UK; Richard Keen, University College London, UK; Alastair McLellan, University of Glasgow, UK; David M Reid, University of Aberdeen, UK; and John Wass, Nuffield Orthopaedic Centre, Oxford, UK, for allowing us to use data for this analysis. The St Thomas’ Twins UK study receives funding from the Wellcome Trust, ARC, and Chronic Disease Research Foundation. The authors also acknowledge RL Prince, N Gilchrist, JY Reginster, I Fogelman, and I Smith, who contributed patients to the GENOS study, which received funding from the Australian National Health and Medical Research Council (Project Grants 294402 and 343603). The Framingham Heart Study is supported by the National Heart, Lung and Blood Institute’s Framingham Heart Study (Contract N01-HC-25195) and the Framingham Osteoporosis Study is funded by Grants R01-AR050066 and R01-AR/AG 41398 from the National Institutes of Health. Investigators at Creighton were supported by NIH Grants K01 AR02170-01, R01 AR 45349-01, and R01 GM60402-01 A1, as well as by the U.S. DOE, Health Future Foundation, and the State of Nevada. The Creighton study has also benefited from grants from the National Science Foundation of China. Mandy Ng was funded by The Bone Health Fund of the Hong Kong University Foundation, Matching Grant, and CRCG Grant, HKU. Stuart Ralston receives support from a grant from the Arthritis Research Campaign (B387).
Footnotes
The authors state that they have no conflicts of interest.
REFERENCES
- 1.Cummings SR, Melton LJ. Epidemiology and outcomes of osteoporotic fractures. Lancet. 2002;359:1761–1767. doi: 10.1016/S0140-6736(02)08657-9. [DOI] [PubMed] [Google Scholar]
- 2.Kanis JA. Diagnosis of osteoporosis and assessment of fracture risk. Lancet. 2002;359:1929–1936. doi: 10.1016/S0140-6736(02)08761-5. [DOI] [PubMed] [Google Scholar]
- 3.Smith DM, Nance WE, Kang KW, Christian JC, Johnston CC. Genetic factors in determining bone mass. J Clin Invest. 1973;52:2800–2808. doi: 10.1172/JCI107476. [DOI] [PMC free article] [PubMed] [Google Scholar]
- 4.Krall EA, Dawson-Hughes B. Heritable and life-style determinants of bone mineral density. J Bone Miner Res. 1993;8:1–9. doi: 10.1002/jbmr.5650080102. [DOI] [PubMed] [Google Scholar]
- 5.Pocock NA, Eisman JA, Hopper JL, Yeates MG, Sambrook PN, Eberl S. Genetic determinants of bone mass in adults: A twin study. J Clin Invest. 1987;80:706–710. doi: 10.1172/JCI113125. [DOI] [PMC free article] [PubMed] [Google Scholar]
- 6.Liu YZ, Liu YJ, Recker RR, Deng HW. Molecular studies of identification of genes for osteoporosis: The 2002 update. J Endocrinol. 2003;177:147–196. doi: 10.1677/joe.0.1770147. [DOI] [PubMed] [Google Scholar]
- 7.Ioannidis JP. Genetic associations: False or true? Trends Mol Med. 2003;9:135–138. doi: 10.1016/s1471-4914(03)00030-3. [DOI] [PubMed] [Google Scholar]
- 8.Ralston SH, Uitterlinden AG, Brandi ML, Balcells S, Lang-dahl BL, Lips P, Lorenc R, Obermayer-Pietsch B, Scollen S, Bustamante M, Husted LB, Carey AH, ez-Perez A, Dunning AM, Falchetti A, Karczmarewicz E, Kruk M, Leeuwen JP, Meurs JB, Mangion J, McGuigan FE, Mellibovsky L, Monte FD, Pols HA, Reeve J, Reid DM, Renner W, Rivadeneira F, Schoor NM, Sherlock RE, Ioannidis JP. Large-scale evidence for the effect of the COLIA1 Sp1 polymorphism on osteoporosis outcomes: The GENOMOS Study. PLoS Med. 2006;3:e90. doi: 10.1371/journal.pmed.0030090. [DOI] [PMC free article] [PubMed] [Google Scholar]
- 9.Pollitzer WS, Anderson JJ. Ethnic and genetic differences in bone mass: A review with a hereditary vs environmental perspective. Am J Clin Nutr. 1989;50:1244–1259. doi: 10.1093/ajcn/50.6.1244. [DOI] [PubMed] [Google Scholar]
- 10.Kelly PJ, Nguyen T, Hopper J, Pocock N, Sambrook P, Eisman J. Changes in axial bone density with age: A twin study. J Bone Miner Res. 1993;8:11–17. doi: 10.1002/jbmr.5650080103. [DOI] [PubMed] [Google Scholar]
- 11.Christian JC, Yu PL, Slemenda CW, Johnston CC. Heritability of bone mass: A longitudinal study in aging male twins. Am J Hum Genet. 1989;44:429–433. [PMC free article] [PubMed] [Google Scholar]
- 12.Hunter D, de Lange M, Snieder H, MacGregor AJ, Swami-nathan R, Thakker RV, Spector TD. Genetic contribution to bone metabolism, calcium excretion, and vitamin D and parathyroid hormone regulation. J Bone Miner Res. 2001;16:371–378. doi: 10.1359/jbmr.2001.16.2.371. [DOI] [PubMed] [Google Scholar]
- 13.Ralston SH. Genetic determinants of osteoporosis. Curr Opin Rheumatol. 2005;17:475–479. doi: 10.1097/01.bor.0000166385.62851.92. [DOI] [PubMed] [Google Scholar]
- 14.Gueguen R, Jouanny P, Guillemin F, Kuntz C, Pourel J, Siest G. Segregation analysis and variance components analysis of bone mineral density in healthy families. J Bone Miner Res. 1995;12:2017–2022. doi: 10.1002/jbmr.5650101223. [DOI] [PubMed] [Google Scholar]
- 15.Wise LH, Lanchbury JS, Lewis CM. Meta-analysis of genome searches. Ann Hum Genet. 1999;63:263–272. doi: 10.1046/j.1469-1809.1999.6330263.x. [DOI] [PubMed] [Google Scholar]
- 16.Zintzaras E, Ioannidis JP. HEGESMA: Genome search meta-analysis and heterogeneity testing. Bioinformatics. 2005;21:3672–3673. doi: 10.1093/bioinformatics/bti536. [DOI] [PubMed] [Google Scholar]
- 17.Zintzaras E, Ioannidis JP. Heterogeneity testing in meta-analysis of genome searches. Genet Epidemiol. 2005;28:123–137. doi: 10.1002/gepi.20048. [DOI] [PubMed] [Google Scholar]
- 18.Koller DL, Alam I, Sun Q, Liu L, Fishburn T, Carr LG, Econs MJ, Foroud T, Turner CH. Genome screen for bone mineral density phenotypes in Fisher 344 and Lewis rat strains. Mamm Genome. 2005;16:578–586. doi: 10.1007/s00335-004-2459-0. [DOI] [PubMed] [Google Scholar]
- 19.Orwoll ES, Belknap JK, Klein RF. Gender specificity in the genetic determinants of peak bone mass. J Bone Miner Res. 2001;16:1962–1971. doi: 10.1359/jbmr.2001.16.11.1962. [DOI] [PubMed] [Google Scholar]
- 20.Duncan EL, Cardon LR, Sinsheimer JS, Wass JA, Brown MA. Site and gender specificity of inheritance of bone mineral density. J Bone Miner Res. 2003;18:1531–1538. doi: 10.1359/jbmr.2003.18.8.1531. [DOI] [PubMed] [Google Scholar]
- 21.Pardi F, Levinson DF, Lewis CM. GSMA: Software implementation of the genome search meta-analysis method. Bioinformatics. 2005;21:4430–4431. doi: 10.1093/bioinformatics/bti725. [DOI] [PubMed] [Google Scholar]
- 22.Levinson DF, Levinson MD, Segurado R, Lewis CM. Genome scan meta-analysis of schizophrenia and bipolar disorder, part I: Methods and power analysis. Am J Hum Genet. 2003;73:17–33. doi: 10.1086/376548. [DOI] [PMC free article] [PubMed] [Google Scholar]
- 23.Reid DM, Mackay I, Wilkinson S, Miller C, Schuette DG, Compston J, Cooper C, Duncan E, Galwey N, Keen R, Lang-dahl B, McLellan A, Pols H, Uitterlinden A, O’Riordan J, Wass JA, Ralston SH, Bennett ST. Cross-calibration of dual-energy X-ray densitometers for a large, multi-center genetic study of osteoporosis. Osteoporos Int. 2006;17:125–132. doi: 10.1007/s00198-005-1936-y. [DOI] [PubMed] [Google Scholar]
- 24.Shen H, Zhang YY, Long JR, Xu FH, Liu YZ, Xiao P, Zhao LJ, Xiong DH, Liu YJ, Dvornyk V, Rocha-Sanchez S, Liu PY, Li JL, Conway T, Davies KM, Recker RR, Deng HW. A genome-wide linkage scan for bone mineral density in an extended sample: Evidence for linkage on 11q23 and Xq27. J Med Genet. 2004;41:743–751. doi: 10.1136/jmg.2004.020396. [DOI] [PMC free article] [PubMed] [Google Scholar]
- 25.Karasik D, Myers RH, Cupples LA, Hannan MT, Gagnon DR, Herbert A, Kiel DP. Genome screen for quantitative trait loci contributing to normal variation in bone mineral density: The Framingham Study. J Bone Miner Res. 2002;17:1718–1727. doi: 10.1359/jbmr.2002.17.9.1718. [DOI] [PubMed] [Google Scholar]
- 26.Devoto M, Spotila LD, Stabley DL, Wharton GN, Rydbeck H, Korkko J, Kosich R, Prockop D, Tenenhouse A, Sol-Church K. Univariate and bivariate variance component linkage analysis of a whole-genome scan for loci contributing to bone mineral density. Eur J Hum Genet. 2005;13:781–788. doi: 10.1038/sj.ejhg.5201411. [DOI] [PubMed] [Google Scholar]
- 27.Kammerer CM, Schneider JL, Cole SA, Hixson JE, Samollow PB, O’Connell JR, Perez R, Dyer TD, Almasy L, Blangero J, Bauer RL, Mitchell BD. Quantitative trait loci on chromosomes 2p, 4p, and 13q influence bone mineral density of the forearm and hip in Mexican Americans. J Bone Miner Res. 2003;18:2245–2252. doi: 10.1359/jbmr.2003.18.12.2245. [DOI] [PubMed] [Google Scholar]
- 28.Ralston SH, Galwey N, Mackay I, Albagha OM, Cardon L, Compston JE, Cooper C, Duncan E, Keen R, Langdahl B, McLellan A, O’Riordan J, Pols HA, Reid DM, Uitterlinden AG, Wass J, Bennett ST. Loci for regulation of bone mineral density in men and women identified by genome wide linkage scan: The FAMOS study. Hum Mol Genet. 2005;14:943–951. doi: 10.1093/hmg/ddi088. [DOI] [PubMed] [Google Scholar]
- 29.Wilson SG, Reed PW, Bansal A, Chiano M, Lindersson M, Langdown M, Prince RL, Thompson D, Thompson E, Bailey M, Kleyn PW, Sambrook P, Shi MM, Spector TD. Comparison of genome screens for two independent cohorts provides replication of suggestive linkage of bone mineral density to 3p21 and 1p36. Am J Hum Genet. 2003;72:144–155. doi: 10.1086/345819. [DOI] [PMC free article] [PubMed] [Google Scholar]
- 30.Koller DL, Liu G, Econs MJ, Hui SL, Morin PA, Joslyn G, Rodriguez LA, Conneally PM, Christian JC, Johnston CC, Jr, Foroud T, Peacock M. Genome screen for quantitative trait loci underlying normal variation in femoral structure. J Bone Miner Res. 2001;16:985–991. doi: 10.1359/jbmr.2001.16.6.985. [DOI] [PubMed] [Google Scholar]
- 31.Peacock M, Koller DL, Fishburn T, Krishnan S, Lai D, Hui S, Johnston CC, Foroud T, Econs MJ. Sex-specific and nonsex-specific quantitative trait loci contribute to normal variation in bone mineral density in men. J Clin Endocrinol Metab. 2005;90:3060–3066. doi: 10.1210/jc.2004-2143. [DOI] [PubMed] [Google Scholar]
- 32.Nui T, Chen C, Cordell H, Yang J, Wang B, Wang Z, Fang Z, Schork NJ, Rosen CJ, Xu X. A genome-wide scan for loci linked to forearm bone mineral density. Hum Genet. 1999;104:226–233. doi: 10.1007/s004390050940. [DOI] [PubMed] [Google Scholar]
- 33.Styrkarsdottir U, Cazier J-B, Kong A, Rolfsson O, Larsen H, Bjarnadottir E, Johannsdottir VD, Sigurdardottir MS, Bagger Y, Christiansen C, Reynisdottir I, Grant SFA, Jonasson K, Frigge ML, Gulcher JR, Sigurdsson G, Stefansson K. Linkage of osteoporosis to chromosome 20p12 and association to BMP2. PLoS Biol. 2003;1:E69. doi: 10.1371/journal.pbio.0000069. [DOI] [PMC free article] [PubMed] [Google Scholar]
- 34.Koller DL, Econs MJ, Morin PA, Christian JC, Hui SL, Parry P, Curran ME, Rodriguez LA, Conneally PM, Joslyn G, Peacock M, Johnston CC, Foroud T. Genome screen for QTLs contributing to normal variation in bone mineral density and osteoporosis. J Clin Endocrinol Metab. 2000;85:3116–3120. doi: 10.1210/jcem.85.9.6778. [DOI] [PubMed] [Google Scholar]
- 35.Ferrari SL, Deutsch S, Choudhury U, Chevalley T, Bonjour JP, Dermitzakis ET, Rizzoli R, Antonarakis SE. Polymorphisms in the low-density lipoprotein receptor-related protein 5 (LRP5) gene are associated with variation in vertebral bone mass, vertebral bone size, and stature in whites. Am J Hum Genet. 2004;74:866–875. doi: 10.1086/420771. [DOI] [PMC free article] [PubMed] [Google Scholar]
- 36.van Meurs JB, Rivadeneira F, Jhamai M, Hugens W, Hofman A, van Leeuwen JP, Pols HA, Uitterlinden AG. Common genetic variation of the low-density lipoprotein receptor-related protein 5 and 6 genes determines fracture risk in elderly white men. J Bone Miner Res. 2006;21:141–150. doi: 10.1359/JBMR.050904. [DOI] [PubMed] [Google Scholar]
- 37.Johnson ML, Harnish K, Nusse R, Van HW. LRP5 and Wnt signaling: A union made for bone. J Bone Miner Res. 2004;19:1749–1757. doi: 10.1359/JBMR.040816. [DOI] [PubMed] [Google Scholar]
- 38.Altmuller J, Palmer LJ, Fischer G, Scherb H, Wjst M. Genomewide scans of complex human diseases: True linkage is hard to find. Am J Hum Genet. 2001;69:936–950. doi: 10.1086/324069. [DOI] [PMC free article] [PubMed] [Google Scholar]
- 39.Roberts SB, MacLean CJ, Neale MC, Eaves LJ, Kendler KS. Replication of linkage studies of complex traits: An examination of variation in location estimates. Am J Hum Genet. 1999;65:876–884. doi: 10.1086/302528. [DOI] [PMC free article] [PubMed] [Google Scholar]
- 40.Lee YH, Rho YH, Choi SJ, Ji JD, Song GG. Meta-analysis of genome-wide linkage studies for bone mineral density. J Hum Genet. 2006;51:480–486. doi: 10.1007/s10038-006-0390-9. [DOI] [PubMed] [Google Scholar]
- 41.McQueen MB, Devlin B, Faraone SV, Nimgaonkar VL, Sklar P, Smoller JW, Abou JR, Albus M, Bacanu SA, Baron M, Barrett TB, Berrettini W, Blacker D, Byerley W, Cichon S, Coryell W, Craddock N, Daly MJ, DePaulo JR, Edenberg HJ, Foroud T, Gill M, Gilliam TC, Hamshere M, Jones I, Jones L, Juo SH, Kelsoe JR, Lambert D, Lange C, Lerer B, Liu J, Maier W, Mackinnon JD, McInnis MG, McMahon FJ, Murphy DL, Nothen MM, Nurnberger JI, Pato CN, Pato MT, Potash JB, Propping P, Pulver AE, Rice JP, Rietschel M, Scheftner W, Schumacher J, Segurado R, Van SK, Xie W, Zandi PP, Laird NM. Combined analysis from eleven linkage studies of bipolar disorder provides strong evidence of susceptibility loci on chromosomes 6q and 8q. Am J Hum Genet. 2005;77:582–595. doi: 10.1086/491603. [DOI] [PMC free article] [PubMed] [Google Scholar]
- 42.Albagha OM, Ralston SH. Genetic determinants of susceptibility to osteoporosis. Endocrinol Metab Clin North Am. 2003;32:65–81. doi: 10.1016/s0889-8529(02)00059-2. [DOI] [PubMed] [Google Scholar]
- 43.Karasik D, Cupples LA, Hannan MT, Kiel DP. Age, gender, and body mass effects on quantitative trait loci for bone mineral density: The Framingham Study. Bone. 2003;33:308–316. doi: 10.1016/s8756-3282(03)00173-x. [DOI] [PubMed] [Google Scholar]
- 44.Duncan EL, Brown MA, Sinsheimer J, Bell J, Carr AJ, Wordsworth BP, Wass JA. Suggestive linkage of the parathyroid receptor type 1 to osteoporosis. J Bone Miner Res. 2000;14:1993–1999. doi: 10.1359/jbmr.1999.14.12.1993. [DOI] [PubMed] [Google Scholar]
- 45.Scillitani A, Jang C, Wong BY, Hendy GN, Cole DE. A functional polymorphism in the PTHR1 promoter region is associated with adult height and BMD measured at the femoral neck in a large cohort of young caucasian women. Hum Genet. 2006;119:416–421. doi: 10.1007/s00439-006-0155-8. [DOI] [PubMed] [Google Scholar]
- 46.Uitterlinden AG, Ralston SH, Brandi ML, Carey AH, Grin-berg D, Langdahl BL, Lips P, Lorenc R, Obermayer-Pietsch B, Reid DM, Amidei A, Bassiti A, Bustamante M, Husted LB, Diez-Perez A, Dobnig H, Dunning AM, Enjuanes A, Fahrleitner-Pammer A, Fang Y, Karczmarewicz E, Kruk M, van Leeuwen JPTM, Mavilia C, Meurs JB, Mangion J, McGuigan FE, Pols HA, Renner W, Reeve J, Rivadeneira F, van Schoor NM, Scollen S, Sherlock RE, Ioannidis JP. The association between common vitamin D receptor gene variations and osteoporosis: A participant level meta-analysis. Ann Intern Med. 2006;145:255–264. doi: 10.7326/0003-4819-145-4-200608150-00005. [DOI] [PubMed] [Google Scholar]
- 47.Cardon LR, Abecasis GR. Using haplotype blocks to map human complex trait loci. Trends Genet. 2003;19:135–140. doi: 10.1016/S0168-9525(03)00022-2. [DOI] [PubMed] [Google Scholar]