

Abstract
Summary
The goal in this study was to examine the hormonal and dietary predictors of true fractional Ca absorption (TFCA) in adult women and to determine whether TFCA differs due to body weight. Results showed that TFCA is higher in obese individuals and dietary fat, estradiol, and 1,25-dihydroxy vitamin D are the most significant positive predictors of TFCA in adult women.
Introduction
Calcium absorption is an important determinant of calcium balance and is influenced by several factors. Previous studies have identified that age, intake of protein, fat and fiber, and hormones such as 1, 25-dihyroxyvitamin D (1,25(OH)2D3) influence absorption. The determinants of TFCA using the double isotope method, the gold standard estimate of absorption, have not been examined previously in adult women nor has the role of obesity been addressed.
Methods
In this study, we examined the hormonal and dietary predictors of TFCA in adult women with a wide range of age, body weights, and nutrient intake. TFCA was measured using dual stable isotope (42Ca and 43Ca) technique. Serum was analyzed for bone-regulating hormones, and dietary information was obtained through food records. The independent dietary factors and hormonal predictors (25-hydroxyvitamin D, 1,25(OH)2D3, parathyroid hormone, and estradiol) of TFCA were analyzed using multiple regression analysis.
Results
Two hundred twenty-nine women aged 54±11 years old (24–75 years) and with BMI of 31±7.0 kg/m2 were eligible and were categorized into tertiles of body mass index (BMI) into leaner, overweight, and obese. In the entire group of women, total fat intake, estradiol, and 1,25 (OH)2D3 are significant positive predictors (p<0.05). As expected, age is a significant negative predictor of TFCA (R2=26%). TFCA is higher in obese women compared to non-obese women (p<0.05).
Conclusion
Together, these data show that dietary fat is the most significant positive predictor of TFCA which may have implications for dietary intake for non-obese individuals who are more likely to have lower and potentially compromised Ca absorption.
Keywords: Dietary fat, Estradiol, Obesity, Premenopausal/postmenopausal women, True fractional Ca absorption, Vitamin D
Introduction
Calcium absorption is an important determinant of calcium balance. Previous studies have shown that older women with lower fractional calcium absorption are at an increased risk for hip fracture [1]. Indeed, calcium absorption is lower in osteoporotic populations compared to age-matched controls [2]. Other factors that influence absorption include a declining renal function due to aging and/or certain medications (i.e., glucocorticoids) [3]. Understanding other factors that affect Ca absorption is important, since interventions that improve absorption may be one way to attenuate bone loss and fracture risk [1, 4–6]. True fractional calcium absorption (TFCA) that estimates intestinal calcium absorption using dual stable isotopes is an accurate and precise technique to measure absorption [7].
The primary hormonal regulators of calcium absorption are estrogen, parathyroid hormone (PTH), and 1,25-dihydroxyvitamin D3 (1,25(OH)2D3) [3, 8–11]. Recently, it has been shown that prolactin also plays an important role [12]. In healthy individuals, serum PTH regulates Ca absorption and renal reabsorption to maintain serum calcium levels. Serum 1,25(OH)2D3 is consistently shown to have a direct positive effect on Ca absorption, whereas the role of serum 25-hydroxyvitamin D (25OHD) is considered indirect [13], and it does not show a consistent relationship with Ca absorption [6, 14, 15] except when levels are as very low as <15 ng/mL [16]. Several dietary factors have also been shown to influence calcium absorption, such as dietary calcium, protein, fat, fiber, and supplemental vitamin D. A higher intake of dietary protein increases transcellular calcium uptake and thus increases gut absorption [17, 18]. In addition, supplemental vitamin D increases Ca absorption in some but not all studies [19–21]. Dietary fat has also been shown to be a positive predictor, while dietary calcium and fiber are negatively associated with calcium absorption in premenopausal and perimenopausal women [1, 6].
Obesity is associated with an altered endocrine profile and includes hormones that regulate TFCA. These include lower serum levels of 25OHD and 1,25(OH)2D3 [22–24] and higher PTH [25–27], estradiol, and other sex steroids [28, 29]. Higher levels of estradiol may contribute to the rate of Ca absorption, especially in older postmenopausal women [30], yet its effect has not been examined specifically in relationship to body weight. Since food intake is altered in obesity, it is expected that this too will influence Ca absorption. The goal in this study was to examine how bone-regulating hormones (PTH, estradiol, 25OHD, 1,25 (OH)2D3) and nutrients influence Ca absorption in women with a wide range of ages and body weights, and whether this interaction is modulated by obesity.
Subjects and methods
Subjects
Women who participated in previous clinical trials in the laboratory from 2001–2011 were analyzed retrospectively in this dataset. Women were excluded if they were osteoporotic (T-score<−2.5 at hip and spine), taking osteoporosis medications known to influence bone or mineral metabolism including use of hormone replacement therapy, had evidence of metabolic bone disease, thyroid disorders, immune disease, heart attack or stroke in the past 6 months, kidney stones, diabetes, active cancers, or cancer therapy within the past 12 months. Premenopausal women who were menstruating regularly were excluded if they were taking oral contraceptives or if they were pregnant or lactating within the past year. At least 2 years was required for postmenopausal women since their last menstruation.
Women were provided with calcium supplementation to meet their recommended intakes of 1–1.2 g/day of calcium for at least 4 weeks before measurements were performed (stabilization period). During the stabilization, nutrient intake was estimated with a 3-day food intake questionnaire (Food Works, version 10.1, Longvalley, NJ). At the beginning of the study, a calcium questionnaire was used to determine the intake of calcium from foods and other supplements. If intake was below 1,200 mg/day from diet and supplements, then participants were given additional calcium supplement to total to 1.0–1.2 g/day. Similarly if intake from diet and supplements was greater than 1.2 g/day, they were advised to reduce the intake. All participants were also given a daily multivitamin/mineral with 400 IU of vitamin D beginning at 4 weeks prior to baseline blood draw and TFCA measurements. This was done to reduce the variability in the intake of these nutrients known to affect TFCA. This study was approved by the Institutional Review Board at Rutgers University, and all participants signed an informed consent form before initiation of any study procedures.
Methods
Weight and height were measured with a balance beam scale and stadiometer, respectively, (Detecto, Webb City, MO). Nutrient intake was estimated using 3-day food records and analyzed using nutrient software. Bone mineral density and content, and fat and lean mass were measured using dual-energy x-ray absorptiometry [Lunar Prodigy Advanced; GE-Lunar, Madison, WI; coefficient of variation (CV) <1% for all sites using enCORE 2004 software (version 8.10.027; GE Lunar)].
True fractional calcium absorption
Dual stable isotope method was used to determine TFCA. After an overnight fast and morning void, blood was collected and subjects were served a standard breakfast (170 mg Ca). Subjects received 0.012 mg/kg of 43Ca and 0.017 mg/kg of 42Ca. The 43Ca had been mixed in milk and allowed to equilibrate for about 12 h before the test. Immediately after breakfast, 42Ca was injected intravenously over 3 min. Complete urine collection was monitored in each subject for the next 24-h period by the study staff. The 24-h urine sample was later subjected to oxalate precipitation, and the ratio of each isotope to 44Ca was determined by high-resolution inductively coupled plasma mass spectrometry. TFCA was calculated using equations from the pooled 24-h urine samples as described previously [31].
Laboratory assays
Blood was centrifuged to separate serum that was stored at −80°C until further analysis. Serum was analyzed for calcium using a colorimetric method (Arsenazo III, Endpoint, Ponte Scientific, Canton, MI) and other markers. Radioimmunoassays were used to analyze serum levels of PTH (Scantibodies laboratory, CA; CV<6.8%), 25OHD (Diasorin, MN, CV<12.5%), 1,25(OH)2D3 (Diasorin, MN; CV<16.0%), and estradiol (Beckman Coulter, TX; CV<8.9%). Our laboratory participates in the international Vitamin D External Quality Assessment Scheme (to ensure quality and accuracy of 25OHD analysis).
Statistical analysis
Women were divided into tertiles of BMI as follows: leaner (BMI ≤27.1 kg/m2), overweight (BMI 27.2–29.8 kg/m2), and obese group (BMI ≥29.9 kg/m2). Pearson’s correlation coefficient (r) was calculated to quantify the strength of the linear relationship between TFCA, nutrients, and hormones. Stepwise multiple regressions were performed to determine independent dietary and hormonal predictors (independent variables) of TFCA (dependent variable), controlling for other variables. p value ≤0.05 was considered significant. Macronutrient intake, fiber, and alcohol intake, age, BMI, and PTH, 1,25(OH)2D3, 25OHD, and estradiol were used as independent predictors of TFCA. The model R2 (percent of variance explained) was examined to evaluate the contribution of different independent variables to variance explained in TFCA. Since BMI was not normally distributed (mean BMI, 30.9 kg/m2, is higher than the median BMI, 28.4 kg/m2) in this dataset, log-transformed data were also analyzed. Total calcium intake, vitamin D intake, and micronutrient intake were also used as independent predictors in these models, even though we would not expect it to be a major contributor since all participants had similar calcium and micronutrient intakes due to daily supplementation. Data are shown as means±standard deviation (SD) and were analyzed using statistical software (SAS Institute, Cary, NC; version 9.2).
Results
Two hundred and twenty-nine women who participated in clinical trials in our laboratory previously were eligible for this analysis. Women were primarily Caucasian (86%) and aged 54±11 years that included 58 premenopausal (38± 6 years) and 171 postmenopausal (59±6 years). Body composition, TFCA, serum levels of hormones, and dietary intake are presented in Table 1 for the entire cohort of women and separately for the leaner, overweight, and obese women.
Table 1.
Characteristics of women who participated in the study (n=229)
| Variable | All women (n=229) | Leaner (n=76) | Overweight (n=77) | Obese (n=76) | P value for BMI tertiles |
|---|---|---|---|---|---|
| Age (year) | 53.5±11.1 | 53.4±11.4 | 54.3±10.6 | 52.7±11.4 | 0.682 |
| Weight (kg) | 81.9±23.5 | 67.1±5.9a | 75.9±5.7b | 102.7±29.6c | <0.001 |
| BMI (kg/m2) | 31.0±8.4 | 25.4±1.6a | 28.4±0.8b | 39.0±10.4c | <0.001 |
| Lean mass (kg) | 40.4±5.2 | 37.9±3.8a | 39.9±4.1b | 43.7±5.8c | <0.001 |
| Fat mass (kg) | 32.3±8.1 | 25.7±4.5a | 32.2±4.2b | 39.3±8.7c | <0.001 |
| TFCA (fractional) | 0.260±0.089 | 0.249±0.081a | 0.249±0.079a | 0.284±0.103b | 0.019 |
| Serum Ca (mg/dL) | 9.4±0.4 | 9.5±0.4 | 9.4±0.4 | 9.3±0.4 | 0.119 |
| Hormones | |||||
| Estradiol (pg/mL) | 24.9±29.5 | 20.5±16.1 | 25.4±36.3 | 28.6±31.4 | 0.249 |
| Estradiol (pg/mL)1 | 15.2±10.6 | 13.9±7.9a | 13.5±4.3a | 18.3±15.7b | 0.026 |
| 25OHD (ng/mL) | 28.5±9.3 | 30.1±8.0a | 30.0±9.2a | 25.2±9.9b | <0.001 |
| 1,25(OH)2D3 (pg/mL) | 49.2±17.7 | 49.4±15.2 | 50.4±18.9 | 47.8±18.7 | 0.665 |
| PTH (pg/mL) | 42.1±25.3 | 34.0±18.5a | 38.0±22.4a | 54.3±29.4b | <0.001 |
| Nutrient intake2 | |||||
| Energy (kcal) | 1708±581 | 1603±442a | 1675±554a | 1840±696b | 0.038 |
| Carbohydrate (g/day) | 204.9±72.4 | 201.1±67.9 | 205.2±65.5 | 208.3±83.4 | 0.833 |
| Protein (g/day) | 74.4±25.4 | 69.9±21.4a | 73.2±23.5a | 80.1±29.6b | 0.043 |
| Fat (g/day) | 66.4±35.1 | 58.9±29.4a | 63.7±32.8a | 76.5±40.2b | 0.006 |
| Fiber (g/day) | 16.2±7.2 | 17.3±8.3 | 16.1±5.7 | 15.3±7.4 | 0.244 |
| Calcium (mg/day) | 1141±368 | 1125±441 | 1106±324 | 1194±332 | 0.304 |
| Vitamin D (μg/day) | 11.6±2.6 | 11.7±2.2 | 11.9±2.1 | 11.3±7.4 | 0.312 |
| Phosphorous (mg/day) | 1054±399 | 1069±403 | 1040±357 | 1054±438 | 0.912 |
| Caffeine (mg/day) | 137.2±152.4 | 144.6±155.8a | 164.3±173.9a | 102.9±117.5b | 0.041 |
| Alcohol (g/day) | 2.7±7.0 | 3.3±6.4 | 2.8±8.7 | 2.1±5.5 | 0.583 |
| Magnesium (mg/day) | 237.5±99.5 | 250.3±114.5 | 235.7±85.5 | 227.5±97.7 | 0.378 |
| Iron (mg/day) | 13.8±6.4 | 13.3±5.9 | 13.4±4.9 | 14.6±7.9 | 0.342 |
| Sodium (mg/day) | 2787±1384 | 2651±1654a | 2574±1080a | 3130±1335b | 0.028 |
| Selenium (μg/day) | 50.2±47.9 | 34.3±39.8a | 47.4±54.7b | 67.6±41.9c | <0.001 |
Mean ± SD. Analysis was performed using one way analysis of variance with post-hoc testing (Tukey’s method). Values with different superscript letters indicate significant differences
BMI body mass index, TFCA true fractional calcium absorption, BMD bone mineral density, 1,25(OH)2D3 1,25-dihydroxyvitamin D3, 25OHD 25-hydroxyvitamin D, PTH parathyroid hormone
Postmenopausal subset (n=171 with n=56, 60, 55 in the 3 tertiles, respectively). All other hormones showed similar differences between BMI categories that did not vary due to menopausal status
Total nutrient intake includes the amount from diet plus multivitamin (200 mg calcium, 10 μg of vitamin D, 48 μg of phosphorous, 100 mg magnesium, 10 μg vitamin K)
Mean values of TFCA were analyzed in tertiles of BMI and are shown in Table 1. TFCA was significantly higher in the obese women compared to the overweight and normal-weight women (p<0.05) (Table 1, pFig. 1). Ca intake did not differ between the groups and as a result, net absorption was also higher in obese compared to non-obese women (Fig. 1). Not surprisingly, 25OHD and PTH levels were lower and higher, respectively, in the obese women compared to the non-obese women (<0.001) (Table 1). In addition, macronutrient intake was also higher in these obese women. In the postmenopausal women, estradiol levels were higher in the obese group compared to the overweight or leaner group (p<0.05).
Fig. 1.
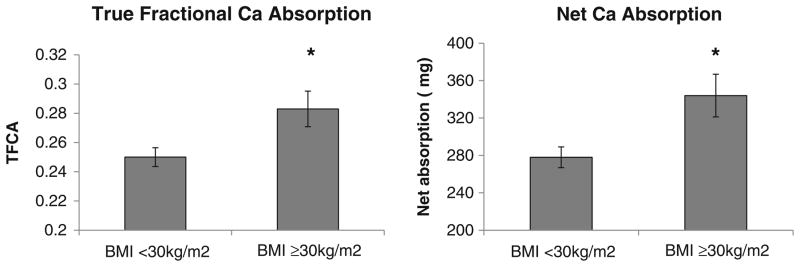
True fractional calcium absorption and net calcium absorption in the leaner/overweight and obese women. Leaner and overweight tertiles were combined since BMI in both these groups (26.8±2.8 kg/m2) fit within the clinical definition of non-obese (BMI<30 kg/m2) compared to obese group (39.0±10.4 kg/m2). Also, there were no significant differences in TFCA and net absorption between the leaner and overweight groups (see Table 1). Asterisk indicates data presented as mean±SEM at p<0.05
Pearson’s correlation between TFCA, hormones, and nutrients
The linear relationship among TFCA, body composition, nutrients, and hormones is presented in Table 2. In the entire population of women, age was negatively associated with TFCA (r=−0.33, p<0.01). BMI, lean mass, and macronutrient intake were positively associated with TFCA (r>0.15, p<0.05). Other nutrients such as fiber and alcohol were not associated with TFCA. Other micronutrients were provided in the multivitamin pill and thus due to similar intake, they were not included in the correlation analysis. Serum levels of PTH and estradiol were positively associated with TFCA (r≥0.17, p<0.05) (Table 2), whereas there was no association with serum 25OHD and 1,25(OH)2D3. Similar correlations were observed in the overweight and obese women, whereas only estradiol correlated with TFCA in the leaner women.
Table 2.
Pearson’s correlations of TFCA with age, BMI, and dietary and hormonal factors
| Variable | All women (n=229) | Leaner (n=76) | Overweight (n=77) | Obese (n=76) |
|---|---|---|---|---|
| Age | −0.331* | −0.163 | −0.303* | −0.476* |
| BMI | 0.288* | −0.099 | −0.183 | 0.369* |
| Trochanter BMD | 0.012 | −0.015 | −0.157 | 0.059 |
| Femoral Neck BMD | 0.118 | 0.102 | −0.027 | 0.167 |
| Total body BMD | 0.035 | −0.105 | −0.168 | 0.217t |
| Nutrients | ||||
| Carbohydrate | 0.189** | −0.007 | 0.334* | 0.214t |
| Protein | 0.260* | −0.011 | 0.259** | 0.363** |
| Fat | 0.373* | 0.211t | 0.454* | 0.360* |
| Ca | 0.069 | −0.094 | 0.138 | 0.134 |
| Fiber | −0.053 | −0.078 | 0.094 | −0.080 |
| Alcohol | 0.041 | 0.137 | −0.048 | 0.114 |
| Vit D | 0.112 | −0.110 | −0.138 | 0.070 |
| Hormones | ||||
| PTH | 0.172** | −0.029 | 0.004 | 0.268** |
| 25OHD | −0.082 | 0.031 | 0.065 | −0.158 |
| 1,25(OH)2D3 | 0.091 | 0.172 | 0.094 | 0.065 |
| Estradiol | 0.291* | 0.249** | 0.252** | 0.351* |
Pearson’s correlations (r) values are presented
BMI body mass index, BMD bone mineral density, 1,25 (OH)2D3 1,25-dihydroxyvitamin D3, 25OHD 25-hydroxyvitamin D, PTH parathyroid hormone
p<0.01;
p<0.05;
p<0.1
Independent hormonal and dietary predictors of TFCA
The independent dietary and hormonal predictors of TFCA in all women are presented in Table 3. These independent factors together explain 26% of the variance in TFCA. The standardized beta coefficient (and not the regular coefficient) is reported which represents the SD change of the dependent variable due to one SD change in the independent variable. The most significant variance in TFCA is explained by age, with one deviation increase in age, leading to −0.26 SD decrease in TFCA. The second largest predictor for TFCA in the entire group of women was explained by dietary intake of fat (p<0.05) with one deviation increase in fat intake, leading to 0.18 SD increase in TFCA. Serum levels of estradiol and 1,25(OH)2D3 were also positive predictors of TFCA (p<0.05) (Table 3). Log transformation of BMI was also done and was examined as an independent predictor in the model due to the non-normal distribution of BMI. The primary predictors of TFCA remained as age, estradiol, 1,25(OH)2D3 and fat intake, and the log-transformed BMI was still not a predictor of TFCA. We did not analyze the predictors in the individual BMI tertiles due to the narrow range of BMI in the two lower tertiles and also due to a narrow range of explanatory variables in these relatively smaller groups. However, when examining predictors in obese women (BMI >30 kg/m2) compared to non-obese women (BMI <30 kg/m2), we found that only fat intake explained Ca absorption in the non-obese women (p<0.02), whereas age was the only factor determining variance in the obese women (p<0.05). Also a separate analysis of predictors in the premenopausal women showed that age was the only source of variance for TFCA (p<0.02), while in the postmenopausal women, Ca intake was a negative predictor, and fat intake and 1,25(OH)2D3 (p<0.05) were positive predictors of TFCA.
Table 3.
Multiple regression model analyzing independent predictors of TFCA in entire population of women
| All women model R2=25.6% | ||
|---|---|---|
| Variable | β coefficient | P value |
| Age | −0.258 | 0.001 |
| Fat intake | 0.178 | 0.032 |
| 1,25(OH)2D3 | 0.148 | 0.042 |
| Estradiol | 0.137 | 0.046 |
| BMI | 0.107 | 0.195 |
| Ca intake | −0.062 | 0.391 |
| Alcohol intake | 0.049 | 0.450 |
| PTH | 0.031 | 0.681 |
| Fiber intake | −0.029 | 0.696 |
| Protein intake | 0.028 | 0.698 |
| 25OHD | 0.026 | 0.428 |
| Sodium intake | −0.018 | 0.843 |
| Vitamin D intake | 0.015 | 0.832 |
| Carbohydrate intake | −0.012 | 0.878 |
1,25(OH)2D3 1,25-dihydroxyvitamin D3, BMI body mass index, 25OHD 25-hydroxyvitamin D, PTH parathyroid hormone
Discussion
The variability in the amount of calcium absorbed by individuals is high since several factors contribute to lower or higher absorptive efficiency. These factors include age, hormonal factors such as estradiol, 1,25(OH)2D3 and dietary factors such as calcium, protein, and fat intake [6, 14, 15]. The relative influence of all these factors on TFCA has not been addressed previously and was the primary focus in this study. Importantly, due to the wide range in body weights in this population, we specifically examine how BMI affects these factors and influences TFCA by examining the population in BMI tertiles. These data show that TFCA is higher in the obese group compared to the non-obese women, and this may be an important mechanism to increase BMD in larger persons.
There are multiple factors that may contribute to a higher calcium absorption in the obese individual. This may include their higher macronutrient intake such as protein and fat, both of which have a positive effect on absorption [6, 18]. Our data also show that the obese have higher sodium intake but lower caffeine consumption which would be expected to increase and decrease calcium excretion, respectively. In addition, higher levels of PTH and estradiol in the obese shown here and by others [25–28] should contribute to the greater calcium absorption. In our population, we did not find higher serum estradiol levels in the obese than non-obese women, but by excluding the variability of serum estradiol in the premenopausal women, estradiol levels were, in fact, higher in the obese postmenopausal women. The lower levels of 25OHD and similar or lower levels of 1,25(OH)2D3 due to high BMI is an expected finding in obesity [22, 23, 32]but does not explain their higher Ca absorption. Height was used as an indicator of gut length in the model, since it is positively associated with absorption [33]; however, it was not a significant predictor of TFCA. Whether or not the higher Ca absorption in obesity is due to individual hormones or nutrients, or a combination of these factors, is not clear from this cross-sectional analysis and would require future trials.
The greatest variance in TFCA in these women is explained by aging. Aging reduces the expression of intestinal calcium transporters, TRPV6 and calbindin-D9k [34] and is associated with an increased intestinal resistance to 1,25(OH)2D3 [35]. A decline in renal function due to aging may also result in reduced TFCA [36, 37], but the women in this study were generally healthy, and when multiple regression analysis was done on the subset of postmenopausal women, age was no longer a significant predictor of TFCA. In addition, the population included very few elderly individuals (<3%) who were greater than 70 years of age. Hence, it is likely that the strong apparent age-related decline in TFCA in these women was largely due to a decline in serum estradiol and possibly other sex steroids [4, 6, 24, 38].
The current study shows that a higher level of serum estradiol is a significant positive predictor of absorption in women at all ages, and that it directly correlates with absorption in all three BMI tertiles. Estradiol treatment has been shown to influence calcium absorption [39] without influencing 1,25(OH)2D3 levels [40]. Studies in VDR KO mice show that estrogen replacement after ovariectomy induces intestinal TRPV6, whereas TRPV6 is reduced in estrogen receptor α null mice [9]. Together, the clinical and animal findings suggest that estrogen action on calcium absorption is independent of vitamin D. The direct effect of estrogen on bone is well known, and these data suggest that estrogen also increases Ca absorption in obesity.
Serum PTH showed a positive correlation with TFCA in this dataset but did not explain the variance of TFCA, despite a relatively wide range of PTH values. These findings are consistent with others showing that PTH does not explain the variance in TFCA [15] or has a weak positive association (Table 2) [6]. Maximal suppression of PTH by serum 25OHD is considered an indicator of maximal calcium absorption efficiency [41]. However, serum 25OHD is an indirect marker of 1,25(OH)2D3 that affects Ca absorption, so it is not surprising that it does not always show a positive relationship with TFCA in adults [6, 14, 15, 42] and in children [20, 42, 43]. In contrast, supplementation with a large dose of vitamin D increases short-term Ca absorption [19], but this is not always shown with lower doses [21, 44]. Serum calcitriol shows a linear relationship with Ca absorption in both children and adults [6, 14, 15] and is an independent predictor of calcium absorption in women [6, 14, 42], consistent with our findings in the current dataset over a wider age and BMI range than in previous studies.
These observational data strongly support the direct association between fat intake and TFCA, and this may be due to a variety of reasons. A high-fat diet may indirectly increase estradiol levels [45] since a high-fat intake increases adipose tissue production of androdiestrone, and low-fat diets lower serum estradiol levels in women [46]. Thus, a dietary fat-stimulated increase in serum estradiol could positively influence both calcium absorption and bone [4, 30]. Vitamin D-dependent changes in membrane lipid composition and fluidity are partially responsible for altering the rate of calcium transport and absorption [47, 48]. There may be an indirect effect of higher fat on Ca absorption by enhancing serum levels of 25OHD and 1,25(OH)2D3, although the type of fat may also affect this. For example, a recent well-designed study showed that monounsaturated fatty acids, but not polyunsaturated fats, increases serum 25OHD levels [49]. Our findings do not address the type of fat, as the accuracy of assessing this and the range of intake in this cross-sectional study limit our ability to examine this question. In contrast to our findings and those in another clinical trial that higher fat predicts higher Ca absorption [6], continual high-fat feeding in a rodent model [50] shows exactly the opposite effect on calcium absorption. However, this model differs due to the very high-fat intake due to the hyperphagia in a diet-induced obesity model. In the current study, we found that total fat was the only dietary variable that was a predictor of TFCA. We suggest that higher fat intake in leaner women may be important for raising Ca absorption in an at-risk population that is also at higher risk of fracture [51].
Several other dietary factors have been shown to influence Ca absorption. Dietary protein intake has been shown to increase transcellular uptake of calcium [17] and intestinal absorption of calcium [18]. In this study, we found a positive association between TFCA and protein intake, but it was not a significant predictor in the multiple regression analysis. Although we did not find any relationship of TFCA with fiber intake, others have found a negative association between fiber intake and calcium absorption [6]; however, more recently the effect of fiber has been clarified [52]. Specific compounds in wheat products (i.e., phytates) will reduce absorption, but total fiber intake has little, if any, relationship with Ca absorption.
A major strength of this study is the inclusion of women with a wide range of age, body weight, and nutrient intake. In addition, this study is the first to examine both younger and older estrogen-deficient women. A unique aspect of the dataset is that all women were stabilized to the recommended Ca intake, thereby reducing serum PTH variability and allowing for a more careful examination of other Ca-absorption regulators. In addition, the stable isotope method to estimate true fractional calcium absorption is considered a gold standard to estimate intestinal absorption, and this is the largest dataset in adults using this methodology. The inclusion and separate examination of obese individuals was also unique to this dataset. Due to the predominance of higher body weights in this dataset, the mean lowest and middle BMI tertiles are close in values (25 kg/m2 and 27 kg/m2, respectively) compared to the highest tertile with a mean BMI of 39 kg/m2. Hence, it is not surprising that the two lower tertiles showed similar characteristics including TFCA, whereas a lower body weight would be expected to further reduce TFCA [5]. In addition, the potential generalizability of these data is a concern, since this was primarily a Caucasian population. Furthermore, several factors in addition to nutrient and hormonal factors influence absorption such as gut motility, intestinal transit time, and/or hydration status that were not measured in this study. Due to the nature of this study design, confounding variables cannot be excluded as an explanation for correlations observed. Finally, the model of nutrients and hormones explains ~26% of total variance in the model, and this suggests that there are other factors that influence the absorptive process.
Overall, these data show a decline in Ca absorption with age, and the significant independent positive predictors are dietary fat, serum estradiol, and 1,25(OH)2D3. The extent to which higher serum levels of estradiol and PTH in the obese increases calcium absorption in this population is not known. Our data suggest that dietary intake of fat may play a more important role in raising Ca absorption in the normal-weight and overweight than obese individuals, possibly because the obese are exceeding a fat threshold value. This may have special implications for dietary intake for non-obese individuals who are more likely to have lower and potentially compromised Ca absorption. In addition, understanding whether there is a specific level of dietary fat required for optimal calcium absorption may be particularly important during low calorie and fat intakes since weight reduction reduces Ca absorption and increases bone loss and fracture risk [53].
Acknowledgments
We wish to thank Drs. Riedt, Cifuentes and Sherrell, and Hasina Ambia-Sobhan for their effort in the clinical trials and/or laboratory analysis. We also thank the volunteers for their commitment in these studies. Funding sources for this study are NIH-NIA-AG12161, NH-ODS, NJAES-0153866, and a Busch Biomedical (201095157).
Footnotes
Conflicts of interest None
Contributor Information
S. A. Shapses, Email: shapses@aesop.rutgers.edu, Department of Nutritional Sciences, Rutgers University, 96 Lipman Drive, New Brunswick, NJ 08901-8525, USA
D. Sukumar, Department of Nutritional Sciences, Rutgers University, 96 Lipman Drive, New Brunswick, NJ 08901-8525, USA
S. H. Schneider, Department of Endocrinology and Metabolism, University of Medicine and Dentistry at New Jersey, New Brunswick, NJ 08901, USA
Y. Schlussel, Department of Nutritional Sciences, Rutgers University, 96 Lipman Drive, New Brunswick, NJ 08901-8525, USA
R. E. Brolin, University Medical Center at Princeton, Princeton, NJ 08540, USA
L. Taich, Department of Nutritional Sciences, Rutgers University, 96 Lipman Drive, New Brunswick, NJ 08901-8525, USA
References
- 1.Ensrud KE, Duong T, Cauley JA, Heaney RP, Wolf RL, Harris E, Cummings SR. Low fractional calcium absorption increases the risk for hip fracture in women with low calcium intake. Study of Osteoporotic Fractures Research Group. Ann Intern Med. 2000;132:345–53. doi: 10.7326/0003-4819-132-5-200003070-00003. [DOI] [PubMed] [Google Scholar]
- 2.Need AG, Morris HA, Horowitz M, Scopacasa E, Nordin BE. Intestinal calcium absorption in men with spinal osteoporosis. Clin Endocrinol (Oxf) 1998;48:163–68. doi: 10.1046/j.1365-2265.1998.3681181.x. [DOI] [PubMed] [Google Scholar]
- 3.Nordin BE, Need AG, Morris HA, O’Loughlin PD, Horowitz M. Effect of age on calcium absorption in postmenopausal women. Am J Clin Nutr. 2004;80:998–1002. doi: 10.1093/ajcn/80.4.998. [DOI] [PubMed] [Google Scholar]
- 4.Nordin BE, Robertson A, Seamark RF, Bridges A, Philcox JC, Need AG, Horowitz M, Morris HA, Deam S. The relation between calcium absorption, serum dehydroepiandrosterone, and vertebral mineral density in postmenopausal women. J Clin Endocrinol Metab. 1985;60:651–57. doi: 10.1210/jcem-60-4-651. [DOI] [PubMed] [Google Scholar]
- 5.Smith E, Need AG, Schultz CG, Horowitz M. Does the response of bone mass to calcium supplements depend on calcium absorption efficiency? Eur J Endocrinol. 2004;151:759–63. doi: 10.1530/eje.0.1510759. [DOI] [PubMed] [Google Scholar]
- 6.Wolf RL, Cauley JA, Baker CE, Ferrell RE, Charron M, Caggiula AW, Salamone LM, Heaney RP, Kuller LH. Factors associated with calcium absorption efficiency in pre- and perimenopausal women. Am J Clin Nutr. 2000;72:466–71. doi: 10.1093/ajcn/72.2.466. [DOI] [PubMed] [Google Scholar]
- 7.Heaney RP, Recker RR. Estimation of true calcium absorption. Ann Intern Med. 1985;103:516–21. doi: 10.7326/0003-4819-103-4-516. [DOI] [PubMed] [Google Scholar]
- 8.Wishart JM, Scopacasa F, Horowitz M, Morris HA, Need AG, Clifton PM, Nordin BE. Effect of perimenopause on calcium absorption: a longitudinal study. Climacteric. 2000;3:102–8. doi: 10.3109/13697130009167611. [DOI] [PubMed] [Google Scholar]
- 9.Van Cromphaut SJ, Rummens K, Stockmans I, Van HE, Dijcks FA, Ederveen AG, Carmeliet P, Verhaeghe J, Bouillon R, Carmeliet G. Intestinal calcium transporter genes are upregulated by estrogens and the reproductive cycle through vitamin D receptor-independent mechanisms. J Bone Miner Res. 2003;18:1725–36. doi: 10.1359/jbmr.2003.18.10.1725. [DOI] [PubMed] [Google Scholar]
- 10.Need AG, O’Loughlin PD, Morris HA, Horowitz M, Nordin BE. The effects of age and other variables on serum parathyroid hormone in postmenopausal women attending an osteoporosis center. J Clin Endocrinol Metab. 2004;89:1646–49. doi: 10.1210/jc.2003-031539. [DOI] [PubMed] [Google Scholar]
- 11.Bronner F. Recent developments in intestinal calcium absorption. Nutr Rev. 2009;67:109–13. doi: 10.1111/j.1753-4887.2008.00147.x. [DOI] [PubMed] [Google Scholar]
- 12.Ajibade DV, Dhawan P, Fechner AJ, Meyer MB, Pike JW, Christakos S. Evidence for a role of prolactin in calcium homeostasis: regulation of intestinal transient receptor potential vanilloid type 6, intestinal calcium absorption, and the 25-hydroxyvitamin D(3) 1alpha hydroxylase gene by prolactin. Endocrinology. 2010;151:2974–84. doi: 10.1210/en.2010-0033. [DOI] [PMC free article] [PubMed] [Google Scholar]
- 13.Heaney RP. 25-Hydroxyvitamin D and calcium absorption. Am J Clin Nutr. 2011;93:220–221. doi: 10.3945/ajcn.110.004838. [DOI] [PubMed] [Google Scholar]
- 14.Aloia JF, Chen DG, Yeh JK, Chen H. Serum vitamin D metabolites and intestinal calcium absorption efficiency in women. Am J Clin Nutr. 2010;92:835–40. doi: 10.3945/ajcn.2010.29553. [DOI] [PMC free article] [PubMed] [Google Scholar]
- 15.Sai AJ, Walters RW, Fang X, Gallagher JC. Relationship between Vitamin D, parathyroid hormone, and bone health. J Clin Endocrinol Metab. 2011;96:E436–E446. doi: 10.1210/jc.2010-1886. [DOI] [PMC free article] [PubMed] [Google Scholar]
- 16.Need AG, O’Loughlin PD, Morris HA, Coates PS, Horowitz M, Nordin BE. Vitamin D metabolites and calcium absorption in severe vitamin D deficiency. J Bone Miner Res. 2008;23:1859–63. doi: 10.1359/jbmr.080607. [DOI] [PubMed] [Google Scholar]
- 17.Gaffney-Stomberg E, Insogna KL, Rodriguez NR, Kerstetter JE. Increasing dietary protein requirements in elderly people for optimal muscle and bone health. J Am Geriatr Soc. 2009;57:1073–79. doi: 10.1111/j.1532-5415.2009.02285.x. [DOI] [PubMed] [Google Scholar]
- 18.Kerstetter JE, O’Brien KO, Caseria DM, Wall DE, Insogna KL. The impact of dietary protein on calcium absorption and kinetic measures of bone turnover in women. J Clin Endocrinol Metab. 2005;90:26–31. doi: 10.1210/jc.2004-0179. [DOI] [PubMed] [Google Scholar]
- 19.Hansen KE, Jones AN, Lindstrom MJ, Davis LA, Engelke JA, Shafer MM. Vitamin D insufficiency: disease or no disease? J Bone Miner Res. 2008;23:1052–60. doi: 10.1359/JBMR.080230. [DOI] [PMC free article] [PubMed] [Google Scholar]
- 20.Park CY, Hill KM, Elble AE, Martin BR, DiMeglio LA, Peacock M, McCabe GP, Weaver CM. Daily supplementation with 25 mug cholecalciferol does not increase calcium absorption or skeletal retention in adolescent girls with low serum 25-hydroxyvitamin D. J Nutr. 2010;140:2139–44. doi: 10.3945/jn.110.124891. [DOI] [PubMed] [Google Scholar]
- 21.Zhu K, Bruce D, Austin N, Devine A, Ebeling PR, Prince RL. Randomized controlled trial of the effects of calcium with or without vitamin D on bone structure and bone-related chemistry in elderly women with vitamin D insufficiency. J Bone Miner Res. 2008;23:1343–48. doi: 10.1359/jbmr.080327. [DOI] [PubMed] [Google Scholar]
- 22.Bell NH, Epstein S, Greene A, Shary J, Oexmann MJ, Shaw S. Evidence for alteration of the vitamin D-endocrine system in obese subjects. J Clin Invest. 1985;76:370–373. doi: 10.1172/JCI111971. [DOI] [PMC free article] [PubMed] [Google Scholar]
- 23.Parikh SJ, Edelman M, Uwaifo GI, Freedman RJ, Semega-Janneh M, Reynolds J, Yanovski JA. The relationship between obesity and serum 1,25-dihydroxy vitamin D concentrations in healthy adults. J Clin Endocrinol Metab. 2004;89:1196–99. doi: 10.1210/jc.2003-031398. [DOI] [PubMed] [Google Scholar]
- 24.Wortsman J, Matsuoka LY, Chen TC, Lu Z, Holick MF. Decreased bioavailability of vitamin D in obesity. Am J Clin Nutr. 2000;72:690–693. doi: 10.1093/ajcn/72.3.690. [DOI] [PubMed] [Google Scholar]
- 25.Bolland MJ, Grey AB, Ames RW, Horne AM, Gamble GD, Reid IR. Fat mass is an important predictor of parathyroid hormone levels in postmenopausal women. Bone. 2006;38:317–21. doi: 10.1016/j.bone.2005.08.018. [DOI] [PubMed] [Google Scholar]
- 26.Pitroda AP, Harris SS, Dawson-Hughes B. The association of adiposity with parathyroid hormone in healthy older adults. Endocrine. 2009;36:218–23. doi: 10.1007/s12020-009-9231-x. [DOI] [PMC free article] [PubMed] [Google Scholar]
- 27.Sukumar D, Schlussel Y, Riedt CS, Gordon C, Stahl T, Shapses SA. Obesity alters cortical and trabecular bone density and geometry in women. Osteoporos Int. 2011;22:635–45. doi: 10.1007/s00198-010-1305-3. [DOI] [PMC free article] [PubMed] [Google Scholar]
- 28.Pinkney JH, Kopelman PG. Endocrine determinants of obesity. Handbook of Obesity- Etiology and Pathophysiology. 2011:655–69. [Google Scholar]
- 29.Mahabir S, Baer DJ, Johnson LL, Hartman TJ, Dorgan JF, Campbell WS, Clevidence BA, Taylor PR. Usefulness of body mass index as a sufficient adiposity measurement for sex hormone concentration associations in postmenopausal women. Cancer Epidemiol Biomarkers Prev. 2006;15:2502–7. doi: 10.1158/1055-9965.EPI-06-0499. [DOI] [PubMed] [Google Scholar]
- 30.Cifuentes M, Advis JP, Shapses SA. Estrogen prevents the reduction in fractional calcium absorption due to energy restriction in mature rats. J Nutr. 2004;134:1929–34. doi: 10.1093/jn/134.8.1929. [DOI] [PMC free article] [PubMed] [Google Scholar]
- 31.Cifuentes M, Riedt CS, Brolin RE, Field MP, Sherrell RM, Shapses SA. Weight loss and calcium intake influence calcium absorption in overweight postmenopausal women. Am J Clin Nutr. 2004;80:123–30. doi: 10.1093/ajcn/80.1.123. [DOI] [PMC free article] [PubMed] [Google Scholar]
- 32.Arunabh S, Pollack S, Yeh J, Aloia JF. Body fat content and 25-hydroxyvitamin D levels in healthy women. J Clin Endocrinol Metab. 2003;88:157–61. doi: 10.1210/jc.2002-020978. [DOI] [PubMed] [Google Scholar]
- 33.Barger-Lux MJ, Heaney RP. Calcium absorptive efficiency is positively related to body size. J Clin Endocrinol Metab. 2005;90:5118–20. doi: 10.1210/jc.2005-0636. [DOI] [PubMed] [Google Scholar]
- 34.Christakos S, Dhawan P, Porta A, Mady LJ, Seth T. Vitamin D and intestinal calcium absorption. Mol Cell Endocrinol. 2011;347(1–2):25–9. doi: 10.1016/j.mce.2011.05.038. [DOI] [PMC free article] [PubMed] [Google Scholar]
- 35.Wood RJ, Fleet JC, Cashman K, Bruns ME, Deluca HF. Intestinal calcium absorption in the aged rat: evidence of intestinal resistance to 1,25(OH)2 vitamin D. Endocrinology. 1998;139:3843–48. doi: 10.1210/endo.139.9.6176. [DOI] [PubMed] [Google Scholar]
- 36.Institute of Medicine. Dietary Reference Intakes for Calcium and Vitamin D. The National Academies Press; Washington, DC: 2011. [PubMed] [Google Scholar]
- 37.Armbrecht HJ, Forte LR, Halloran BP. Effect of age and dietary calcium on renal 25(OH)D metabolism, serum 1,25(OH) 2D, and PTH. Am J Physiol. 1984;246:E266–E270. doi: 10.1152/ajpendo.1984.246.3.E266. [DOI] [PubMed] [Google Scholar]
- 38.Heaney RP, Recker RR, Stegman MR, Moy AJ. Calcium absorption in women: relationships to calcium intake, estrogen status, and age. J Bone Miner Res. 1989;4:469–75. doi: 10.1002/jbmr.5650040404. [DOI] [PubMed] [Google Scholar]
- 39.Ten BM, Netelenbos JC, Barto R, Van Buuren LM, van der Vijgh WJ. Estrogen regulation of intestinal calcium absorption in the intact and ovariectomized adult rat. J Bone Miner Res. 1999;14:1197–202. doi: 10.1359/jbmr.1999.14.7.1197. [DOI] [PubMed] [Google Scholar]
- 40.O’Loughlin PD, Morris HA. Oestrogen deficiency impairs intestinal calcium absorption in the rat. J Physiol. 1998;511(Pt 1):313–22. doi: 10.1111/j.1469-7793.1998.313bi.x. [DOI] [PMC free article] [PubMed] [Google Scholar]
- 41.Heaney RP. The Vitamin D requirement in health and disease. J Steroid Biochem Mol Biol. 2005;97:13–19. doi: 10.1016/j.jsbmb.2005.06.020. [DOI] [PubMed] [Google Scholar]
- 42.Thacher TD, Obadofin MO, O’Brien KO, Abrams SA. The effect of vitamin D2 and vitamin D3 on intestinal calcium absorption in Nigerian children with rickets. J Clin Endocrinol Metab. 2009;94:3314–21. doi: 10.1210/jc.2009-0018. [DOI] [PMC free article] [PubMed] [Google Scholar]
- 43.Abrams SA, Hicks PD, Hawthorne KM. Higher serum 25-hydroxyvitamin D levels in school-age children are inconsistently associated with increased calcium absorption. J Clin Endocrinol Metab. 2009;94:2421–27. doi: 10.1210/jc.2008-2587. [DOI] [PMC free article] [PubMed] [Google Scholar]
- 44.Shapses SA, Kendler D, Robson R, Hansen KE, Sherrel R, Field MP, Woolf E, Berd Y, Mantz AM, Santora A. Effect of alendronate and vitamin D(3) on fractional calcium absorption in a double-blind, randomized, placebo-controlled trial in postmenopausal osteoporotic women. J Bone Miner Res. 2011;26(8):1836–44. doi: 10.1002/jbmr.395. [DOI] [PubMed] [Google Scholar]
- 45.Nagata C, Nagao Y, Shibuya C, Kashiki Y, Shimizu H. Fat intake is associated with serum estrogen and androgen concentrations in postmenopausal Japanese women. J Nutr. 2005;135:2862–65. doi: 10.1093/jn/135.12.2862. [DOI] [PubMed] [Google Scholar]
- 46.Wu AH, Pike MC, Stram DO. Meta-analysis: dietary fat intake, serum estrogen levels, and the risk of breast cancer. J Natl Cancer Inst. 1999;91:529–34. doi: 10.1093/jnci/91.6.529. [DOI] [PubMed] [Google Scholar]
- 47.Fontaine O, Matsumoto T, Goodman DB, Rasmussen H. Liponomic control of Ca2+ transport: relationship to mechanism of action of 1,25-dihydroxyvitamin D3. Proc Natl Acad Sci U S A. 1981;78:1751–54. doi: 10.1073/pnas.78.3.1751. [DOI] [PMC free article] [PubMed] [Google Scholar]
- 48.Cartwright IJ, Higgins JA. Increased dietary triacylglycerol markedly enhances the ability of isolated rabbit enterocytes to secrete chylomicrons: an effect related to dietary fatty acid composition. J Lipid Res. 1999;40:1858–66. [PubMed] [Google Scholar]
- 49.Niramitmahapanya S, Harris SS, Dawson-Hughes B. Type of dietary fat is associated with the 25-hydroxyvitamin D3 increment in response to vitamin D supplementation. J Clin Endocrinol Metab. 2011;96(10):3170–4. doi: 10.1210/jc.2011-1518. [DOI] [PMC free article] [PubMed] [Google Scholar]
- 50.Xiao Y, Cui J, Li YX, Shi YH, Wang B, Le GW, Wang ZP. Dyslipidemic high-fat diet affects adversely bone metabolism in mice associated with impaired antioxidant capacity. Nutrition. 2010;27 (2):214–20. doi: 10.1016/j.nut.2009.11.012. [DOI] [PubMed] [Google Scholar]
- 51.Armstrong ME, Spencer EA, Cairns BJ, Banks E, Pirie K, Green J, Wright FL, Reeves GK, Beral V. Body mass index and physical activity in relation to the incidence of hip fracture in postmenopausal women. J Bone Miner Res. 2011;26:1330–1338. doi: 10.1002/jbmr.315. [DOI] [PubMed] [Google Scholar]
- 52.Heaney RP, Weaver CM. Newer perspectives on calcium nutrition and bone quality. J Am Coll Nutr. 2005;24:574S–81S. doi: 10.1080/07315724.2005.10719506. [DOI] [PubMed] [Google Scholar]
- 53.Shapses SA, Riedt CS. Bone, body weight, and weight reduction: what are the concerns? J Nutr. 2006;136:1453–56. doi: 10.1093/jn/136.6.1453. [DOI] [PMC free article] [PubMed] [Google Scholar]