

Abstract
Optimizing anticancer therapeutics needs to account for variable drug responses in heterogeneous cell populations within the tumor as well as in organs of toxicity. To address cell heterogeneity, we propose a multiscale modeling approach—from in vitro to preclinical and clinical studies—to develop cell-type–specific pharmacokinetic–pharmacodynamic (PK-PD) models. A physiologically based mechanistic modeling approach integrating data from aqueous solutions, U87 glioma cells, mice, and cancer patients was utilized to characterize the brain disposition of temozolomide (TMZ), the cornerstone of chemotherapy against glioblastoma multiforme. The final model represented intracellular normal brain and brain tumor compartments in which TMZ pH-dependent conversion to the DNA-alkylating species leads to the formation of DNA adducts that serve as an entry point for a PD model. This multiscale protocol can be extended to account for TMZ PK-PD in different cell populations, thus providing a critical tool to personalize TMZ-based chemotherapy on a cell-type–specific basis.
Personalized cancer therapy is a new horizon that offers to dramatically improve patient responses and early attempts to tailor chemotherapy are either rooted in a patient's genomic signature1,2,3 or based on systems pharmacological approaches involving protein networks and pharmacokinetic–pharmacodynamic (PK-PD) models.4,5,6,7 Regardless of whether genomic- or protein-centric methods are undertaken, an account of cell heterogeneity is in order. Indeed, recent analyses have revealed heterogeneity both within the tumor region—a collection of cell types, such as cancer cells, tumor stem cells, endothelial cells, and immune cells8—and within organs of toxicity that may include different healthy cell types; for instance, bone marrow contains hematopoietic progenitors of different maturities.9 Each cell population may display specific PK-PD characteristics and drug sensitivity that will impact the overall response.
To address cell heterogeneity, a systems pharmacological approach utilizing network PK-PD models is proposed as a comprehensive mean to design patient chemotherapy. We considered the importance of constructing physiologically based models with intracellular compartments as this provides relevant PK-PD features that could differentiate drug action in each cell type. However, the experimental assessment of such cell-type–specific intracellular PK-PD models remains challenging in a preclinical setting and to a greater extent in cancer patients. In particular, although one can readily appreciate that intracellular drug concentrations are the final input to drug action or PDs, there has been no tangible means to obtain this information in a whole animal. In this context, we developed a multiscale—in vitro to in vivo—modeling approach to bridge this gap.
The multiscale modeling protocol was developed for temozolomide (TMZ), the cornerstone of chemotherapy against glioblastoma multiforme (GBM), the most frequent primary brain tumor in adults.10,11 GBM therapeutic management involving surgery, radiation, and chemotherapy has shown suboptimal advances as patient median survival remains at 12 to 14 months and may benefit from personalized TMZ-based chemotherapy. TMZ is a prodrug that spontaneously converts into its metabolite 5-(3-methyltriazen-1-yl)imidazole-4-carboxamide (MTIC), which is subsequently degraded into 4-amino-5-imidazole-carboxamide (AIC)—an inactive metabolite—and a methyldiazonium cation, the DNA-methylating species.12,13,14 These reactions are pH-dependent as TMZ and MTIC degradation rates increase and decrease, respectively, with pH values.15 The methyldiazonium cation creates DNA adducts—a marker of TMZ PD—that trigger DNA damage responses involving the p53 pathway, DNA repair mechanisms, and potentially cell-cycle arrest and cell apoptosis.14,16 To initiate the development of cell-type–specific PK-PD models, we considered a homogeneous population of glioma cells for the brain tumor that was cast into intracellular PK models to ultimately specify the brain disposition of TMZ and its metabolites.
Results
The multiscale approach to design a model of TMZ intracellular brain disposition progressed through the following steps: (i) TMZ pH-dependent conversion study in solutions, (ii) in vitro TMZ conversion and transport studies in U87 glioma cells, (iii) TMZ PK studies in mice, and (iv) TMZ PK studies in brain tumor patients. They are presented in sequence below.
TMZ pH-dependent conversion
The model of TMZ pH-dependent conversion was derived from the literature12,13,14 and represents a stoichiometric degradation of TMZ to its metabolite MTIC—rate constant  —that subsequently fragments into the methyldiazonium cation and the inactive species AIC via rate constant
  (Figure 1a, equations in Supplementary Data). The rates
  and
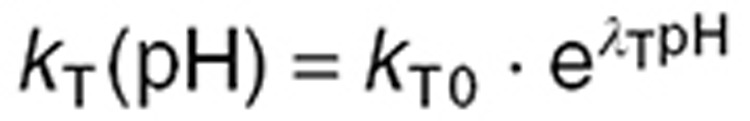
and  are highly pH-dependent since TMZ is stable at acidic pH but decomposes to MTIC at more alkaline pH values, whereas MTIC degradation rate is lower at large pH values and increases as pH decreases.12,15 They were modeled as:
 |
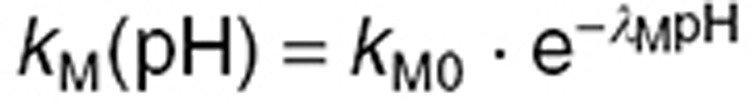 |
Figure 1.

A multiscale approach for mechanistic modeling of TMZ PK. (a) TMZ pH-dependent conversion in solution. Each molecule of TMZ produces one molecule of MTIC that further degrades into one molecule of AIC, an inactive metabolite, and one molecule of the methyldiazonium cation, which is the methylating agent. (b) TMZ PK and simplified PD model in U87 glioma cells. See Results section for the definition of mathematical variables and parameters. (c) Model of TMZ brain disposition in tumor-bearing mice and brain tumor patients. The blood compartment is a forcing function, whereas the normal brain and brain tumor compartments are represented by physiologically based models. See Results section for the definition of mathematical variables and parameters. (d) Prospective cell-type–specific model of TMZ PK-PD. The brain disposition model, can be extended to account for cell heterogeneity both in the tumor region and in the bone marrow, the main toxicity target of TMZ. The blood and interstitial fluid compartments are directly inferred from the brain disposition model whereas each cell type is represented by a model of TMZ intracellular PK-PD fitted to in vitro data performed in the corresponding cell population. MTIC, metabolite 5-(3-methyltriazen-1-yl)imidazole-4-carboxamide; PD, pharmacodynamics; PK, pharmacokinetics; TMZ, temozolomide.
The instability of the methyldiazonium cation, which is a highly reactive species was represented by a degradation of rate constant kcat set to 6,000 h–1 that is equivalent to a half-life of 0.4 s.17 Parameters kT0, λT, kM0, and λM were estimated utilizing available TMZ, MTIC, and AIC concentration–time data in buffer solutions at four pH values (1, 6.8, 9.1, and 13) with an initial TMZ concentration of 1 mmol/l15 (Table 1). The best-fit model closely agreed with the observed data (Figure 2a–d).
Table 1. Model parameters.
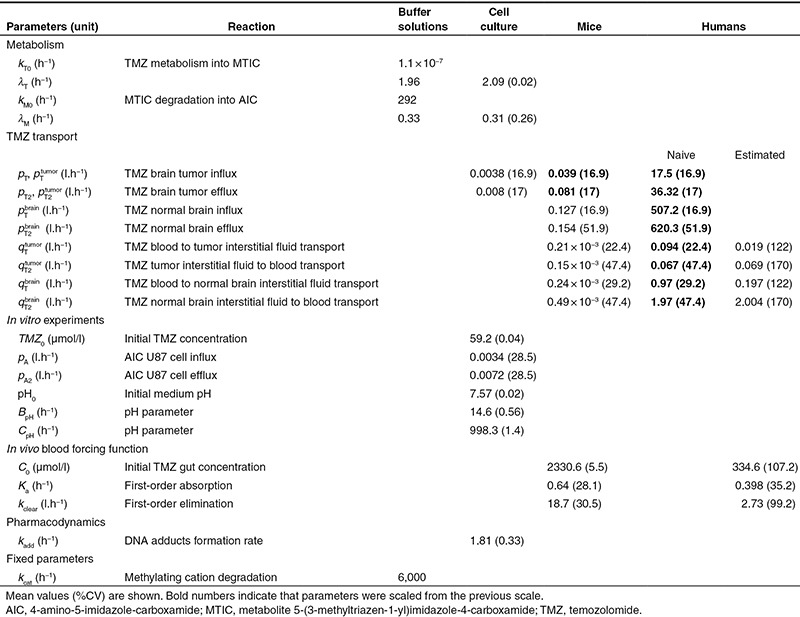
Figure 2.

TMZ pH-dependent conversion in buffer solutions. (a–d) TMZ, MTIC, and AIC concentration–time profiles in buffer solutions at indicated pH. Solid lines and dots correspond respectively to the best-fit profiles and data from ref. 15 of TMZ (black), MTIC (orange), and AIC (yellow). (e) Total methylating cation, defined as the sum of the cation C and all products of its degradation, with respect to buffer solution pH for different exposure duration. AIC, 4-amino-5-imidazole-carboxamide; MTIC, metabolite 5-(3-methyltriazen-1-yl)imidazole-4-carboxamide; TMZ, temozolomide.
For TMZ exposures ranging from 2 to 96 h, the percentage of activated TMZ-methylating cation had the form of an increasing steep S-shape function as pH increased, suggesting that a small pH variation may lead to a significant change in the TMZ activation rate (Figure 2e). Further, the model predicted that TMZ activation rate was close to zero at pH = 4 for any exposure duration and increased with pH values (Figure 2a–d). Interestingly, although the rate of MTIC fragmentation decreases with pH, the reaction does not prevent TMZ activation at high pH.
In vitro TMZ PK
The second step of the multiscale approach analyzed TMZ metabolism, membrane transport and simplified PD in U87 glioma cell culture. Two physiological compartments—extracellular and intracellular—were considered in which TMZ pH-dependent activation and MTIC subsequent degradation were represented by the above-described model (Figure 1b). Because TMZ is highly lipophilic and constitutes a poor substrate of ABC transporters,18 transport of the parent drug and AIC between the extracellular and intracellular compartments were modeled as passive diffusion. As MTIC displays limited ability to cross cell membranes and as the methyldiazonium cation is a highly reactive species, their transport between the two compartments were not considered.19 Concerning TMZ PD, the methyldiazonium cation is the sole species able to form DNA adducts.12
Since TMZ metabolism is highly pH dependent, we monitored the medium pH ( ) and found an initial increase followed by a return close to its initial value which was modeled as (Figure 3g):
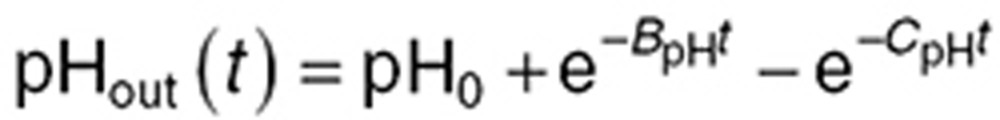 |
Figure 3.

TMZ PK in U87 cell culture. (a–f) TMZ, MTIC, and AIC extra- and intracellular concentration–time profiles. Dots represent experimental data (mean ± SD); solid lines are the mathematical model best fit. (g) Medium pH time evolution during TMZ exposure. Experimental data points are the mean and SD of three independent experiments. (h) DNA adducts concentration simulated by the trained model. AIC, 4-amino-5-imidazole-carboxamide; MTIC, metabolite 5-(3-methyltriazen-1-yl)imidazole-4-carboxamide; TMZ, temozolomide.
in which pH0 is the initial pH value, and BpH and CpH are two phenomenological parameters. Available experimental data in U87-cultured cells from20 allowed us to derive the following formula for the intracellular pH ( ) (see Supplementary Data):
  .
.
The final model (Figure 1b, equations in Supplementary Data) required 14 parameters to be determined: 4 parameters for TMZ pH-dependent metabolism (kT0, λT, kM0, λM), 4 transport rate constants (pT, pT2, pA, pA2), 3 pH parameters (pH0, BpH, CpH), the degradation rate of the cation kcat,1 PD parameter (kadd) and the initial TMZ extracellular concentration from the U87 cell studies (TMZ0). Parameters kcat, kT0, and kM0 were directly inferred from the buffer study whereas λT and λM were estimated for the in vitro system allowing a 50% deviation from the buffer solution values. The 11 remaining parameters were estimated by fitting TMZ, MTIC, and AIC extra- and intracellular concentration–time data and extracellular pH results in U87 cells together with available PD data from which it was estimated that an exposure of TMZ at 800 µmol/l during 1 h led to a DNA adduct concentration of 70 nmol/l in the absence of DNA repair mechanisms21 (see Supplementary Data).
Agreement between fitted profiles and observed values together with low %CV of parameter estimates support model validity (Figure 3; Table 1). TMZ exposure led to increasing concentrations of AIC. DNA adduct concentration was predicted to increase as no repair mechanisms were considered in this model.
TMZ brain disposition in mice
The next step consisted of designing a mechanistic PK model of TMZ in brain, based on two complementary investigations; a microdialysis study in normal mice, which provided serial measurements of TMZ plasma and normal brain interstitial fluid concentrations, and a steady-state investigation in which TMZ plasma, whole brain, and brain tumor concentrations were measured in mice bearing intracerebral U87 tumors.
Because we focused on TMZ brain disposition, its blood concentration  was accounted for by a forcing function (Figure 1c) chosen as the best-fit to the plasma measurements from the microdialysis mouse study assuming a blood:plasma TMZ concentration ratio of 122,23:
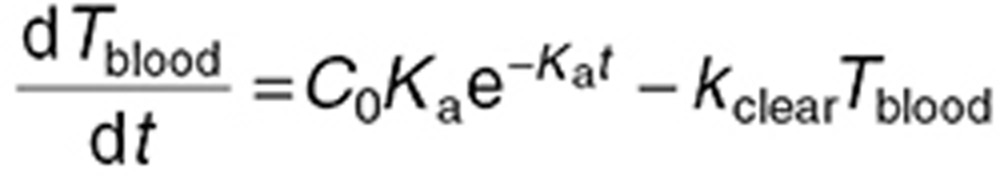 |
where C0, Ka, and kclear are the initial TMZ gut concentration, the first-order absorption rate constant, and the first-order elimination rate constant, respectively. C0 was computed for each individual mouse as the total administered dose divided by the gut volume, assumed equal to 1.7 ml,24 whereas Ka and kclear were estimated from plasma data (Table 1; Figure 4a).
Figure 4.

TMZ PK in mice. (a) TMZ blood concentration–time profile. Solid line is the forcing function best fit. Open circles are the measured TMZ plasma concentrations from the microdialysis study. (b–e) TMZ interstitial (b) and intracellular (c), intracellular methylating cation (d), and DNA adducts (e) concentration–time profiles in normal brain (solid line) and brain tumor (dashed lines). Open circles (b) are TMZ normal brain concentrations from the microdialysis study. (f) TMZ concentrations in the whole normal brain and brain tumor after steady-state dosing regimen. Open circles are the experimental results in brain tumor-bearing mice; black diamonds are the model best fit. PK, pharmacokinetics; TMZ, temozolomide.
The normal brain and brain tumor were assumed to be constituted of homogeneous normal and U87 glioma cell populations, respectively, and were represented by physiologically based PK models, which consisted of interstitial and intracellular compartments of volume  ,
,  ,
,  and
and  (Figure 4a). Utilizing the model designed in the buffer solution study, TMZ pH-dependent metabolism into MTIC was represented in all brain compartments, whereas MTIC and the methylating agent—which were assumed unable to diffuse from one compartment to another—were only explicitly modeled in the intracellular compartments in which the methylating cation creates DNA adducts at the rate kadd. The metabolic parameters kcat, kT0, λT, kM0, λM and the PD rate kadd were directly inferred from the U87 cell study. pH values were assumed identical in the normal brain and tumor region, as experimentally demonstrated in humans25, and were set to 7.2 in the intracellular compartment, 7.3 in the interstitial fluid, and 7.4 in the blood.24,26
The tumor cell membrane transport parameters  and
and  were computed by scaling the in vitro parameters
  and
and  using the following formulas, which suppose that the contact surface between the cells and the extracellular medium was proportional to the total cell volume:
 |
 |
in which  is the in vitro intracellular volume, and
  the tumor intracellular volume computed as a fraction of the total tumor volume:
  .
.
The six remaining parameters  ,
,  ,
,  ,
,  ,
,  were estimated by utilizing the microdialysis and steady-state mouse studies. Since these datasets were not sufficient to ensure unique parameter estimates, two constraints were added assuming that drug transport from interstitial fluid to intracellular medium, and from interstitial fluid to blood, were equivalent in the brain tumor and normal brain such that:
 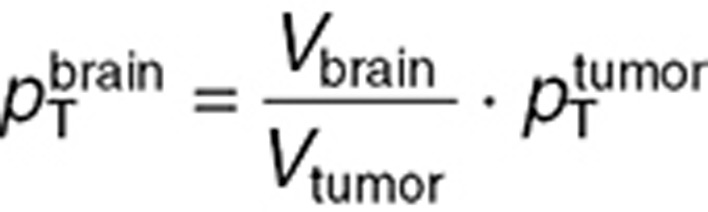 and
and 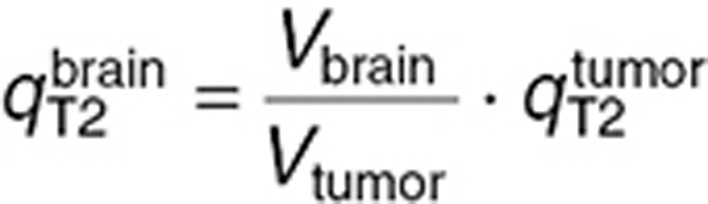 .
.
While TMZ microdialysis normal brain interstitial fluid measurements were directly compared to the corresponding model variable, whole normal brain and brain tumor TMZ concentrations did not explicitly appear in the model and were computed as follows. We assumed that the normal brain and tumor were exclusively constituted of blood, interstitial fluid, and intracellular components with respective volume fractions  ,
,  , and
, and  set to 2, 20, and 78% for the normal brain and 5, 30, and 65% for the tumor.27,28,29 TMZ concentrations in the whole normal brain or tumor can then be computed as (omitting superscripts for normal brain and tumor):
  . During steady-state administration, TMZ concentrations in brain compartments rapidly reached quasi-steady state, as suggested by the data and adjoining simulations, and were computed as:
  with
with 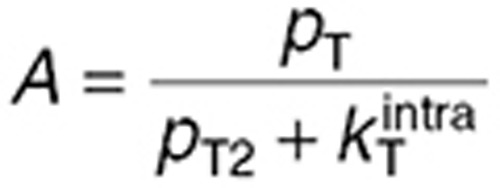 and
and 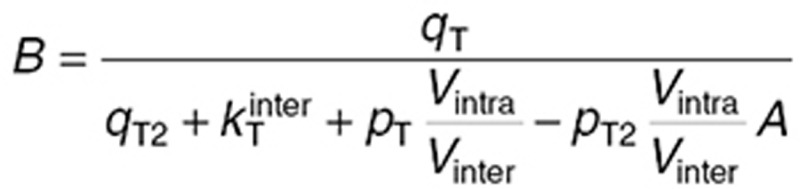 where
where  was set to the steady-state plasma measurement in each mouse. Volumes Vinter and Vintra were computed for the normal brain and the tumor as
  and
and  , the whole normal brain volume being set to 360 μl,24 and the tumor volume to 111.5 µl, its mean value in the steady-state study. Then, TMZ steady-state total concentration was computed as:
  .
.
The parameter estimation procedure consisted of two independent steps leading to the estimation of, first,  ,
,  , and
, and  and secondly
  (Table 1). Normal brain parameters were estimated by combining TMZ whole normal brain and brain microdialysis measurements as follows. Since the steady-state and microdialysis studies were performed in 7 and 10 mice respectively, a parameter set was estimated for each of the 70 possible pairs composed of one individual of each study, by fitting the individual steady-state normal brain and plasma TMZ concentrations together with the individual normal brain interstitial TMZ concentrations, setting the blood forcing function parameters to their values estimated for the corresponding mouse of the microdialysis investigation. The resultant 70 parameter sets were then used to calculate the mean and %CV of each parameter. Finally,
  was independently estimated by fitting individual steady-state plasma and whole tumor concentrations, and computing the mean and %CV of individual parameters. The model best fit and experimental data agreed (Figure 4).
Both in the normal brain and tumor, transport parameters between interstitial and intracellular compartments were three orders of magnitude greater than the ones between blood and interstitial fluid (Table 1). Intracellular transport was faster in the normal brain than in the tumor, however parameter ratios  and
and  were in the same range.
  was 2.5-fold lower than
  which was consistent with BBB disruption in the tumor often reported in the literature.30 As a consequence, best-fit TMZ interstitial and intracellular concentrations were nearly equivalent in the normal brain with an area under the curve (AUC) ratio of 1.2, whereas, in the tumor, TMZ interstitial concentration was greater than the intracellular concentration as reflected by an AUC ratio equal to 2.08. Finally, the TMZ intracellular AUC was 1.7-fold greater in the brain tumor than in the normal brain which led to a 1.8-fold higher final DNA adduct concentration (Figure 4).
TMZ PK in brain tumor patients
The final step of our multiscale approach was directed at predicting TMZ brain disposition in brain tumor patients. For the human study, the structure of the mouse model was kept identical and parameters were adapted as follows. First, the blood forcing function parameters were determined from mean and standard deviation values of TMZ plasma concentrations available in seven brain tumor patients after a single oral dose of 150 mg/m2.31 Parameters of TMZ metabolism (kcat, kT0, λT, kM0, and λM) and PD (kadd), as well as pH values and brain and tumor volume fractions were inferred from the mouse study. Volumes of whole normal brain and brain tumor were set to 1.45 l24 and 0.05 l,32 respectively. Cell membrane transport parameters were scaled up from mice to humans by assuming that the contact surface between interstitial and intracellular mediums was proportional to the cell volume such that:
 |
where p stands for  ,
,  ,
,  , or
, or  , and
, and  for the normal brain or tumor intracellular volume.
Transport parameters from blood to interstitial fluid were either directly scaled up from the mouse study—referred to as the naive estimation—or estimated using TMZ normal brain concentrations measured by intracerebral microdialysis in the same seven patients from whom plasma measurements were available.31 For the naive parameter scale-up, the following formula was used, which assumes that the contact surface between the blood and the interstitial fluid was proportional to the volume of the blood vessels:
 |
where q stands for  ,
,  , or
, or  and
and  for the volume of the blood compartment in the normal brain or tumor. For the parameter estimation based on human data,
  and
and  were computed by fitting the model to the brain microdialysis TMZ concentrations from patients. Tumor parameters were subsequently deduced by assuming, that
  as in the mouse study and that the ratio between brain and tumor BBB permeability was identical in mice and in humans:
 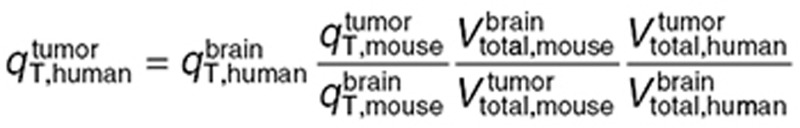 (Table 1).
Naive scale-up overestimated TMZ concentrations in the normal brain and tumor as AUC values of best-fit TMZ interstitial and intracellular concentrations were on average 5.1-fold greater than the ones of the human data-fitted model (Figure 5a–e). Concerning the human data-fitted model, the ratio  was 2.8-fold lower than
  which suggested a disruption of the BBB in the tumor region as in the mouse study. Interestingly, the ratios between TMZ interstitial and intracellular AUC were the same in the preclinical and human data-fitted simulations. As a consequence of having inferred from the mouse study the ratios between brain and tumor transport parameters, TMZ intracellular AUC ratio between brain and tumor was close to the preclinical one as it was equal to 1.7, leading to a 1.7-fold higher final DNA adduct concentration in the tumor compared to the normal brain (Figure 5). The %CV of parameters were relatively high due to the inherent variability of the clinical data that was utilized for parameter estimation (Figure 5a,b; Table 1). Next, we performed a global sensitivity analysis to determine the important parameter regarding the efficacy of TMZ computed as the AUC of DNA adduct concentration in the tumor. The parameter
  which corresponds to the BBB had the highest influence followed by kclear, TMZ clearance rate in the plasma (Figure 5f).
Figure 5.

TMZ PK in brain tumor patients. (a) TMZ blood concentration–time profile. Solid line is the forcing function best fit. Open circles are TMZ plasma concentration measurements in patients.31 (b–e) TMZ interstitial (b) and intracellular (c) concentration–time profiles in the normal brain (solid lines) and brain tumor (dashed lines). Blue color corresponds to the model calibrated with naive parameters, whereas black color represents the best-fit model with estimated parameters. In (b), open diamonds are TMZ normal brain concentrations from microdialysis measurements in patients,31 which are shown in greater details in the inset, together with TMZ normal brain interstitial concentration best-fit profile. (f) Global analysis of parameter sensitivity on drug efficacy in brain tumor (see Results and Methods). PK, pharmacokinetics; TMZ, temozolomide.
Discussion
In this study, we undertook a multiscale approach to quantitatively characterize TMZ brain disposition in patients. Physiologically based mechanistic models were used to describe at the molecular scale the biochemical events determining TMZ PK. The main challenge of this type of modeling lays in the estimation of the model parameters which may not be directly measurable from clinical investigations. However, since those parameters do have a physical meaning and correspond to biochemical reactions, one may evaluate them independently in in vitro and in vivo studies and subsequently scale them to patients (Figure 6). Once population parameters are determined for humans, the model can be partially reparameterized for a specific patient allowing the design of personalized drug combinations and administration scheme.
Figure 6.

A multiscale approach to design cell-type–specific PK-PD models for personalized medicine. The in vitro study is based on experimental drug investigations in solutions and in cell culture, which allow the design and calibration of a mathematical model describing the extracellular and intracellular drug PK-PD. Next, for the preclinical scale, the model of the interstitial and intracellular compartments is directly inferred from the in vitro study and parameters are either kept identical, scaled, or estimated utilizing whole animal or tissue-based investigations that in our case included two separate studies: normal brain microdialysis and brain tumor orthotopic studies. This step allows the design and calibration of a whole-body or tissue model that designate specific tissues and cells of interest. For humans, the whole-body model or specific tissue structure remains and parameters are either kept identical, scaled from the preclinical study, or estimated from clinical data in order to compute an average population parameter set. Finally, the human model is partially re-parameterized from available data on the individual patient and utilized in optimization procedures, which provide personalized drug combinations and administration schemes. PD, pharmacodynamics; PK, pharmacokinetics.
To arrive at the final TMZ brain disposition model, a pipeline of in vitro and in vivo investigations were needed that consisted of four main scales; in vitro aqueous solution and U87 glioma cell studies to characterize membrane transport and metabolism, in vivo mouse studies that allowed designing and calibrating the brain disposition model, and finally the clinical investigation for which the mouse model structure was maintained yet revised by parameter estimation. At each step, the fitted models closely agreed with the observed data and yielded reliable parameter estimates (low %CV) which supports the use of this multiscale strategy. It should be appreciated that the sole use of either the microdialysis or steady-state mouse studies would not have provided reliable parameter values, and without the in vitro studies, TMZ membrane transport and metabolism would not have been accurately estimated.
The current TMZ brain disposition model, whose tumor intracellular compartment represents a homogenous population of glioma cells, can be extended by considering several intracellular compartments within the tumor, thus representing different cell types, that may have important roles in tumor progression, therapeutic targets, and drug resistance.8 Further, models of organs of toxicity, again with subpopulations of cells of different susceptibilities, could be used in conjunction with the cell-type–specific tumor models to refine drug treatment regimens. This can readily be appreciated for TMZ whose main dose-limiting toxicity of myelosuppression could be considered by adding to the model bone marrow compartments representing hematopoietic stem and progenitor cells. A hypothetical representation of such model is provided in Figure 1d in which the blood and interstitial fluid compartments drive the dynamics of different intracellular compartments; highlighted in tumor and bone marrow. This type of intracellular PK-PD models including both target and toxicity organs provides a quantitative tool to evaluate therapeutic indices in a mechanistic manner.
It is appreciated that deriving a multiple cell-type model will require in vitro investigations—as done here for glioma cells—to delineate PK-PD behavior in cell types of interest. Apart from the direct use of in vitro cell studies, isolation of different cell fractions from ex vivo samples may be afforded by cell sorting.33 While drug concentrations may be altered by cell sorting procedures, certain PK-PD features especially slowly reversible or irreversible endpoints such as apoptosis, may not be unduly altered. Sorting untreated xenograft tumors into specific cell fractions provides an alternate means to initiate in vitro PK-PD studies, and when coupled to brain microdialysis and whole tissue studies as done here provide the means to obtain cell-type–specific models. Approaches to dissect bone marrow into hematopoietic stem and progenitor cells could include collection of bone marrow from mice or collection of ex vivo patient samples that can be cultured for further drug studies.34,35 Thus, the development of cell-type–specific PK-PD models is feasible and likely to benefit from further technical innovations to enable multiscale strategies.
Personalized medicine and inherent tumor heterogeneity provide strong motivation to pursue the development of cell-type–specific intracellular PK-PD models. The proposed pipeline of investigation is offered here as an essential first step to achieve this goal that should contribute to understanding drug action among heterogeneous cell types.
Methods
In vitro cellular PK studies of TMZ
U87 human glioma cells (ATCC, Manassas, VA) were cultured in Dulbecco's modified Eagle's medium supplemented with 10% fetal bovine serum, 100 units/ml penicillin, and 100 units/ml streptomycin and maintained in a humidified atmosphere of 5% CO2 in air at 37 °C. For PK experiments, 106 cells were seeded onto 60 mm Petri dishes, cultured overnight and TMZ (50 µmol/l) added, and the dishes sampled for 2 h. At each time, dishes were placed on ice instantly, and 1 ml of medium was collected and kept on ice while the reminder of the medium was aspirated. The cells were washed twice with 1 ml of cold phosphate-buffered saline, scraped in 200 µl of cold MeOH and kept on ice. For the detection of TMZ which is stable at pH < 4, 10 µl of medium was transferred into 300 µl of acid internal standard solution (0.1 µg/ml dacarbazine and 0.1% formic acid in MeOH) and 90 µl of MeOH. Another 10 µl of medium was transferred into 300 µl of internal standard solution without formic acid and 90 µl of MeOH for MTIC and AIC detection which are more stable at alkaline pH. The cells were sonicated (6 s, three times) and 20 µl of cell lysate were added to 60 µl of internal standard solution with or without formic acid as for medium samples and kept on dry ice. For pH measurements, cells were incubated with TMZ (50 µmol/l) and the medium pH was instantly measured. All medium and cell lysate samples for TMZ, MTIC, and AIC were analyzed on the same day by high-performance liquid chromatography–tandem mass spectrometry (LC/MS/MS) using the multiple reaction monitoring mode specific to each analyte and the internal standard. The LC/MS/MS system (described in Supplementary Tables S1-S3 online) was optimized for each compound in positive ionization mode. The analytical methods were specific and sensitive with a lower limit of quantification of 0.01 µmol/l. The intraday and interday variabilities were less than 15% in all matrixes. The average run time was ~5 min. Raw mass spectrometry measurements were normalized to 1 million of cells (see Supplementary Data).
Microdialysis experiments in nude mice
Four days before mice entered the PK study, a normal brain microdialysis guide cannula was implanted similar to that previously described for rats.32 One day before the PK sampling, a catheter was inserted into the right carotid artery of each mouse under isoflurane anesthesia for blood sampling. On the day of and prior to TMZ administration, the dummy cannulas were replaced by microdialysis probes (MRB-1–5; Bioanalytical Systems, West Lafayetter, IN) and the probe TMZ recovery values were determined using the retrodialysis method as described previously with minor modifications.32 The flow rate was maintained at 1 µl/min during the washout and microdialysate fractions were automatically collected into individual 250-µl plastic vials containing 5 µl of 0.1% formic acid every 20 min with a CMA/170 refrigerated fraction collector. The percent relative recovery of TMZ from the normal brain was 8.1 ± 1.0%. Animals were given a single oral dose of 20 mg/kg of TMZ with blood samples (15 µl) collected over 6 h. Plasma was separated by centrifugation and stored at −80 °C until analysis. TMZ concentrations in plasma and normal brain microdialysate samples were determined using a validated reversed-phase high-performance liquid chromatography method with ultraviolet detection.36
Steady-state experiments in nude mice
A previously described orthotopic mouse model of human glioma was used with minor modifications.37 Briefly, anesthetized NIH-Swiss nude mice (nu/nu) were secured in a stereotaxic instrument, and a 1.5 cm longitudinal incision was made to expose the skull. Using a sterile 10-μl Hamilton syringe with a 26-gauge needle attached to the stereotaxic frame, U87MG cells (1 × 10⁶) in 10 μl of saline were injected 2.5 mm deep into the left caudate putamen over a 5-min period. The skin was sutured to close the wound. After surgery, animals were returned to their cages and received a regular diet and water ad libitum.
Twenty-four days after tumor cell implantation, tumor-bearing mice were prepared for aseptic surgery to introduce a right carotid artery cannula for intraarterial infusion of TMZ (dissolved in 0.9% NaCl containing 25% dimethyl sulfoxide) administered the next day over 180 min at a rate of 133.3 μg/kg/min preceded by a tail veil injection of 7.6 mg/kg of TMZ; both designed to achieve steady-state plasma concentration of ~17 μg/ml.37 At the end of the infusion, mice were anesthetized and blood samples were taken from the vena cava. Plasma was prepared by centrifugation of the heparinized blood and stored at −80 °C. After the animals were sacrificed, normal brain tissues and brain tumors were immediately excised, snap frozen on dry ice and stored at −80 °C. TMZ concentrations in plasma, normal brain, and brain tumor homogenates were determined using a validated reversed-phase high-performance liquid chromatography method with ultraviolet detection.36
Model development, parameter estimation, and sensitivity analysis
TMZ PK models are based on ordinary differential equations, which were solved by the Matlab function odes15 (Mathworks, Natick, MA). Chemical reactions were modeled by the law of mass action and passive drug transport by Fick's first law of diffusion.38,39 Parameter estimation was performed using a weighted least square approach in which the cost function was minimized by the Covariance Matrix Adaptation Evolution Strategy algorithm.40,41 For the U87 and patient studies, Monte Carlo simulations were utilized to compute parameter estimates and %CV (see Supplementary Data).
For the global sensitivity analysis of the human model, all parameters' lower and upper bounds were set to 100-fold lesser and greater than their estimated values and 18,000 parameter sets were generated from cross-sampling by Saltelli's extension of Sobol's method using the MOEA framework (version 2.0).42 For each parameter set, the AUC of DNA adduct concentration in the tumor during the 18 h following an oral dose of TMZ of 150 mg/m2 was calculated using Matlab. Finally, parameters' total-order sensitivity indices and their confidence intervals were computed using the Sobol analysis of the MOEA framework.
Author Contributions
A.B. and J.M.G. wrote the manuscript. A.B., Q.Z., and J.M.G. designed the research. A.B., Q.Z., X.Z., and H.Lv. performed the research. A.B., Q.Z., X.Z., H.Lv, and J.M.G. analyzed the data. A.B., Q.Z., and J.M.G. contributed new reagents/analytical tools.
Conflict of Interest
The authors declared no conflict of interest.
Study Highlights
Acknowledgments
Partial support for this study was provided by the NIH/NCI grant CA072937.
Supplementary Material
References
- Simon R., Roychowdhury S. Implementing personalized cancer genomics in clinical trials. Nat. Rev. Drug Discov. 2013;12:358–369. doi: 10.1038/nrd3979. [DOI] [PubMed] [Google Scholar]
- Dienstmann R., Rodon J., Tabernero J. Biomarker-driven patient selection for early clinical trials. Curr. Opin. Oncol. 2013;25:305–312. doi: 10.1097/CCO.0b013e32835ff3cb. [DOI] [PubMed] [Google Scholar]
- Weller M., Stupp R., Hegi M., Wick W. Individualized targeted therapy for glioblastoma: fact or fiction. Cancer J. 2012;18:40–44. doi: 10.1097/PPO.0b013e318243f6c9. [DOI] [PubMed] [Google Scholar]
- Iyengar R., Zhao S., Chung S.W., Mager D.E., Gallo J.M. Merging systems biology with pharmacodynamics. Sci. Transl. Med. 2012;4:126ps7. doi: 10.1126/scitranslmed.3003563. [DOI] [PMC free article] [PubMed] [Google Scholar]
- Ballesta A., Clairambault J. Physiologically based mathematical models to optimize therapies against metastatic colorectal cancer: a mini-review. Curr. Pharm. Des. 2014;20:37–48. doi: 10.2174/138161282001140113123441. [DOI] [PubMed] [Google Scholar]
- Steimer J.L., et al. Modelling the genesis and treatment of cancer: the potential role of physiologically based pharmacodynamics. Eur. J. Cancer. 2010;46:21–32. doi: 10.1016/j.ejca.2009.10.011. [DOI] [PubMed] [Google Scholar]
- Zhang X.Y., Birtwistle M.R., Gallo J.M. A general network pharmacodynamic model-based design pipeline for customized cancer therapy applied to the VEGFR pathway. CPT Pharmacometrics Syst. Pharmacol. 2014;3:e92. doi: 10.1038/psp.2013.65. [DOI] [PMC free article] [PubMed] [Google Scholar]
- Fisher R., Pusztai L., Swanton C. Cancer heterogeneity: implications for targeted therapeutics. Br. J. Cancer. 2013;108:479–485. doi: 10.1038/bjc.2012.581. [DOI] [PMC free article] [PubMed] [Google Scholar]
- Orkin S.H., Zon L.I. Hematopoiesis: an evolving paradigm for stem cell biology. Cell. 2008;132:631–644. doi: 10.1016/j.cell.2008.01.025. [DOI] [PMC free article] [PubMed] [Google Scholar]
- Schneider T., Mawrin C., Scherlach C., Skalej M., Firsching R.Gliomas in adults Dtsch. Arztebl. Int 107799–807.quiz 808 (2010 [DOI] [PMC free article] [PubMed] [Google Scholar]
- Shirai K., Chakravarti A. Towards personalized therapy for patients with glioblastoma. Expert Rev. Anticancer Ther. 2011;11:1935–1944. doi: 10.1586/era.11.103. [DOI] [PMC free article] [PubMed] [Google Scholar]
- Denny B.J., Wheelhouse R.T., Stevens M.F., Tsang L.L., Slack J.A. NMR and molecular modeling investigation of the mechanism of activation of the antitumor drug temozolomide and its interaction with DNA. Biochemistry. 1994;33:9045–9051. doi: 10.1021/bi00197a003. [DOI] [PubMed] [Google Scholar]
- Nagasawa D.T., Chow F., Yew A., Kim W., Cremer N., Yang I. Temozolomide and other potential agents for the treatment of glioblastoma multiforme. Neurosurg. Clin. N. Am. 2012;23:307–22, ix. doi: 10.1016/j.nec.2012.01.007. [DOI] [PubMed] [Google Scholar]
- Villano J.L., Seery T.E., Bressler L.R. Temozolomide in malignant gliomas: current use and future targets. Cancer Chemother. Pharmacol. 2009;64:647–655. doi: 10.1007/s00280-009-1050-5. [DOI] [PubMed] [Google Scholar]
- Andrasi M., Bustos R., Gaspar A., Gomez F.A., Klekner A. Analysis and stability study of temozolomide using capillary electrophoresis. J. Chromatogr. B. Analyt. Technol. Biomed. Life Sci. 2010;878:1801–1808. doi: 10.1016/j.jchromb.2010.05.008. [DOI] [PubMed] [Google Scholar]
- Pommier Y. Topoisomerase I inhibitors: camptothecins and beyond. Nat. Rev. Cancer. 2006;6:789–802. doi: 10.1038/nrc1977. [DOI] [PubMed] [Google Scholar]
- Thurston, D.E. Chemistry and pharmacology of anticancer drugs. 2006.
- Peigñan L., et al. Combined use of anticancer drugs and an inhibitor of multiple drug resistance-associated protein-1 increases sensitivity and decreases survival of glioblastoma multiforme cells in vitro. Neurochem. Res. 2011;36:1397–1406. doi: 10.1007/s11064-011-0464-8. [DOI] [PubMed] [Google Scholar]
- Newlands E.S., Stevens M.F., Wedge S.R., Wheelhouse R.T., Brock C. Temozolomide: a review of its discovery, chemical properties, pre-clinical development and clinical trials. Cancer Treat. Rev. 1997;23:35–61. doi: 10.1016/s0305-7372(97)90019-0. [DOI] [PubMed] [Google Scholar]
- Hegde M., Roscoe J., Cala P., Gorin F. Amiloride kills malignant glioma cells independent of its inhibition of the sodium-hydrogen exchanger. J. Pharmacol. Exp. Ther. 2004;310:67–74. doi: 10.1124/jpet.103.065029. [DOI] [PubMed] [Google Scholar]
- Taverna P., Catapano C.V., Citti L., Bonfanti M., D'Incalci M. Influence of O6-methylguanine on DNA damage and cytotoxicity of temozolomide in L1210 mouse leukemia sensitive and resistant to chloroethylnitrosoureas. Anticancer. Drugs. 1992;3:401–405. doi: 10.1097/00001813-199208000-00014. [DOI] [PubMed] [Google Scholar]
- Fridén M., Gupta A., Antonsson M., Bredberg U., Hammarlund-Udenaes M. In vitro methods for estimating unbound drug concentrations in the brain interstitial and intracellular fluids. Drug Metab. Dispos. 2007;35:1711–1719. doi: 10.1124/dmd.107.015222. [DOI] [PubMed] [Google Scholar]
- Baker S.D., et al. Absorption, metabolism, and excretion of 14C-temozolomide following oral administration to patients with advanced cancer. Clin. Cancer Res. 1999;5:309–317. [PubMed] [Google Scholar]
- Davies B., Morris T. Physiological parameters in laboratory animals and humans. Pharm. Res. 1993;10:1093–1095. doi: 10.1023/a:1018943613122. [DOI] [PubMed] [Google Scholar]
- Rottenberg D.A., Ginos J.Z., Kearfott K.J., Junck L., Dhawan V., Jarden J.O. In vivo measurement of brain tumor pH using [11C]DMO and positron emission tomography. Ann. Neurol. 1985;17:70–79. doi: 10.1002/ana.410170116. [DOI] [PubMed] [Google Scholar]
- McConnell E.L., Basit A.W., Murdan S. Measurements of rat and mouse gastrointestinal pH, fluid and lymphoid tissue, and implications for in-vivo experiments. J. Pharm. Pharmacol. 2008;60:63–70. doi: 10.1211/jpp.60.1.0008. [DOI] [PubMed] [Google Scholar]
- Kim Y.R., Rebro K.J., Schmainda K.M. Water exchange and inflow affect the accuracy of T1-GRE blood volume measurements: implications for the evaluation of tumor angiogenesis. Magn. Reson. Med. 2002;47:1110–1120. doi: 10.1002/mrm.10175. [DOI] [PubMed] [Google Scholar]
- Xu F.J., He Q.Y., Han H.B. Measurement of brain extracellular space and its physiological and pathophysiological significance. Beijing Da Xue Xue Bao. 2010;42:234–237. [PubMed] [Google Scholar]
- Kim Y.R., Savellano M.D., Savellano D.H., Weissleder R., Bogdanov A., Jr Measurement of tumor interstitial volume fraction: method and implication for drug delivery. Magn. Reson. Med. 2004;52:485–494. doi: 10.1002/mrm.20182. [DOI] [PubMed] [Google Scholar]
- Zhan C., Lu W. The blood-brain/tumor barriers: challenges and chances for malignant gliomas targeted drug delivery. Curr. Pharm. Biotechnol. 2012;13:2380–2387. doi: 10.2174/138920112803341798. [DOI] [PubMed] [Google Scholar]
- Portnow J., Badie B., Chen M., Liu A., Blanchard S., Synold T.W. The neuropharmacokinetics of temozolomide in patients with resectable brain tumors: potential implications for the current approach to chemoradiation. Clin. Cancer Res. 2009;15:7092–7098. doi: 10.1158/1078-0432.CCR-09-1349. [DOI] [PMC free article] [PubMed] [Google Scholar]
- Zhou Q., Guo P., Kruh G.D., Vicini P., Wang X., Gallo J.M. Predicting human tumor drug concentrations from a preclinical pharmacokinetic model of temozolomide brain disposition. Clin. Cancer Res. 2007;13:4271–4279. doi: 10.1158/1078-0432.CCR-07-0658. [DOI] [PubMed] [Google Scholar]
- Barteneva N.S., Ketman K., Fasler-Kan E., Potashnikova D., Vorobjev I.A. Cell sorting in cancer research–diminishing degree of cell heterogeneity. Biochim. Biophys. Acta. 2013;1836:105–122. doi: 10.1016/j.bbcan.2013.02.004. [DOI] [PubMed] [Google Scholar]
- Bonig H., Papayannopoulou T. Hematopoietic stem cell mobilization: updated conceptual renditions. Leukemia. 2013;27:24–31. doi: 10.1038/leu.2012.254. [DOI] [PMC free article] [PubMed] [Google Scholar]
- Nishino T., Osawa M., Iwama A. New approaches to expand hematopoietic stem and progenitor cells. Expert Opin. Biol. Ther. 2012;12:743–756. doi: 10.1517/14712598.2012.681372. [DOI] [PubMed] [Google Scholar]
- Ma J., Li S., Reed K., Guo P., Gallo J.M. Pharmacodynamic-mediated effects of the angiogenesis inhibitor SU5416 on the tumor disposition of temozolomide in subcutaneous and intracerebral glioma xenograft models. J. Pharmacol. Exp. Ther. 2003;305:833–839. doi: 10.1124/jpet.102.048587. [DOI] [PubMed] [Google Scholar]
- Zhou Q., Gallo J.M. Differential effect of sunitinib on the distribution of temozolomide in an orthotopic glioma model. Neuro. Oncol. 2009;11:301–310. doi: 10.1215/15228517-2008-088. [DOI] [PMC free article] [PubMed] [Google Scholar]
- Keener JP, Sneyd J. Springer-Verlag Gmbh; New York, NY; 1998. Mathematical physiology. [Google Scholar]
- Bassingthwaighte JB. Physiology. HandBook of Physiology; Bethesda, MD; 1984. Modeling in the analysis ofsolute and water exchange in the microvasculature. [Google Scholar]
- Hansen N.The CMA evolution strategy: a comparing review. Towards a New Evolutionary Computation Advances in Estimation of Distribution Algorithmseds. Lozano, PL, Inza, I, Bengoetxea, E) 75–102.Springer–Verlag; Berlin, Heidelburg; 2006 [Google Scholar]
- Ballesta A., et al. A combined experimental and mathematical approach for molecular-based optimization of irinotecan circadian delivery. PLoS Comput. Biol. 2011;7:e1002143. doi: 10.1371/journal.pcbi.1002143. [DOI] [PMC free article] [PubMed] [Google Scholar]
- Saltelli A., et al. Wiley; Chichester, England; 2008. Global sensitivity analysis: the primer. [Google Scholar]
Associated Data
This section collects any data citations, data availability statements, or supplementary materials included in this article.