

Summary
Dendritic cell (DC) activation is essential for the induction of immune defense against pathogens, yet needs to be tightly controlled to avoid chronic inflammation and exaggerated immune responses. Here, we identify a mechanism of immune homeostasis by which adaptive immunity, once triggered, tempers DC activation and prevents overreactive immune responses. T cells, once activated, produce Protein S (Pros1) that signals through the TAM receptor tyrosine kinases in DCs to limit the magnitude of DC activation. Genetic ablation of Pros1 in mouse T cells leads to increased expression of co-stimulatory molecules and cytokines in DCs, enhanced immune responses to T cell-dependent antigens, as well as increased colitis. Additionally, PROS1 is expressed in activated human T cells and its ability to regulate DC activation is conserved. Our results identify a heretofore unrecognized, homeostatic negative feedback mechanism at the interface of adaptive and innate immunity that maintains the physiological magnitude of the immune response.
Introduction
The innate immune response functions as both the first line of defense against pathogens and also as the initiating trigger for adaptive immunity (Iwasaki and Medzhitov, 2010; Janeway, 1989; Medzhitov et al., 1997). Activation of DCs, the professional antigen presenting cells, drives T cell activation. These essential functions notwithstanding, the magnitude of DC activation must be precisely controlled. Unrestrained, overactive DC responses can lead to pathological conditions characterized by over-reactive immune responses such as allergy, autoimmunity and chronic inflammatory diseases (Coombes and Powrie, 2008; Lambrecht and Hammad, 2010). A priori, the induction of T cell activation must be coupled to a homeostatic negative feedback mechanism that limits the function of DCs. Such a mechanism would still allow T cell activation and initiation of adaptive immunity by DCs, yet enable T cells, once activated, to signal back to DCs and restrain further stimulation of the immune response.
Receptor tyrosine kinases (RTKs) of the TAM family, Axl and Mer, are pleiotropic negative regulators of Toll-like receptor (TLR) and cytokine receptor signaling in DCs (Rothlin et al., 2007). Two ligands for the TAM receptors, Pros1 and Gas6, have been identified by in vitro approaches (Stitt et al., 1995). While the source of the ligands that activate TAM receptors in DCs in vivo is unknown, T cell-dependent activation of TAM receptors would allow for an inflammatory response in DCs upon initial pathogen encounter, followed by downregulation of this response once antigen presentation and T cell activation have occurred. Therefore, we considered the possibility that T cells might be an important source of TAM ligands. Here, we show that Pros1 is expressed by mouse and human activated T cells and inhibits DC function. Although Pros1 is well known to function as an essential anticoagulant where its action is TAM-independent (Burstyn-Cohen et al., 2009; Dahlback, 2007), we reveal a novel anti-inflammatory function of T cell-derived Pros1 as the in vivo TAM ligand. Our results also reveal that this T cell-derived Pros1-DC TAM signaling axis is an indispensable, evolutionarily conserved, homeostatic feedback mechanism by which adaptive immunity controls the magnitude of the innate immune response.
Results
Activated T cells express Pros1
To test the hypothesis that activated T cells constitute a relevant immunological source of Pros1, we first measured Pros1 expression upon antigen presentation in vitro. Activation of OT-II transgenic CD4+ T cells upon incubation with bone marrow (BM)-DCs in the presence of ovalbumin (OVA) in vitro led to the detection of Pros1 on activated T cells (Figure 1A). Next, we generated a mouse where Pros1 expression was genetically ablated specifically in T cells. Mice homozygous for ‘floxed’ Pros1 alleles (Burstyn-Cohen et al., 2009) were crossed with mice expressing CRE recombinase under the control of the CD4 promoter. While complete Pros1 knock out (KO) mice die in utero due to fulminant coagulopathy (Burstyn-Cohen et al., 2009; Saller et al., 2009), Pros1flox/floxCd4-Cre+ mice were viable. T cells do not significantly contribute to the physiological levels of Pros1 in plasma, as the levels of Pros1 in the plasma of control and Pros1flox/floxCd4-Cre+mice were comparable (Figure S1). Furthermore, no overt defects in thymic development or on activation of splenic T cells were detected in Pros1flox/floxCd4-Cre+ mice at 2–4 months of age (Figure S1). To directly test if activated, antigen-specific T cells express Pros1 in vivo, we crossed Pros1flox/floxCd4-Cre+ to OT-II transgenic mice. Next, we transferred control and Pros1 KO OT-II CD45.2+ CD4+ T cells into CD45.1+ recipient mice and immunized them with OVA-LPS-IFA in their footpads (Figure 1B). Pros1 expression was detected in activated antigen-specific T cells in vivo (Figure 1B). Finally, direct activation of isolated murine splenic CD4+ T cells via anti-CD3 and anti-CD28 stimulation led to the up-regulation of Pros1 mRNA (Figure 1C) and protein (Figure 1D). Consistent with the genetic ablation of Pros1 in T cells, this up-regulation was undetectable in in vitro activated T cells from Pros1flox/floxCd4-Cre+ mice (Figure S1). Resting CD4+ T cells did not express Pros1 (Figure 1D). Similar results were obtained using T cells from Pros1flox/floxLck-Cre+ mice. Neither resting nor activated T cells expressed Gas6 (data not shown).
Figure 1. Activated T cells express Pros1.

(A) Splenic CD4+ T cells from OT-II mice were co-cultured with BM-DC alone or in the presence of 200 μg/mL OVA for 24 h. Pros1 induction was analyzed after antigen-specific activation of CD4+ T cell (CD4+CD69+). Representative FACS plots (left) and MFI for Pros1 expression on CD4+ T cells (right) are shown. (B) CD45.2 T cells from indicated genotypes were transferred into CD45.1 recipients and 1 day after transfer recipient mice were injected into the rear footpad with 50 μg of OVA/IFA/LPS. Popliteal and inguinal LNs were collected 48 h after immunization. Representative plots show CD45.2 transferred T cells and Pros1 expression in Ctrl OT-II T cells compared with Pros1 KO OT-II T cells. (C) Splenic CD4+ cells were isolated and activated in vitro with anti-CD3/CD28. Pros1 mRNA expression was determined by qPCR and normalized to unstimulated cells. (D) Representative FACS histograms of Pros1 expression on resting and activated CD4+ T cells with anti-CD3/CD28 for 15 h. Gray histogram represents activated CD4+ cells from Pros1flox/flox Cd4-Cre+ (Pros1 KO) mice. Data are presented as representative individual samples or as mean ± SEM of at least 4 to 6 independent samples per group. * p < 0.05, ***p < 0.001.
Deficiency of Pros1 in T cells leads to accelerated disease onset in a model of induced colitis
The transfer of CD4+CD25−CD45RBhigh cells into Rag1−/− mice results in the induction of colitis, a disease dependent on microbiota and triggered by antigen-specific DCs (Coombes and Powrie, 2008; Feng et al., 2010). We hypothesized that if T cell-derived Pros1 limits DC activation in vivo, transfer of Pros1 KO CD4+CD25−CD45RBhigh cells into Rag1−/− mice would result in exacerbated colitis. Indeed, transfer of Pros1 KO naïve T cells led to a significant acceleration of disease onset, as indicated by higher colonoscopy scores (Figure 2A and B). Increased numbers of IFNγ and IL-17A expressing T cells were detected in the mesenteric lymph nodes of Pros1 KO CD4+CD25−CD45RBhigh recipients, relative to the control CD4+CD25−CD45RBhigh recipients (Figure 2C). Similarly, higher levels of IL-17A expressing T cells were detected in the lamina propria of mice receiving Pros1 KO naïve T cells (Figure 2D).
Figure 2. Deficiency of Pros1 in transferred T cells leads to accelerated colitis in Rag1−/− recipient mice.

Sorted CD4+CD25−CD45RBhigh T cells from Pros1flox/flox Cd4-Cre− (Ctrl) or Cre+ (Pros1 KO) were transferred i.p. into Rag1−/− mice and colitis development was monitored. (A) Colonoscopy score of disease severity and (B) representative pictures of colonoscopy at week 6 are shown. Note loss of translucency, stool inconsistency (*), and increased mucosal granularity (#) in the Rag1−/− recipient of Pros1 KO T cells. Intracellular IFN-γ and IL-17A production on CD4+ cells from mesenteric LN (C) and lamina propria leukocytes of large intestine (D). Data are presented as individual samples or as mean ± SEM and are representative of 2 independent experiments with at least 5 samples per group. * p < 0.05, **p < 0.01.
T cell-derived Pros1 limits DC activation
Next, we directly tested if T cell-derived Pros1 regulates DC activation in vivo. Control and Pros1 KO OT-II CD45.2+ CD4+ T cells were transferred into CD45.1+ recipient mice, which were subsequently immunized with OVA-LPS-IFA in their footpads. Remarkably, the loss of Pros1 in antigen specific T cells resulted in a significant increase in the population of activated DCs, as detected by the expression of the co-stimulatory molecules CD86 and CD40, in the draining lymph node (Figure 3A). Similarly, we detected an enhancement in the activation of DCs when Pros1flox/floxCd4-Cre+ mice were directly immunized with OVA-LPS-IFA (Figure S2). Given these findings, we tested the ability of T cell-derived Pros1 to directly regulate the magnitude of DC activation upon antigen presentation in vitro. We co-cultured CD4+CD25−cells obtained from either Pros1flox/floxCd4-Cre+ OT-II or Pros1flox/floxCd4-Cre− OT-II mice with BM-DCs in the presence of OVA. In agreement with an immunomodulatory function of T cell-derived Pros1, we detected a significant increase in the percentage of CD86+ and CD40+ BM-DCs when cultured with Pros1-deficient as opposed to Pros1-expressing OT-II T cells (Figure 3B). Furthermore, TNF-α and IL-6 production were also increased in the absence of T cell-derived Pros1 (Figure 3C and D). Importantly, Pros1 produced by activated T cells did not exert an autocrine effect: There were no significant differences in the expression of activation markers, production of cytokines and proliferation between control (Pros1flox/floxCd4-Cre− or Pros1wt/wtCd4-Cre+) and Pros1 KO T cells when they were activated in vitro with anti-CD3/CD28 (Figure S3). In agreement with the increased activation of DCs in the absence of T cell-derived Pros1, Pros1flox/floxCd4-Cre+ mice immunized with OVA-LPS-IFA developed larger lymph nodes in comparison to control mice, primarily due to an expansion of T cells (Figure S2). Furthermore, we detected an increase in the proliferation of Pros1 KO CD4+ T cells isolated 10 d.p.i. when they were re-stimulated with OVA in vitro, as well as higher levels of IL-2 in the culture supernatant (Figure S2). Similarly, when control or Pros1 KO OT-II T cells were transferred into mice that were subsequently immunized with OVA-LPS-IFA, we detected significantly higher numbers of transferred OT-II T cells and increased cellularity of the draining lymph nodes in those mice that received Pros1 KO antigen-specific T cells (Figure S2). These findings are consistent with an increase in the number of antigen-specific T cells generated in the absence of T cell-derived Pros1.
Figure 3. T cell-derived Pros1 limits DC activation.

(A) CD45.2 T cells from indicated genotypes were transferred into CD45.1 recipients and 1 day after transfer recipient mice were injected with 50 μg of OVA/IFA/LPS into the rear footpad. Popliteal and inguinal LNs were collected after 72 h and CD86 and CD40 expression were measured on CD11c+ cells. Representative histograms for non-immunized and OVA immunized mice and independent data are shown. (B) Splenic CD4+CD25− T cells were isolated from Pros1flox/flox Cd4-Cre− OT-II (Ctrl OT-II Tc) and Pros1flox/flox Cd4-Cre+ OT-II (Pros1 KO OT-II Tc) mice and co-cultured with BM-DCs in the presence of the indicated concentrations of OVA. Representative FACS histograms and percentage of CD86+CD11c+ and CD40+ CD11c+ cells are shown. (C) TNF-α and IL-6 production in the co-culture supernatants after 72 h, as measured by ELISA. (D) Representative plots showing intracellular staining for TNF-α and IL-6 in CD11c+ (left) and individual samples (right) are shown. Data are presented as representative individual samples or as mean ± SEM of 3–5 independent samples per group. * p < 0.05, **p < 0.01, ***p < 0.001.
To further confirm if T cells are a relevant source of Pros1 for immunomodulation, we compared the immune response of control and Pros1flox/floxCd4-Cre+ mice to T-dependent and T-independent antigens. Pros1flox/floxCd4-Cre+ mice developed significantly higher levels of anti-trinitrophenyl (TNP) IgG1 in comparison to control mice upon immunization with the hapten TNP linked to keyhole limpet haemocyanin (KLH), a T-dependent antigen (Figure 4A). Conversely, no differences between Pros1 KO and control mice were detected upon immunization with the T-independent antigen TNP-Ficoll (Figure 4B). Interestingly, by 9 months of age, Pros1flox/floxCd4-Cre+ mice showed a spontaneous expansion of activated/memory like CD4+CD44hiCD62L− cells (Figure S4). However, autoantibodies, such as anti-DNA antibodies, were not detectable in 6–9 months old mice (Figure S4). Taken together, the above results indicate that Pros1 expression in activated antigen-specific T cells is required for the regulation of the magnitude of DC activation, thereby maintaining the physiological level of the immune responses.
Figure 4. Deletion of Pros1 in T cell results in increased immune responses upon immunization with T-dependent antigens.
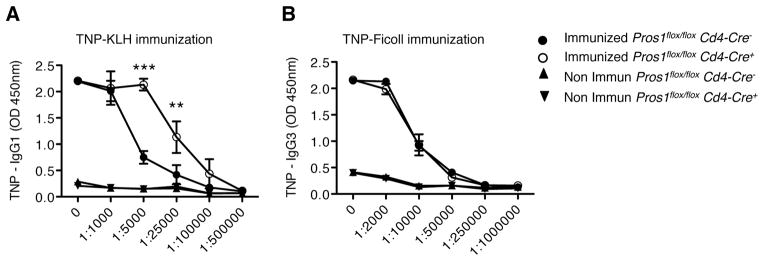
(A) Serum TNP specific IgG1 in TNP-KLH-immunized Pros1flox/flox Cd4-Cre− or Pros1flox/flox Cd4-Cre+ mice. (B) TNP-specific IgG3 in TNP-Ficoll-immunized mice. Data are presented as mean ± SEM and are representative of 2 independent experiments with at least 4 samples per group. **p < 0.01, ***p < 0.01.
T cell-derived Pros1 acts locally to inhibit DC activation through TAM signaling
Pros1 carries an N-terminal γ-carboxy glutamic acid (GLA) rich domain that allows it to bind to cell membranes containing the negatively charged phospholipid, phosphatidylserine (PtdSer). Binding of Pros1 to PtdSer is an essential feature of its biological activity (Nyberg et al., 1997). Interestingly, PtdSer is transiently exposed on the outer leaflet of the plasma membrane of activated T cells (Figure S5 and (Fischer et al., 2006). This feature prompted us to test if T cell-derived Pros1 functioned locally, at the interface of DC-T interaction by physically separating DC and T cells using a transwell system. To this end, we utilized T cells that had been pre-stimulated in vitro with anti-CD3 and anti-CD28 to bypass the need for DC-T cell contact to induce Pros1 expression in the T cells. Splenic CD4+CD25− T cells were activated in vitro and were then co-cultured with BM-DCs in the presence of several different agonists of pattern recognition receptors. BM-DCs expressed higher levels of CD86 and CD40 in response to Poly I:C when co-cultured with Pros1-deficient versus control T cells (Figure S5). Furthermore, the production of many different cytokines (TNF-α, IL-6, IFN-β) was significantly higher when BM-DCs were activated in the presence of Pros1 KO T cells than control T cells (Figure S5). Similarly, the activation of BM-DCs with CpG-A was also higher when DCs were co-cultured with Pros1 deficient T cells than with control T cells (Figure S5). Addition of recombinant Pros1 to the co-cultures rescued the ability of activated Pros1 KO T cells to regulate DC function (Figure S6). Next, we utilized the transwell system to physically separate in vitro activated T cells from BM-DCs. Interestingly, no differences in the expression of activation markers (e.g., co-stimulatory molecules) were detected when BM-DCs were cultured across the transwell with either control or Pros1 KO T cells (Figure 5A). These results suggest that Pros1-TAM signaling is not engaged in the presence of a permeable but physical barrier. Binding to exposed PtdSer on activated T cells may restrict Pros1 to the T cell surface, accounting for this localized function. Since Annexin V has been shown to efficiently compete with Pros1 for PtdSer binding (Anderson et al., 2003; Webb et al., 2002), we compared the activation of BM-DCs co-cultured with activated T cells in the absence or presence of Annexin V. Addition of Annexin V to the co-culture led to a significant enhancement of the expression of CD86 and CD40 by BM-DCs upon Poly I:C stimulation in WT but not Pros1 KO T cells (Figure 5B and Figure S6). These results indicate that Pros1 binding to PtdSer is necessary for its immunomodulatory effect.
Figure 5. Negative feedback of T cell-derived Pros1 depends of cell proximity and Axl and Mer signaling on DCs.

(A) Splenic CD4+ CD25− T cells from Pros1flox/flox Cd4-Cre− (Ctrl Tc) or Pros1flox/flox Cd4-Cre+ (Pros1 KO) mice were activated in vitro with anti-CD3/CD28 for 4 h. Activated T cells were then co-cultured with BM-DCs in presence of 30 μg/mL of Poly I:C for 15 h. To prevent close contact between activated CD4+ T cells and BM-DCs, BM-DCs were cultured on the upper chamber of a transwell system while activated T cells were cultured on the lower chamber. MFI of CD86 and CD40 expression on CD11c+ cells in the indicated conditions are shown. (B) Where indicated, 10 μg/mL of Annexin V (AnxV) was added to the T cell culture 1 h prior to co-culture with BM-DCs. Representative FACS histograms of CD86 and CD40 expression on CD11c+ cells are shown. (C) CD4+CD25− OT-II Ctrl T cells were co-cultured with WT or AM−/− BM-DC in the presence of 200 μg/mL of OVA for 48 h. Representative histograms for CD86 and CD40 expression on CD11c+ cells are shown. (D) Percentage of CD11c+SOCS3+ in activated BM-DCs upon co-culture with Ctrl or Pros1 KO T cells. (E) IkBα (top), Tubulin (bottom) in the co-culture were analyzed by western blot at the indicated time points. (F) Phospho-NF-κB p65 (Ser536) subunit was measured on activated CD11c+ cell co-cultured with Ctrl or Pros1 KO T cells by FACS. Data are presented as percentage of phospho-NF-κB p65 on CD11c+ cells, by histograms. Data are presented as individual samples or as mean ± SEM and are representative of at least 2 independent experiments with 3–4 independent samples per group. * p < 0.05, **p < 0.01, ***p < 0.001.
We also tested if the loss of Axl and Mer signaling in DCs phenocopied the loss of Pros1 in T cells using the in vitro antigen presentation assay. When co-cultured with Pros1-expressing OT-II T cells, Axl-Mer (AM) KO BM-DCs expressed significantly higher levels of co-stimulatory molecules, relative to wild-type BM-DCs (Figure 5C). These results indicate that the loss of Axl and Mer renders DCs refractory to T cell-derived Pros1-mediated regulation. TAM signaling regulates DC activation levels through the induction of SOCS, which in turn leads to reduction of NF-kB activity (Rothlin et al., 2007). The use of Pros1 deficient T cells in the T cell:DC coculture system, led to the reduced induction of SOCS3, increased IκBα degradation and increased p65NF-κB phosphorylation in BM-DCs in comparison to control T cells (Figure 5D-F). Together, all of these data demonstrate that T cell-derived Pros1 functions locally at the DC-T cell interface and engages TAM signaling within DCs to limit their activation.
PROS1 expression and function are conserved in humans
To test if human T cells express PROS1, human naïve CD4+ T cells were isolated by negative selection from human peripheral blood mononuclear cells (PBMCs) and stimulated with anti-CD3/CD28. In vitro activation of human CD4+ T cells led to a significant induction of PROS1 mRNA as well as PROS1 expression on the cell surface (Figure 6A and B). We also compared PROS1 expression in the inter-follicular T cell area of reactive versus non-reactive human lymph nodes. Sections from non-malignant human lymph nodes classified by histopathological analyses as non-reactive (n=6) or reactive (n=6), were stained with anti-CD3 and anti-PROS1 antibodies and counter-stained with hematoxylin. PROS1 staining was positive in the CD3+ T cell area of reactive lymph nodes with no expression detectable in non-reactive lymph nodes (Figure 6C).
Figure 6. PROS1 is expressed in activated human CD4 T cells and PROS1 blockade leads to enhanced activation of DCs in MLR.

Human naïve CD4 T cells were isolated from PBMCs by negative selection and stimulated with anti-CD3/CD28 for 6 days. (A) Expression of PROS1 mRNA, normalized to unstimulated naïve CD4+ T cells, is shown. (B) Surface PROS1 expression on CD4+CD69+ cells after 6 days of stimulation with α-CD3/CD28. Representative histogram from at least 5–7 independent donors is shown. (C) Sections from non-reactive and reactive human lymph nodes (LNs) were stained with anti-CD3 and anti-PROS1. Representative PROS1 staining in the inter-follicular CD3+ T cell areas on non-reactive (n=6) and reactive (n=6) LNs are shown. (D) Schematic representation of MLR and PROS1 neutralization. (E and F) CD86 and CD40 expression were measured on CD11c+ cells at day 5. Representative histograms (left) and independent data with at least 3 independent samples per group (right) are shown. Each experiment was repeated at least twice employing 3 to 5 different donors. (G) Percentage of total PROS1 in healthy controls and IBD patients. Total PROS1 was determined using automated latex immunoassay methodology and normalized to an average value of PROS1 from a pool of healthy donors. * p < 0.05, **p < 0.01, ***p < 0.01.
To explore if human T cell-derived PROS1 indeed functions in regulating levels of DC activation, we performed mixed lymphocyte reactions (MLRs). Monocyte-derived DCs and naïve T cells were isolated from different donors and co-cultured for 5 days (Figure 6D). Monocyte-derived DCs express both AXL and MER, while activated T cells express PROS1 in the MLR (data not shown). In agreement with a regulatory role for PROS1, the neutralization of PROS1 with an anti-PROS1 antibody led to a significant increase in CD86 and CD40 expression in human monocyte-derived DCs (Figure 6E and F).
To test if the loss of function of PROS1 is associated with pathological inflammation in humans, we extended our studies to patients with Inflammatory Bowel Disease (IBD), including Ulcerative Colitis and Crohn Disease. PROS1 levels are measured routinely from patient plasma for the diagnosis of PROS1 deficiencies. Interestingly, patients with active IBD frequently showed lower levels of plasma PROS1 relative to healthy controls (Figure 6G). More than 200 germline mutations in the PROS1 gene have been described. Type I deficiencies, characterized by reduced PROS1 levels, are associated with mutations within the coding region (Gandrille et al., 2000; Garcia de Frutos et al., 2007). Therefore, for Type I deficiencies, plasma PROS1 levels (produced by hepatocytes and endothelial cells) are likely to function as a surrogate for the amount of PROS1 produced by other cellular sources, including T cells. Future studies directly measuring T cell-derived PROS1 will further validate this hypothesis. Collectively, these results indicate that this novel anti-inflammatory pathway is present in humans and functions in maintaining immune homeostasis.
Discussion
Our results reveal a hitherto unknown indispensable, negative feedback mechanism by which activated T cells restrain DC activation and, thereby, regulate the overall magnitude of the immune response. Following initial DC activation and antigen presentation, T cells are activated, leading to the induction of Pros1. Pros1 engages the anti-inflammatory TAM receptor tyrosine kinase signaling pathway in DCs. This enables activated T cells to report back to DCs and restrain further stimulation of the overall immune response. This feedback mechanism is essential for maintaining the physiological level of immune activation capable of host defense yet avoiding exacerbated inflammation. The absence of this “immunological brake” leads to pathological levels of inflammation and chronic inflammatory diseases, such as colitis. Importantly, Pros1-TAM signaling is not redundant with respect to other negative regulators. Although Pros1 is a secreted protein, its immunoregulatory function is dependent on its binding to the T cell-surface associated PtdSer thereby restricting Pros1 function to DC-T cell interface. Because cognate DC-T cell interactions are antigen-specific, this property of Pros1 presumably results in an antigen specific negative regulatory function. Whether this feature makes Pros1 distinct from other known negative regulators of DC activation such as IL-10 (Banchereau et al., 2012), and prevents compensation remains unknown. Future studies focused on Pros1 function in a variety of immunological settings and its integration with known regulatory pathways will provide a more comprehensive understanding of mechanisms through which the adaptive immune system, once engaged, regulates the magnitude of the innate immune response and how overall immune homeostasis is maintained.
Pros1, produced by hepatocytes and endothelial cells, is found in large amounts in the blood (Burstyn-Cohen et al., 2009). T cells do not significantly contribute to the physiological levels of Pros1 in plasma, as the levels of Pros1 in the plasma of control and Pros1flox/floxCd4-Cre+mice were comparable. Conversely, our findings unambiguously demonstrate that Pros1 in the blood is unable to compensate for the loss of Pros1 expression by activated T cells. The fact that T cell-derived Pros1 is necessary to control DC responses, despite a significant level of Pros1 present in the circulation, is intriguing. Our results demonstrate that Pros1 acts locally as an immunomodulatory signal at the physical T cell-DC interface. The simultaneous production of Pros1 and the exposure of PtdSer on activated T cells allows for the localization and the bioactivity of Pros1 at the T cell membrane surface, engaging TAM signaling in DCs following T cell priming in lymphoid organs. Additionally, Pros1 in the plasma, an approximately 72 kDa molecule in its monomeric form, is likely to be excluded from the extravascular sites where DC-T cell interaction occurs. A local, circulation-independent production of Pros1 has also recently been observed for retinal pigment epithelial cells of the eye (Burstyn-Cohen et al., 2012).
There are two known ligands for the TAM receptors – Gas6 and Pros1. These ligands often function redundantly. For example, Gas6 KO mice do not recapitulate the phagocytosis defects in the Retinal Pigmental Epithelial cells observed in Mer KO mice (Prasad et al., 2006). The combinatorial deletion of Gas6 and Pros1 in the retina is required to phenocopy the loss of Mer (Burstyn-Cohen et al., 2012). Interestingly, neither resting nor activated T cells express Gas6. Consistent with this expression pattern, the loss of Pros1 alone in T cells is sufficient to account for the enhanced magnitude of the immune response. Albeit fundamental and non-redundant for controlling the magnitude of the immune response and preventing pathological inflammatory responses, loss of T cell-derived Pros1, by itself, is not enough to spontaneously break tolerance. TAM receptors have two major biological functions - the removal of apoptotic cells and the negative regulation of innate immune responses. The loss of these distinct functions likely accounts for the autoimmunity in TAM triple KO mice. Thus, the combinatorial deletion of the two ligands may be required to recapitulate the spontaneous autoimmunity characteristic of TAM triple KO mice.
Our results reveal the hitherto unknown function of Pros1 as an endogenous anti-inflammatory protein and a key regulator of immune homeostasis. The most well-established activity of Pros1 to date is TAM-independent, where it functions as an anticoagulant (Gandrille et al., 2000). In fact, Smiley et al reported the expression of Pros1 in activated T cells, yet ascribed this to an anticoagulant role of T cells (Smiley et al., 1997). Is the duality of Pros1 function relevant in physiological or pathological settings? Chronic inflammatory and autoimmune diseases have been described anecdotally, yet repeatedly, in patients with low circulating levels of PROS1 (Aadland et al., 1992; Koutroubakis et al., 2000; Suh et al., 2010; Zezos et al., 2007). Additionally, diseases, such as IBD, are often concurrent with thrombotic events (Grainge et al., 2010). The discovery of the novel immunomodulatory function of Pros1 may provide a unifying molecular explanation for these two clinical features of IBD. The association of reduced PROS1 with IBD supports the notion that there may be a causal link. However, thrombotic events can directly lead to inflammation, and our present results do not rule out an association between IBD and a subset of patients with PROS1 loss limited to the plasma. On the other hand, we are also likely to miss patients with T cell-specific loss of PROS1, as T cells do not contribute to the plasma level of PROS1. Nevertheless, the association is intriguing and dedicated efforts focused on measuring T cell-derived PROS1 may causally link PROS1 deficiencies with the development and/or progression of autoimmune or chronic inflammatory diseases and reveal PROS1 as a useful biomarker for minimally invasive diagnosis and prognosis of IBD in the future.
Experimental Procedures
Mice
Pros1flox/flox, Axl and Mer KO mice have been described previously (Burstyn-Cohen et al., 2009; Lu et al., 1999). Cd4-Cre, Lck-Cre, B6.Cg-Tg (TcrαTcrβ) (OT-II) transgenic mice, Rag1−/− and B6.SJL-PtprcaPepcb/BoyJ (CD45.1) were obtained from Jackson Laboratory. All mice were bred at Yale University animal facility. All mice were specific pathogen free, maintained under a strict 12h light cycle (lights on at 7:00am and off at 7:00pm), and given a regular chow diet. All experimental procedures were approved by Yale IACUC.
Antibodies
The following anti-mouse antibodies were purchased from BD-Biosciences, eBioscience, Santa Cruz or BioLegend (USA), as conjugated to FITC, PE, PE-Cy5, PerCP-Cy5.5, APC-Cy7, Alexa fluor 700, PE-Cy7, Pacific blue, or APC: CD3 (145-2C11), CD4 (GK1.5, L3T4, RM4-5), CD8 (53-6.7), CD11b (MI/70), CD11c (N418, HL3), CD25 (PC61), CD40 (HM40), CD44 (IM7), CD45 (30-F11), CD45R (RA3-6B2), CD62L (MEL-14), CD69 (H1.2F3), CD86 (GL1), F4/80 (BM8), I-A/I-E (M5/114.15.2), IL-6 (MP5-20F3), IL-12p40 (C17.8), TNF-α (MP6-XT22), IFN-γ (XMG1.2), IL-17A (17B7). Unconjugated antibodies employed were: CD3 (145-2C11), CD28 (37.51), IL4 (11B11), IFN (XMG1.2), Protein S (H90): sc 25836, CD16/32 (2.4G2).
As a secondary antibody, DyLight 649 Donkey anti Rabbit IgG (Poly4064) was used. Monoclonal antibody against human gamma-carboxyglutamyl (Gla) residues (American Diagnostica Inc.) was used to immunoprecipitate GLA containing proteins from serum. The following anti-human antibodies were purchased from BD-Biosciences or BioLegend (USA), conjugated to Alexa fluor 488, FITC, APC-Cy7, APC, PE, Pacific blue: CD2 (TS1/8), CD69 (FN50), CD3 (UCHT1), CD4 (RPA-T4), CD11c (3.9), CD11b (MI/70), CD40 (5C3), CD86 (IT2.2) and PROS1 (PS7).
Flow Cytometry analysis
For standard stainings, cells were harvested and washed once with PBS, then blocked with Fc-block (BD- bioscience) for at least 10 minutes in PBS/2% FBS. Cells were washed again and incubated with the respective cocktail of antibodies for 30 minutes on ice. Antibody cocktails were prepared in PBS/2% FBS. 7ADD was also included to gate on live cells. After the last wash, cells were acquired on a FACSCalibur, LSR-II (BD) or Stratedigm S1000EX (Stratedigm).
For Pros1 staining, after cells were collected and washed, they were fixed with cold acetone (−20 °C) for 5 minutes and washed 3 times with PBS to discard all remaining acetone. After washing, cells were blocked with PBS/3% BSA for 30 minutes on ice. They were washed again and anti-Pros1 (H90) (Santa Cruz biotechnology, USA) was added at 1μg per 1×10⁶ of cells in PBS/3% BSA. Cells were incubated for 1 hour on ice and then washed twice. The secondary DyLight 649 Donkey anti Rabbit (Biolegend, USA) was added and incubated for 30 minutes on ice. After the final wash, samples were acquired on a FACSCalibur or LSR-II (BD). All the directly conjugated antibodies clones used together with Pros1 staining were tested for acetone fixation.
RT- qPCR
At the indicated time points, cells were harvested and washed, and RNA was isolated using RNeasy mini kit (Qiagen, USA) following the manufacturer’s instructions. Reverse transcription was performed with RT Superscript III (Invitrogen) or iScript cDNA Synthesis kit (BIO-RAD). qPCR reactions were performed on Stratagene Mx3000 System using KAPA SYBR Fast qPCR kit (KAPABIOSYSTEM). The reactions were normalized to housekeeping gene and the specificity of the amplified products were checked by dissociation curves. Primers used in this paper are listed in the supplementary table.
ELISAS
TNF-α, IL-6 and IL-2 were measured by ELISA Ready-Set-Go (eBioscience, USA) and IFN-β was tested using Verikine mouse IFN-β ELISA kit (PBL Interferon source). Culture supernatants were tested at different dilutions following the manufacturer’s protocol.
T cell isolation
Mouse CD4+ T cells were isolated from the spleen by negative selection using EasySep Mouse CD4+ T cell enrichment kit and following the manufacturer’s recommendation (STEMCELL, USA). CD4+CD25− T cells were then obtained upon depletion of CD25+ cells using EasySep mouse CD25 selection kit (STEMCELL, USA). Human naïve or total CD4+ T cells were isolated from PBMCs using the EasySep human naïve, CD4 T cell enrichment kit, according to manufacturer’s protocol (STEMCELL, USA).
BMDC differentiation
Bone marrow dendritic cells (BMDC) were obtained from WT or Axl and Mer double KO (AM−/−) mice following a standard protocol for differentiation. Briefly for BMDC, bone marrow progenitors were collected from the femurs of the indicated mice and 7–10 × 106 cells were cultured in 100 × 20 mm non-treated cell culture plates in 10 mL of enriched medium, RPMI 1640 plus 10% fetal bovine serum (FBS), 1% penicillin/streptomycin and supplemented with 20 ng/mL of recombinant GM-CSF (Peprotech, USA). At days 3 and 5 of cell culture, 10 and 5 mL of enriched media were added, respectively. On day 6, BMDCs were harvested and 90 %, on average, of harvested cells were positive for CD11c.
Antigen Presentation assays
For testing Pros1 expression upon antigen presentation, splenic CD4+ T cells were purified from OT-II mice and co-cultured with BMDC in presence of 200 μg/mL of OVA (A5503, SIGMA). After 24 h, cells were collected and fixed with cold acetone (-20 °C). Pros1 expression was analyzed on CD4+CD69+ or CD4+CD69− cells. Pros1 staining was performed according to the protocol described above.
Splenic CD4+CD25− T cells were purified from C57BL/6 (WT), Pros1flox/flox Cd4-Cre−OT-II (Ctrl OT-II) and Pros1flox/flox Cd4-Cre+ OT-II (Pros1 KO OT-II) mice and co-cultured with WT or AM−/− BMDC at 1:1 ratio in presence of 50 to 200 μg/mL of OVA (SIGMA). After 24, 48 and 72 h cells were collected. CD86 and CD40 were measured on CD11c+ cells by FACS. TNF-α, IL6 and IL-12 were tested by intracellular staining and in the co-culture supernatant by ELISA.
For T cell proliferation assays, CD4+ T cell were isolated from inguinal and popliteal lymph nodes of immunized mice. 1×10⁵ CD4+ T cells stained with 5 μM CFSE were cultured with 3×10⁵ irradiated splenocytes in presence of serial dilutions of OVA, starting at 900 μg/mL. Proliferating T cells were analyzed by FACS at day 4 by dilution of CFSE. Additionally, IL-2 production was measured in the co-culture supernatant by ELISA.
T cell – BMDC co-culture
CD4+CD25− cells were isolated by negative selection of CD4+ cells followed by depletion of CD25+ cells following manufacturer’s instructions (STEMCELL, USA). CD4+CD25− T cells were pre-activated in serum free medium (STEMCELL, USA) with 10 μg/mL plate bound anti-CD3 and 2 μg/mL soluble anti-CD28 for 4h. BMDCs were then added onto pre-activated T cells at a 1:1 ratio and stimulated with 30 μg/mL of Poly I:C or 0.5 μM CpG A (Invivogen, USA) for 12–15h. CD86 or CD40 were analyzed on CD11c+. For experiments using recombinant Pros1, pre-activated CD4+CD25− T cells from Pros1flox/flox Cd4-Cre+ were co-cultured with BMDC at 1:1 ratio and stimulated with 30 μg/mL of Poly I:C or 0.5 μM CpG A (Invivogen, USA) in serum free medium supplemented with 1/10 of conditioned media from HEK 293 expressing recombinant murine Protein S (Prasad et al., 2006).
Competitive Annexin V and Transwell assay
T cell/BMDC co-culture was performed as described above. For competitive Annexin V assay, 10 μg/mL of recombinant Annexin V (BD-Bioscience, USA) was added to the T cell culture 1 h prior to the addition of BMDCs. BMDCs were added onto pre-activated T cells that have been incubated with Annexin V and the protocol was continued as was previously described. For the transwell assay, T cells were pre-activated on the bottom portion of the transwell for 4 h and then DCs were added on top of transwell membrane (0.4 micron, Corning, USA). As a control, DCs were also added at the bottom, directly onto pre-activated T cells. The activation of DCs was performed as described above.
Immunization Protocols
CD4+ cells were isolated by negative selection as per manufacturer’s instructions (STEMCELL, USA) from the spleen and LN of CD45.2 OT-II Pros1flox/flox Cd4-Cre− (Ctrl OT-II) or Cre+ (Pros1 KO OT-II). 5×10⁶ CD4+ CD45.2 Ctrl OT-II or Pros1 KO OT-II were transferred into C57BL/6 CD45.1 recipient mice by retro-orbital injection. After 1 day, mice were challenged by injection of 50 μg of OVA/5 ng LPS/emulsified in incomplete Freund’s adjuvant (OVA/LPS/IFA) in one of the rear footpads. 48 and 72 h after immunization, inguinal and popliteal LNs were removed, total number cells were counted, Pros1 expression in CD45.2 and DC compartment in CD45.1 were analyzed by FACS. Pros1flox/flox Cd4-Cre− (Ctrl) or Cre+ (Pros1 KO) mice, 8–10 weeks-old, were immunized with 300 μg TNP-KLH (13:1) or 100 μg TNP-Ficoll (90:1) (both from Biosearch Technologies) in PBS on day 0 and 14. anti-TNP antibodies were analyzed by ELISA from serum at day 30 post immunization.
T cell-induced colitis
CD4+CD45RBhighCD25− T cells were isolated from the spleen and lymph nodes of Pros1flox/flox Cd4-Cre− (Ctrl) or Cre+ (Pros1 KO) mice, and transferred i.p. into Rag1−/−mice (4×10⁵ cells/mouse). Colonoscopy was performed in a blinded fashion for colitis scoring via the Coloview system (Karl Storz, Germany). In brief, colitis scoring was based on granularity of mucosal surface, stool consistence, vascular pattern, translucency of the colon, and fibrin visible (0–3 points for each). Mice were sacrificed about 6–8 weeks after the transfer, and cells isolated from the colon and mesenteric lymph nodes were analyzed for IFN-γ and IL-17A producing CD4 cells.
Generation of human monocyte-derived DC
1×10⁸ PBMCs in 8 mL of RPMI 1640 plus 2% of human serum were plated in 75 cm2 cell culture flask and incubated at 37°C with 5% CO2 for 60 min for monocyte adherence. After the incubation period, the non-adherent cells were removed by washing 4 times with 6–10 mL of PBS. The adherent cells were cultured in 8 mL RPMI-1640 10% FCS containing 300 U/mL of IL-4 (R&D), 450 U/mL of GM-CSF (R&D) at 37°C and 5% CO2. Cytokine supplementation was performed again on days 3 by adding 4 mL RPMI-1640 10% FCS containing 900 U/mL of IL-4, 1350 U/mL GM-CSF. Monocyte-derived DCs were harvested on day 7.
PROS1 expression in Human T cells
Human naïve CD4 T cells were obtained from PBMCs using EasySep human naïve CD4+ T cell enrichment kit (STEMCELL, USA). 0.5 to 1×10⁵ purified naïve CD4+ cells were cultured in presence (1:1 ratio) or absence of anti human CD3/CD28 beads (Life technology) plus hIL-2 (Peprotech) in serum free medium (STEMCELL, USA) for 1 to 6 days. Cells were harvested daily and PROS1 expression was evaluated by qPCR using specific primers (supplementary table) and anti-PROS1-FITC for surface staining by FACS.
Mixed Lymphocyte Reaction (MLR)
Human naïve CD4 T cells were obtained by negative selection (STEMCELL, USA) and co-cultured with Monocyte derived-DC, from a different donor, at 2:1 ratio for 5 days. For PROS1 blocking experiment anti-PROS1 (PS7) antibody was added at day 4 and cells were harvest at day5. CD40 and CD86 activation markers were measured on CD11c+ cells by FACS.
Protein S total antigen in IBD patients
This study was approved by the Mayo Clinic Institutional Review Board. Patients at Mayo Clinic in Arizona with a confirmed diagnosis of active inflammatory bowel disease (Crohn Disease or Ulcerative Colitis) not on steroids were enrolled. Exclusion criteria included patients with possible infectious gastroenteritis, ischemia or drug-induced disease as well as those treated with steroids. Prior to enrollment, all patients were provided informed consent. Blood was then collected from all patients as well as age-matched adult healthy volunteers. Total PROS1 measurements were performed at the Mayo Clinic using the Diagnostica Stago LIATEST Protein S Kit on the Beckman Coulter ACL TOP (http://www.mayomedicallaboratories.com/test-catalog/Performance/83049).
Immunohistochemistry
Immunohistochemistry was performed using an automated Benchmark XT IHC system with ultraview universal DAB Detection Kit (Ventana, Tucson, AZ) and primary antibodies to PROS1 (Sigma; 1:50) and CD3 (Ventana, 0.45 μg/mL). In brief, paraffin-embedded formalin fixed tissue sections were processed according to mild CC1 (PROS1) and standard CC1 (CD3) programs including incubation with the primary antibodies for 30 minutes (CD3) or 1 hour (PROS1) at 37°C. Appropriate positive (liver) and negative (secondary antibody only) controls were stained in parallel for each round of immunohistochemistry.
Statistical Analysis
Differences between the means of experimental groups were analyzed with a two-tailed Student’s t-test or ANOVA (Prism GraphPad software, Inc.). Bonferroni multiple comparison test was used following 2-way ANOVA. p values ≤ 0.05 were considered significant.
Supplementary Material
F= forward, R= reverse
Acknowledgments
We thank R. Medzhitov for critical reading of this manuscript. We also thank S. Huber, A. Iwasaki, P. Kavathas, P. Lincona-Limón, S. Nish, D. Schenten and E. Zuniga for helpful suggestions and discussions. This research was supported by grants from the National Institutes of Health (R01 AI077058 to G.L., R01 AI089824 to C.V.R. and S.G., CA95060 to S.G. and T32 AI007019 to P.Y.C), by the Crohn’s and Colitis Foundation (to C.V.R and S.G.), by the American Heart Association (C.V.R), American Asthma Foundation (C.V.R.) and Lupus Research Institute (C.V.R) and a Gershon-Trudeau Postdoctoral Fellowship (E.C.S.).
References
- Aadland E, Odegaard OR, Roseth A, Try K. Free protein S deficiency in patients with chronic inflammatory bowel disease. Scand J Gastroenterol. 1992;27:957–960. doi: 10.3109/00365529209000170. [DOI] [PubMed] [Google Scholar]
- Anderson HA, Maylock CA, Williams JA, Paweletz CP, Shu H, Shacter E. Serum-derived protein S binds to phosphatidylserine and stimulates the phagocytosis of apoptotic cells. Nat Immunol. 2003;4:87–91. doi: 10.1038/ni871. [DOI] [PubMed] [Google Scholar]
- Banchereau J, Pascual V, O’Garra A. From IL-2 to IL-37: the expanding spectrum of anti-inflammatory cytokines. Nat Immunol. 2012;13:925–931. doi: 10.1038/ni.2406. [DOI] [PMC free article] [PubMed] [Google Scholar]
- Burstyn-Cohen T, Heeb MJ, Lemke G. Lack of protein S in mice causes embryonic lethal coagulopathy and vascular dysgenesis. J Clin Invest. 2009;119:2942–2953. doi: 10.1172/JCI39325. [DOI] [PMC free article] [PubMed] [Google Scholar]
- Burstyn-Cohen T, Lew ED, Traves PG, Burrola PG, Hash JC, Lemke G. Genetic Dissection of TAM Receptor-Ligand Interaction in Retinal Pigment Epithelial Cell Phagocytosis. Neuron. 2012;76:1123–1132. doi: 10.1016/j.neuron.2012.10.015. [DOI] [PMC free article] [PubMed] [Google Scholar]
- Coombes JL, Powrie F. Dendritic cells in intestinal immune regulation. Nat Rev Immunol. 2008;8:435–446. doi: 10.1038/nri2335. [DOI] [PMC free article] [PubMed] [Google Scholar]
- Dahlback B. The tale of protein S and C4b-binding protein, a story of affection. Thromb Haemost. 2007;98:90–96. [PubMed] [Google Scholar]
- Feng T, Wang L, Schoeb TR, Elson CO, Cong Y. Microbiota innate stimulation is a prerequisite for T cell spontaneous proliferation and induction of experimental colitis. J Exp Med. 2010;207:1321–1332. doi: 10.1084/jem.20092253. [DOI] [PMC free article] [PubMed] [Google Scholar]
- Fischer K, Voelkl S, Berger J, Andreesen R, Pomorski T, Mackensen A. Antigen recognition induces phosphatidylserine exposure on the cell surface of human CD8+ T cells. Blood. 2006;108:4094–4101. doi: 10.1182/blood-2006-03-011742. [DOI] [PubMed] [Google Scholar]
- Gandrille S, Borgel D, Sala N, Espinosa-Parrilla Y, Simmonds R, Rezende S, Lind B, Mannhalter C, Pabinger I, Reitsma PH, et al. Protein S deficiency: a database of mutations--summary of the first update. Thromb Haemost. 2000;84:918. [PubMed] [Google Scholar]
- Garcia de Frutos P, Fuentes-Prior P, Hurtado B, Sala N. Molecular basis of protein S deficiency. Thromb Haemost. 2007;98:543–556. [PubMed] [Google Scholar]
- Grainge MJ, West J, Card TR. Venous thromboembolism during active disease and remission in inflammatory bowel disease: a cohort study. Lancet. 2010;375:657–663. doi: 10.1016/S0140-6736(09)61963-2. [DOI] [PubMed] [Google Scholar]
- Iwasaki A, Medzhitov R. Regulation of adaptive immunity by the innate immune system. Science. 2010;327:291–295. doi: 10.1126/science.1183021. [DOI] [PMC free article] [PubMed] [Google Scholar]
- Janeway CA., Jr Approaching the asymptote? Evolution and revolution in immunology. Cold Spring Harb Symp Quant Biol. 1989;54(Pt 1):1–13. doi: 10.1101/sqb.1989.054.01.003. [DOI] [PubMed] [Google Scholar]
- Koutroubakis IE, Sfiridaki A, Mouzas IA, Maladaki A, Kapsoritakis A, Roussomoustakaki M, Kouroumalis EA, Manousos ON. Resistance to activated protein C and low levels of free protein S in Greek patients with inflammatory bowel disease. Am J Gastroenterol. 2000;95:190–194. doi: 10.1111/j.1572-0241.2000.01683.x. [DOI] [PubMed] [Google Scholar]
- Lambrecht BN, Hammad H. The role of dendritic and epithelial cells as master regulators of allergic airway inflammation. Lancet. 2010;376:835–843. doi: 10.1016/S0140-6736(10)61226-3. [DOI] [PubMed] [Google Scholar]
- Lu Q, Gore M, Zhang Q, Camenisch T, Boast S, Casagranda F, Lai C, Skinner MK, Klein R, Matsushima GK, et al. Tyro-3 family receptors are essential regulators of mammalian spermatogenesis. Nature. 1999;398:723–728. doi: 10.1038/19554. [DOI] [PubMed] [Google Scholar]
- Medzhitov R, Preston-Hurlburt P, Janeway CA., Jr A human homologue of the Drosophila Toll protein signals activation of adaptive immunity. Nature. 1997;388:394–397. doi: 10.1038/41131. [DOI] [PubMed] [Google Scholar]
- Nyberg P, He X, Hardig Y, Dahlback B, Garcia de Frutos P. Stimulation of Sky tyrosine phosphorylation by bovine protein S--domains involved in the receptor-ligand interaction. Eur J Biochem. 1997;246:147–154. doi: 10.1111/j.1432-1033.1997.t01-2-00147.x. [DOI] [PubMed] [Google Scholar]
- Prasad D, Rothlin CV, Burrola P, Burstyn-Cohen T, Lu Q, Garcia de Frutos P, Lemke G. TAM receptor function in the retinal pigment epithelium. Mol Cell Neurosci. 2006;33:96–108. doi: 10.1016/j.mcn.2006.06.011. [DOI] [PubMed] [Google Scholar]
- Rothlin CV, Ghosh S, Zuniga EI, Oldstone MB, Lemke G. TAM Receptors Are Pleiotropic Inhibitors of the Innate Immune Response. Cell. 2007;131:1124–1136. doi: 10.1016/j.cell.2007.10.034. [DOI] [PubMed] [Google Scholar]
- Saller F, Brisset AC, Tchaikovski SN, Azevedo M, Chrast R, Fernandez JA, Schapira M, Hackeng TM, Griffin JH, Angelillo-Scherrer A. Generation and phenotypic analysis of protein S-deficient mice. Blood. 2009;114:2307–2314. doi: 10.1182/blood-2009-03-209031. [DOI] [PMC free article] [PubMed] [Google Scholar]
- Smiley ST, Boyer SN, Heeb MJ, Griffin JH, Grusby MJ. Protein S is inducible by interleukin 4 in T cells and inhibits lymphoid cell procoagulant activity. Proc Natl Acad Sci U S A. 1997;94:11484–11489. doi: 10.1073/pnas.94.21.11484. [DOI] [PMC free article] [PubMed] [Google Scholar]
- Stitt TN, Conn G, Gore M, Lai C, Bruno J, Radziejewski C, Mattsson K, Fisher J, Gies DR, Jones PF, et al. The anticoagulation factor protein S and its relative, Gas6, are ligands for the Tyro 3/Axl family of receptor tyrosine kinases. Cell. 1995;80:661–670. doi: 10.1016/0092-8674(95)90520-0. [DOI] [PubMed] [Google Scholar]
- Suh CH, Hilliard B, Li S, Merrill JT, Cohen PL. TAM receptor ligands in lupus: protein S but not Gas6 levels reflect disease activity in systemic lupus erythematosus. Arthritis Res Ther. 2010;12:R146. doi: 10.1186/ar3088. [DOI] [PMC free article] [PubMed] [Google Scholar]
- Webb JH, Blom AM, Dahlback B. Vitamin K-dependent protein S localizing complement regulator C4b-binding protein to the surface of apoptotic cells. J Immunol. 2002;169:2580–2586. doi: 10.4049/jimmunol.169.5.2580. [DOI] [PubMed] [Google Scholar]
- Zezos P, Papaioannou G, Nikolaidis N, Vasiliadis T, Giouleme O, Evgenidis N. Thrombophilic abnormalities of natural anticoagulants in patients with ulcerative colitis. Hepatogastroenterology. 2007;54:1417–1421. [PubMed] [Google Scholar]
Associated Data
This section collects any data citations, data availability statements, or supplementary materials included in this article.
Supplementary Materials
F= forward, R= reverse