

Abstract
We simulate a simple phenomenological model describing phase behavior in a multicomponent membrane, a model capable of producing macroscopic phase separation, modulated phases, and microemulsions, all of which have been discussed in terms of raft phenomena. We show that one effect of thermal fluctuations on the mean-field phase diagram is that it permits a direct transition between either one of the coexisting liquid phases to a microemulsion. This implies that one system exhibiting phase separation can be related to a similar system exhibiting the heterogeneities characteristic of a microemulsion. The two systems could differ in their average membrane composition or in the relative compositions of their exoplasmic and cytoplasmic leaves. The model provides a unified description of these raft-associated phenomena.
Introduction
The hypothesis that the plasma membrane is not uniform, but instead characterized by rafts of saturated lipids and cholesterol floating in a sea of unsaturated lipids, continues to be an extremely fruitful one (1) even in the absence of direct experimental confirmation of such rafts. The experimental situation has been enlivened by the recent observations of an organized array of small domains in the yeast plasma membrane (2) and of both macroscopic phase separation and modulated phases in yeast vacuoles (3). In addition, both macroscopic phase separation and modulated phases have been observed in giant unilamellar vesicles consisting of quaternary mixtures of phospholipids and cholesterol (4,5). That rafts could be attributed to macroscopic phase separation between saturated and unsaturated lipids was among the earliest hypotheses about their origin (6). The possible relevance of modulated phases to biological systems has been discussed more recently (7). In addition, it has been emphasized (8) that any system that can exhibit modulated phases will also exhibit a microemulsion (a fluid phase consisting of fluctuating structures of a characteristic size, of a length that is in addition to, and separate from, the correlation length that characterizes any fluid (9)). The idea that a microemulsion could be of relevance to the structure of the plasma membrane had been impeded by the lack of an obvious line-active agent at the boundary between regions of saturated and unsaturated lipids. In the plasma membrane, the latter consist almost entirely of lipids with one saturated and one unsaturated tail, sometimes denoted as hybrid lipids. Hirose et al. (7) and Brewster et al. (10) suggested that such hybrid lipids could serve as a line-active agent between regions of lipids with saturated tails and adjacent regions of lipids with two unsaturated tails, and reduce the energy of such an interface to zero. Whereas this suggestion might be applicable to in vitro systems that contain mixtures of these three different kinds of lipids (4), it is not applicable to the plasma membrane, which contains few, if any, lipids with two unsaturated tails (11,12). It was then suggested that hybrid lipids could serve both as a bulk component of one of the separated regions and as a line-active agent between the regions of different lipids (13,14). However, recent experiments show that modulated phases can be produced in mixtures containing no line-active hybrid lipids at all (15).
There are other mechanisms (16) that can produce microemulsions that do not rely on the presence of a line-active agent to reduce to zero the energy per unit length of an interface between adjacent regions of different composition. These mechanisms decrease the energy per unit area of the regions by coupling them to some external source, such as a fluctuation in curvature that favors the presence of one component in an area of positive curvature and the other component in an area of negative curvature (17,18). It was proposed by one of us (8) that it was just this coupling of membrane height fluctuations and lipid composition that could be the one at work in the plasma membrane. In particular, the large difference in spontaneous curvatures between the phosphatidylserines and the phosphatidylethanolamines (19), two major components of the cytoplasmic leaf of the plasma membrane, would seem to provide a large coupling to membrane height fluctuations and thereby lead to a microemulsion (20). Because the phase diagram of the model that we employed previously displays macroscopic phase separation and modulated phases and a microemulsion, it is a particularly useful one to highlight those issues that would distinguish the different behaviors exhibited by different systems. It is the purpose of this article to study and discuss the phase diagram of a somewhat simpler version of the model, to highlight the unified picture it brings to the diverse experimental observations.
Theoretical Model
Previously, we considered a model bilayer in which two lipids in the outer leaflet, representing sphingomyelin and phosphatidylcholine, have a tendency to phase-separate, whereas two lipids in the inner leaflet, representing PS (phopshatidylserine) and PE (phosphatidylethanolamine), have a much weaker tendency to do so. Because PS and PE lipids are characterized by spontaneous curvatures that differ greatly (19), we coupled their local concentration difference to the height fluctuations of the bilayer.
Here we will discuss the simpler system of a symmetric bilayer consisting of only two components, A and B, and will consider a free energy that depends on only one order parameter. Denote ϕA(R) as the local concentration of the A component in the outer leaf and ϕB(R) as the local concentration of the other component in the same leaf. The local variable of interest is ϕ(R) ≡ [ϕA(R) – ϕB(R)]. The free energy, a functional of ϕ(R), is
| (1) |
where the integral is over the bilayer area . The local order parameter is 〈ϕ(R)〉, the thermodynamic average of ϕ(R). The chemical potential, μ, can be used to set the value of
to a specified value. For most of this article, we will set the chemical potential to zero so that there are equal amounts of the two components in the system. By a rescaling of length and energy, we can reduce the four parameters , , , and to two as follows. From the coefficients and , one forms the length L0 ≡. Therefore, we define the dimensionless position vector r ≡ R/L0, and take all derivatives with respect to the dimensionless coordinates. Further, we define the energy bkBT ≡ , where kB is Boltzmann’s constant, T is the temperature, and b is a positive dimensionless number of the order of unity. Finally, defining the dimensionless coefficients and , we arrive at the free energy functional
| (2) |
There are two parameters in this model. The first, a, when positive encourages a disordered phase, one in which 〈ϕ(r)〉 = 0 everywhere. When it is negative, it promotes a nonzero value of 〈ϕ(r)〉. The second parameter, τ, when positive, encourages the system to be spatially uniform. When it is negative, it promotes a spatially varying system. This free energy has been studied in several contexts (7,21–23).
Within mean-field theory, in which one simply minimizes the above free energy with respect to variations in ϕ(r), the phase diagram is easily calculated (21) and is shown in Fig. 1 for the system in which there are equal average concentrations of both lipids. There is a fluid phase that occurs for τ and a positive. It is characterized by a value of the order parameter that vanishes everywhere, 〈ϕ(r)〉 = 0. As the coefficient a decreases to zero for τ > 0, a continuous transition occurs to a region of coexistence between two liquids characterized by thermal averages of ϕ(r) that are uniform and nonzero, 〈ϕ(r)〉 = ϕ0. One liquid is rich in the first component, ϕ0 > 0, and the other is rich in the second, ϕ0 < 0. The transition occurs at a temperature Tc along the line given by a(Tc) = 0, τ ≥ 0. A modulated phase occurs for values of τ that are negative and sufficiently large in magnitude. Such negative values indicate that it is energetically favorable for the local composition difference to vary in space. When the system consists of equal amounts of each component, the modulated phase is a lamellar, or stripe, phase. The transition to it from the fluid phase is continuous and occurs along the line a = τ2/4, τ ≤ 0. At the transition, the lamellae are characterized by a wavevector of magnitude
The modulated phase and the two coexisting fluid phases can all coexist along a triple line which, for values of a that are negative but not too large, is given by
Along this line, the lamellar phase is characterized by the wavevector
Because the triple line is a line of first-order transitions, there is a Clausius-Clapeyron-like equation that relates coexisting Phases I and II. This relation, derived in the Appendix, is
| (3) |
where denotes the spatial average over the membrane of the thermal average 〈ϕ(r)2〉. Let us take Phase I to be the stripe phase, and Phase II to be either of the liquid phases with ϕ0 ≠ 0. In the uniform liquid phase is large, and larger than in the stripe phase, whereas is quite small, smaller than in the stripe phase. Hence, from Eq. 3, the slope da/dτ is positive, as shown.
Figure 1.

Phase diagram of the model calculated within the mean-field approximation, as a function of the two parameters a and τ. (Dashed lines) First-order transitions; (solid lines) continuous transitions. The region of macroscopic phase separation is denoted a two-phase coexistence. A modulated phase appears for τ = 0. (Dash-dot line) Lifshitz line. To the right of it, the fluid is an ordinary one; to the left of it, the fluid is a microemulsion.
The fluid phase can be further divided into an ordinary fluid and a fluid that is a microemulsion. They are distinguished by the location of the peak in the structure function
where ϕ(k) is the Fourier transform of ϕ(r). It is given by
In the ordinary fluid, for which τ ≥ 0, this function has a peak at k = 0, whereas in the microemulsion, for which τ ≤ 0, the peak occurs at . The line τ = 0 at which the peak in S(k) first moves away from zero is denoted the Lifshitz line. A similar distinction can be made between ordinary liquids and liquids that are microemulsions. Thus the Lifshitz line extends into the liquid region of the phase diagram. The phase diagram in mean-field theory is shown in Fig. 1. The point a = 0, τ = 0 at which the phase boundaries meet is denoted the Lifshitz point. We note that, within mean-field theory, the region of two-liquid phase coexistence is bounded by regions of a modulated phase and an ordinary fluid. This implies that if one took a system exhibiting macroscopic phase separation, and changed its parameters a or τ a small amount by some means, one could produce a system that exhibited a modulated phase or an ordinary fluid, but not a microemulsion.
The effect of thermal fluctuations is relatively mild on some aspects of this phase diagram. For example, it is well known that the continuous transition from the fluid to the region of two-phase coexistence is reduced in temperature. Their effect on the modulated phase depends upon the size of the system, and is severe in the thermodynamic limit of an infinite number of lipids, N, in an infinite area, , with a finite area per lipid /N. The long-range smectic order of the stripe phase is destroyed, just as is the smectic order of an array of two-dimensional sheets in a three-dimensional system (24). Even the orientational, nematic, order is destroyed (25). What remains is a phase in which the orientational correlations remain long-ranged in that they decay like a power law, rather than exponentially. Whether or not this phase coexists along a triple line with the two fluids characterized by ϕ0 > 0 and ϕ0 < 0 (i.e., whether the Lifshitz point remains) is not known (26–28).
In a finite-size system, such as a plasma membrane, one expects to see clear remnants of modulated phases even if their long-ranged order is weakened. We have explored the effects of thermal fluctuations in a finite system by following the evolution of the system according to the Langevin equation
| (4) |
| (5) |
The system is discretized into 128 × 128 points. We calculate the structure function, locate its maximum S(qmax,a) for a fixed τ and vary a. The maximum of S(qmax,a) as a function of a indicates the phase boundary. The phase diagram we obtain is shown in Fig. 2. Because of the finite size of the system, the location of transitions to the phase with very long modulations must be obtained by extrapolation. The phase space of the fluid phase, both ordinary and microemulsion, has increased from that obtained from mean-field theory. A major difference between the phase diagrams is that there is now a direct transition from the microemulsion to the two coexisting fluid phases, a transition that occurs when τ < 0. This transition could be continuous. But if it were, then on approaching the transition, we would observe one of two possible behaviors: Either the peak in the structure function would shift from nonzero to zero wavevector and the peak would diverge, or the peak at nonzero wavevector would remain but a second peak at zero wavevector would arise with the structure function diverging there. We observe neither behavior, but instead an abrupt shift in the peak in the structure factor as the phase boundary is crossed. This is what would be expected if the transition is a first-order one and the line of transitions a locus of three-phase coexistence between the microemulsion and the two liquid phases. Because the transition is first-order, Eq. 3 can be applied to it. Once again, the positive slope we obtain is in agreement with the microemulsion being characterized by large variations in the order parameter, i.e., a large value of , but a small value of , while the coexisting liquid phases are characterized by smaller variations in the concentration difference ϕ(r) about a larger average value. This direct, first-order, transition from microemulsion to liquid is in agreement with the phase behavior of a microscopic model of a two-dimensional ternary system with a line-active agent (26), and shows that this behavior is to be expected in systems producing a microemulsion by means other than a line-active agent. It is also in agreement with results of a similar model in three dimensions (28).
Figure 2.
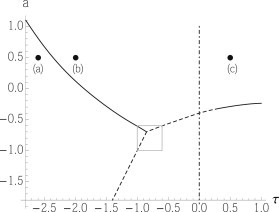
Phase diagram of the model including fluctuations as a function of the two parameters a and τ. (Dashed lines) First-order transitions; (solid lines) continuous transitions. Phase boundaries within the boxed region are extrapolations from the regions outside. The parameter b has been set to 4.0. (Dash-dot line) Lifshitz line. (Dots a–c) Systems whose representative configurations are shown in Fig. 3.
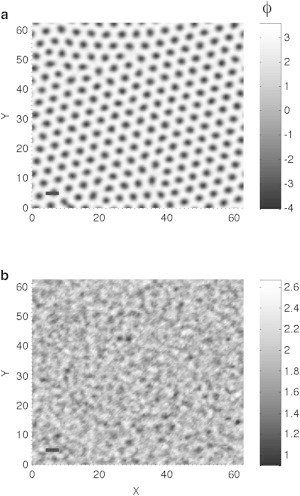
A representative configuration is shown in Fig. 3 a of the modulated, stripe, phase. The location of the system is a = 0.5 and τ = −2.6, and is shown by a dot in Fig. 2. The scale bar shows the characteristic size of the lamellae, . If we identify this size with that brought about by the coupling of fluctuations in the bilayer and its composition, a characteristic size of ∼100 nm (8), then we have simulated a system on the order of a micron. Fig. 3 b shows a representative configuration for a system at a = 0.5, τ = −2.0 in the microemulsion phase. Its location is also shown in Fig. 2. The droplets of regions with 〈ϕ(r)〉 > 0 and 〈ϕ(r)〉 < 0 are clear. Again the characteristic scale is shown. A representative configuration is shown in Fig. 3 c for a system in the normal fluid phase with a = 0.5, τ = 0.5, a location indicated in Fig. 2. There are still droplets in which 〈ϕ(r)〉 has fluctuated to positive or negative values, but the magnitude of 〈ϕ(r)〉, which corresponds to the magnitude of the difference in concentration in the fluctuation, is smaller. It is easily appreciated from a comparison of Fig. 3, b and c, that the distinction between the microemulsion and ordinary fluid is an arbitrary one because there is no singularity in the free energy in passing from one to the other. We have adopted the experimentally accessible criterion that the microemulsion is distinguished by the peak in the structure function being at a nonzero value.
Figure 3.

Representative configurations from different phases of the system. The parameter b is set to 4. (a) The location of the system is a = 0.5 and τ = −2.6, and the system is in the stripe phase. (b) The location of this system is a = 0.5, τ = −2.0. The system is a microemulsion. (c) a = 0.5 and τ = 0.5. The system is an ordinary fluid. These three systems are indicated in the phase diagram of Fig. 2. (Bar, lower-left corner) Characteristic size .
In systems where there is considerably more of one lipid component than of the other, the modulated phase is a hexagonal one. We put the system into this phase by adjusting the parameters a and τ and utilizing a sufficiently large chemical potential. A representative configuration of this phase is shown in Fig. 4 a for the system at a = 0, τ = −5.5. At the same chemical potential and a, and at a value of τ ≈ −5.4, the hexagonal phase melts to a microemulsion via a first-order transition. There is a discontinuity in . A representative configuration of the microemulsion at the same chemical potential but larger value of τ ≈ −5.3 is shown in Fig. 4 b. It is noteworthy that the contrast between the background and the amplitude of fluctuating droplets in this microemulsion is not as great as in Fig. 3 b, the case in which there are equal amounts of the components and the nearby modulated phase is striped. Perhaps this is because the fluctuations in the microemulsion near the hexagonal phase are not expected to be as great as those in the microemulsion near the stripe phase. This is reflected in the fact that, in mean-field theory, the transition from the stripe phase with equal amounts of components to microemulsion is a continuous one, whereas that from the hexagonal phase to microemulsion is first-order.
Figure 4.
Representative configurations from different phases of the system that contains more of one component that the other. The parameter b and μ are set to 2/3 and 7, respectively. (a) The location of the system is a = 0.0 and τ = −5.5, and the system is in the hexagonal phase. (b) The location of this system is a = 0.0, τ = −5.3. The system is a microemulsion. (Bar, lower-left corner) Characteristic size.
Discussion
We have considered the effect of fluctuations on a particularly simple model for the behavior of multicomponent membranes. It depends essentially on two parameters: the first, a, is a measure of whether thermal energies at biological temperatures are greater or lesser than the interaction energies between components. Therefore it determines whether the system will be ordered or disordered. The second parameter, τ, determines whether the order will be expressed as macroscopic separation of two uniform phases, liquid-ordered and liquid-disordered, or as one modulated phase. Similarly, it determines whether the disorder will be expressed as an ordinary uniform fluid or as a microemulsion. Both of these parameters depend, of course, upon the membrane composition. For example, the effect of changing the parameter a at a relatively fixed τ might, in our interpretation, be well illustrated by the experiments carried out in vitro by Konyakhina et al. (4). They observed that whereas the ternary system of DSPC/DOPC/Chol (distearoylphosphatidylcholine/dioleoylphosphatidylcholine/cholesterol) exhibits macroscopic phase separation at 23°C (29,30), that of (DSPC/POPC 1-palmitoyl, 2-oleoylphosphatidylcholine)/Chol) does not (30). To determine the pathway between these two systems, they examined the system consisting of the four components DSPC, DOPC, POPC, and cholesterol, and varied the relative concentrations of DOPC and POPC in the mixture. They found that the system did not pass directly from a uniform fluid phase to a macroscopically phase-separated one, but instead it passed from the uniform fluid to a modulated phase and from there to the macroscopically separated phases. An increase in the amount of DOPC relative to that of POPC raises the transition temperature of phase separation because the former is more disordered than the latter. The effect is equivalent to lowering the actual temperature with respect to the transition temperature or, in our model, to decreasing the value of the parameter a. As illustrated in Fig. 5, the sequence of phases observed experimentally is exactly that expected if the system were characterized by a negative value of τ. What mechanism brings about this negative value, however, remains an open question to which a few answers have been proposed. These include the presence of a line-active agent, the coupling of composition fluctuations to those in the height of the membrane itself, or to its thickness (4,7,8,10,13,14,20,31,32). Irrespective of the mechanism, from the scenario above, we would conclude that the phase appearing to be uniform in the experiment is a microemulsion.
Figure 5.
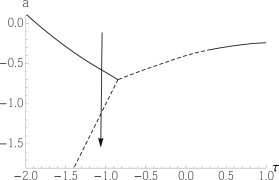
Phase diagram of Fig. 2 shown with a phase trajectory that passes from a fluid to a modulated phase to phase separation as the parameter a is decreased. The fluid in which the trajectory begins is a microemulsion.
Our results show that one effect of thermal fluctuations is to bring about the possibility that a system exhibiting a macroscopic phase separation into two liquids can, by a small change in its parameters a or τ, now exhibit a microemulsion instead. What might bring about such a change? We note that the parameters a and τ are expected to depend not only on the average membrane composition, but also on the difference of the composition of the two leaves. For example, it is known experimentally (33,34) and theoretically (35,36) that whereas a symmetric bilayer may display phase separation, an asymmetric bilayer in which one of its leaves is replaced by another with little tendency to separate, may not. In terms of our parameters, the symmetric system may be characterized by a more-negative value of a than the asymmetric one. Furthermore if, in the asymmetric bilayer, the PE were predominantly in one leaf, we would expect the coupling to height fluctuations to be stronger in the asymmetric bilayer than in the symmetric one (20). Thus, the asymmetric bilayer would be characterized by a larger value of a and a smaller and perhaps more-negative value of τ than the symmetric bilayer. From the phase diagram of Fig. 2, we may speculate that the reason that yeast vacuoles display both modulated phases and coexisting uniform phases (3), whereas yeast plasma membranes exhibit only ordered networks that may be modulated phases (2), is because the bilayers of the former are symmetric whereas that of the latter are not, just as mammalian plasma membrane bilayers are not. To our knowledge, the relative compositions of the two leaves of these yeast membranes are not known. Taking this one step further, we may speculate that the difference in composition of mammalian plasma membrane is greater than that in yeast plasma membrane so that the value of a is even more positive. Consequently the mammalian plasma membrane does not exhibit modulated phases, but is disordered. In this picture, the disordered phase would most likely be a microemulsion.
In summary, the model we have explored illustrates how differences in bilayer composition could lead to three behaviors exhibited in biological membranes and provides a unified description of them: phase separation in yeast vacuoles (3); modulated phases in yeast vacuoles and plasma membrane (2); and heterogeneous raft behavior in mammalian plasma membrane that, from our model, we would assign to a microemulsion.
Acknowledgments
We are grateful for insights and information freely imparted to us by colleagues and students, particularly Matt Blosser, Bertil Hille, Ha Giang, Sarah Keller, and Alex Merz. We also acknowledge useful conversations with Marcus Müller, David Andelman, and Shige Komura.
The work of M.S. is supported in part by the National Science Foundation under grant No. DMR-1203282. R.S. acknowledges support from the Raymond and Beverly Sackler Foundation.
Appendix
We consider the free energy that results from minimizing F[ϕ] of Eq. 2 to be a function of the area A and the three intensive fields T, a, and τ: = (T, a, τ, A). Its differential is given by
where the brackets denote an average over the area of the ensemble average. The entropy is S and the surface free energy is σ. We consider a system at constant area and temperature. Two phases, I and II, which coexist, do so at the same values of a and τ. Therefore their free energies are equal. Now consider a point 1 along the coexistence curve at a and τ and a nearby point, 2, at a + δa and τ + δτ. Because the free energies of the two phases are equal at point 1 and are also equal at point 2, the change in free energy from 1 to 2 is the same whether one goes along coexistence in Phase I or in Phase II. Equating the changes in free energies evaluated traversing coexistence in Phase I and in Phase II, we obtain
In the limit of infinitesimal changes, this yields Eq. 3,
| (6) |
Remarks
After the submission of our article, we learned that a Monte Carlo simulation of a lipid bilayer, with composition explicitly coupled to curvature, also indicates a direct transition from the microemulsion to the two liquid phases, in agreement with the results we have presented here (S. Sadeghi, M. Müller, and R. C. L. Vink, personal communication).
References
- 1.Lingwood D., Simons K. Lipid rafts as a membrane-organizing principle. Science. 2010;327:46–50. doi: 10.1126/science.1174621. [DOI] [PubMed] [Google Scholar]
- 2.Spira F., Mueller N.S., Wedlich-Söldner R. Patchwork organization of the yeast plasma membrane into numerous coexisting domains. Nat. Cell Biol. 2012;14:640–648. doi: 10.1038/ncb2487. [DOI] [PubMed] [Google Scholar]
- 3.Toulmay A., Prinz W.A. Direct imaging reveals stable, micrometer-scale lipid domains that segregate proteins in live cells. J. Cell Biol. 2013;202:35–44. doi: 10.1083/jcb.201301039. [DOI] [PMC free article] [PubMed] [Google Scholar]
- 4.Konyakhina T.M., Goh S.L., Feigenson G.W. Control of a nanoscopic-to-macroscopic transition: modulated phases in four-component DSPC/DOPC/POPC/Chol giant unilamellar vesicles. Biophys. J. 2011;101:L8–L10. doi: 10.1016/j.bpj.2011.06.019. [DOI] [PMC free article] [PubMed] [Google Scholar]
- 5.Goh S.L., Amazon J.J., Feigenson G.W. Toward a better raft model: modulated phases in the four-component bilayer, DSPC/DOPC/POPC/CHOL. Biophys. J. 2013;104:853–862. doi: 10.1016/j.bpj.2013.01.003. [DOI] [PMC free article] [PubMed] [Google Scholar]
- 6.Schroeder R., London E., Brown D. Interactions between saturated acyl chains confer detergent resistance on lipids and glycosylphosphatidylinositol (GPI)-anchored proteins: GPI-anchored proteins in liposomes and cells show similar behavior. Proc. Natl. Acad. Sci. USA. 1994;91:12130–12134. doi: 10.1073/pnas.91.25.12130. [DOI] [PMC free article] [PubMed] [Google Scholar]
- 7.Hirose Y., Komura S., Andelman D. Concentration fluctuations and phase transitions in coupled modulated bilayers. Phys. Rev. E Stat. Nonlin. Soft Matter Phys. 2012;86:021916. doi: 10.1103/PhysRevE.86.021916. [DOI] [PubMed] [Google Scholar]
- 8.Schick M. Membrane heterogeneity: manifestation of a curvature-induced microemulsion. Phys. Rev. E Stat. Nonlin. Soft Matter Phys. 2012;85:031902–031904. doi: 10.1103/PhysRevE.85.031902. [DOI] [PubMed] [Google Scholar]
- 9.Gompper G., Schick M. Academic Press; San Diego, CA: 1994. Self-Assembling Amphiphilic Systems. [Google Scholar]
- 10.Brewster R., Pincus P.A., Safran S.A. Hybrid lipids as a biological surface-active component. Biophys. J. 2009;97:1087–1094. doi: 10.1016/j.bpj.2009.05.051. [DOI] [PMC free article] [PubMed] [Google Scholar]
- 11.Ekroos K., Ejsing C.S., Shevchenko A. Charting molecular composition of phosphatidylcholines by fatty acid scanning and ion trap MS3 fragmentation. J. Lipid Res. 2003;44:2181–2192. doi: 10.1194/jlr.D300020-JLR200. [DOI] [PubMed] [Google Scholar]
- 12.Husen P., Tarasov K., Ejsing C.S. Analysis of lipid experiments (ALEX): a software framework for analysis of high-resolution shotgun lipidomics data. PLoS ONE. 2013;8:e79736. doi: 10.1371/journal.pone.0079736. [DOI] [PMC free article] [PubMed] [Google Scholar]
- 13.Yamamoto T., Brewster R., Safran S. Chain ordering of hybrid lipids can stabilize domains in saturated/hybrid/cholesterol lipid membranes. Euro. Phys. Lett. 2010;91 [Google Scholar]
- 14.Palmieri B., Safran S.A. Hybrid lipids increase the probability of fluctuating nanodomains in mixed membranes. Langmuir. 2013;29:5246–5261. doi: 10.1021/la4006168. [DOI] [PubMed] [Google Scholar]
- 15.Heberle F., Doctorova M., Feigenson G.W. Hybrid and nonhybrid lipids exert common effects on membrane raft size and morphology. J. Am. Chem. Soc. 2013;135:14932–14935. doi: 10.1021/ja407624c. [DOI] [PubMed] [Google Scholar]
- 16.Seul M., Andelman D. Domain shapes and patterns: the phenomenology of modulated phases. Science. 1995;267:476–483. doi: 10.1126/science.267.5197.476. [DOI] [PubMed] [Google Scholar]
- 17.Leibler S. Curvature instability in membranes. J. Phys. 1986;47:507–516. [Google Scholar]
- 18.Leibler S., Andelman D. Ordered and curved meso-structures in membranes and amphiphilic films. J. Phys. 1987;48:2013–2018. [Google Scholar]
- 19.Kollmitzer B., Heftberger P., Pabst G. Monolayer spontaneous curvature of raft-forming membrane lipids. Soft Matter. 2013;9:10877–10884. doi: 10.1039/C3SM51829A. [DOI] [PMC free article] [PubMed] [Google Scholar]
- 20.Shlomovitz R., Schick M. Model of a raft in both leaves of an asymmetric lipid bilayer. Biophys. J. 2013;105:1406–1413. doi: 10.1016/j.bpj.2013.06.053. [DOI] [PMC free article] [PubMed] [Google Scholar]
- 21.Hornreich R., Luban M., Shtrikman S. Critical behavior at the onset of k-space instability along the λ line. Phys. Rev. Lett. 1975;35:1678–1681. [Google Scholar]
- 22.Swift J., Hohenberg P. Hydrodynamic fluctuations at the convective instability. Phys. Rev. A. 1977;15:319–328. [Google Scholar]
- 23.Sunil Kumar P.B., Gompper G., Lipowsky R. Modulated phases in multicomponent fluid membranes. Phys. Rev. E Stat. Phys. Plasmas Fluids Relat. Interdiscip. Topics. 1999;60(4 Pt B):4610–4618. doi: 10.1103/physreve.60.4610. [DOI] [PubMed] [Google Scholar]
- 24.Caillé A. Notes on x-ray scattering in smectic A [Remarques sur la diffusion des rayons X dans les smectiques A] C. R. Acad. Sci. Paris. 1972;B274:891. [Google Scholar]
- 25.Toner J., Nelson D. Smectic, cholesteric, and Rayleigh-Bernard order in two dimensions. Phys. Rev. B. 1981;23:316–334. [Google Scholar]
- 26.Gompper G., Schick M. Lattice model of microemulsions: the effect of fluctuations in one and two dimensions. Phys. Rev. A. 1990;42:2137–2149. doi: 10.1103/physreva.42.2137. [DOI] [PubMed] [Google Scholar]
- 27.Matsen M.W., Sullivan D.E. Lattice model for microemulsions in two dimensions. Phys. Rev. A. 1992;46:1985–1991. doi: 10.1103/physreva.46.1985. [DOI] [PubMed] [Google Scholar]
- 28.Levin Y., Mundy C.J., Dawson K.A. Renormalization of a Landau-Ginzburg-Wilson theory of microemulsion. Phys. Rev. A. 1992;45:7309–7319. doi: 10.1103/physreva.45.7309. [DOI] [PubMed] [Google Scholar]
- 29.Zhao J., Wu J., Feigenson G. Phase studies of model biomembranes: macroscopic coexistence of Lα + Lβ, with light-induced coexistence of Lα and lo phases. Biochim. Biophys. Acta. 2007;1768:2777–2786. doi: 10.1016/j.bbamem.2007.07.009. [DOI] [PMC free article] [PubMed] [Google Scholar]
- 30.Heberle F.A., Wu J., Feigenson G.W. Comparison of three ternary lipid bilayer mixtures: FRET and ESR reveal nanodomains. Biophys. J. 2010;99:3309–3318. doi: 10.1016/j.bpj.2010.09.064. [DOI] [PMC free article] [PubMed] [Google Scholar]
- 31.Meinhardt S., Vink R.L., Schmid F. Monolayer curvature stabilizes nanoscale raft domains in mixed lipid bilayers. Proc. Natl. Acad. Sci. USA. 2013;110:4476–4481. doi: 10.1073/pnas.1221075110. [DOI] [PMC free article] [PubMed] [Google Scholar]
- 32.Amazon J.J., Goh S.L., Feigenson G.W. Competition between line tension and curvature stabilizes modulated phase patterns on the surface of giant unilamellar vesicles: a simulation study. Phys. Rev. E Stat. Nonlin. Soft Matter Phys. 2013;87:022708–022710. doi: 10.1103/PhysRevE.87.022708. [DOI] [PubMed] [Google Scholar]
- 33.Collins M.D., Keller S.L. Tuning lipid mixtures to induce or suppress domain formation across leaflets of unsupported asymmetric bilayers. Proc. Natl. Acad. Sci. USA. 2008;105:124–128. doi: 10.1073/pnas.0702970105. [DOI] [PMC free article] [PubMed] [Google Scholar]
- 34.Kiessling V., Crane J.M., Tamm L.K. Transbilayer effects of raft-like lipid domains in asymmetric planar bilayers measured by single molecule tracking. Biophys. J. 2006;91:3313–3326. doi: 10.1529/biophysj.106.091421. [DOI] [PMC free article] [PubMed] [Google Scholar]
- 35.Wagner A.J., Loew S., May S. Influence of monolayer-monolayer coupling on the phase behavior of a fluid lipid bilayer. Biophys. J. 2007;93:4268–4277. doi: 10.1529/biophysj.107.115675. [DOI] [PMC free article] [PubMed] [Google Scholar]
- 36.Putzel G.G., Schick M. Phase behavior of a model bilayer membrane with coupled leaves. Biophys. J. 2008;94:869–877. doi: 10.1529/biophysj.107.116251. [DOI] [PMC free article] [PubMed] [Google Scholar]