

Abstract
An individual-based, mass-spring modeling framework has been developed to investigate the effect of cell properties on the structure of biofilms and microbial aggregates through Lagrangian modeling. Key features that distinguish this model are variable cell morphology described by a collection of particles connected by springs and a mechanical representation of deformable intracellular, intercellular, and cell-substratum links. A first case study describes the colony formation of a rod-shaped species on a planar substratum. This case shows the importance of mechanical interactions in a community of growing and dividing rod-shaped cells (i.e., bacilli). Cell-substratum links promote formation of mounds as opposed to single-layer biofilms, whereas filial links affect the roundness of the biofilm. A second case study describes the formation of flocs and development of external filaments in a mixed-culture activated sludge community. It is shown by modeling that distinct cell-cell links, microbial morphology, and growth kinetics can lead to excessive filamentous proliferation and interfloc bridging, possible causes for detrimental sludge bulking. This methodology has been extended to more advanced microbial morphologies such as filament branching and proves to be a very powerful tool in determining how fundamental controlling mechanisms determine diverse microbial colony architectures.
Introduction
Modeling of microbial interactions in biological aggregates (e.g., microbial biofilms, granules, and flocs) is a very powerful method to analyze the role of fundamental controlling factors in defining relations between structure and function in mixed microbial populations. Numerical models help predict different structural and functional aspects, such as shape and size of the aggregate, development of a certain spatial distribution of microbial populations and extracellular polymeric substances (EPS), or the impact of specific mechanisms such as gene transfer, microbial motility, or cell-cell signaling.
The two basic approaches taken for modeling microbial aggregates are based on a continuum or on an individual representation of the microbial community. Continuum-based models use a volume-averaged description of the biomass composing the biofilm. Starting from the now widely applied 1D continuum models (1), more complex 2D and 3D continuum multispecies biofilm models have been proposed (see, e.g., Alpkvist and Klapper (2) and Merkey et al. (3)). Alternatively, in individual-based models (IbM), biofilms are represented as a collection of individual microbes or functional elements (agents), whereas substrate transport/reaction and hydraulic flow are solved separately in a continuum field (see, e.g., Kreft et al. (4) and Lardon et al. (5)). Models combining continuum (for EPS) with individual (for microbial cells) representations have also been developed (6). Both approaches are suitable for investigating mixed-population aggregates, with IbMs generally being superior for investigating the impact of interactions at microbe level, whereas the continuum-based approach is still more applicable at larger geometric scales (7).
IbM of microbial populations has allowed the spatial investigation of the role of intra- and extracellular polymer substances (5,8,9), gene transfer (10,11), cell-cell communication and quorum sensing (12–14), microbial motility (15–17), antibiotic resistance and survival of persister cells (18), and substrate transfer effects on many different microbial ecology interactions (competition, mutualism, parasitism, toxicity, cross-feeding, etc.) (19–22). Inclusion of solute reaction-transport models also allows for detailed analysis of the impact of fundamental constraints, such as thermodynamic substrate and product concentration limits, or diffusive flux on larger aggregates and engineered and environmental systems as a whole (20).
A key challenge in IbM has been determining how the positions of the agents change over time, which at a higher level determines how the microbial colonies spread and change in shape, size, and microbial ecology. In approaching this essential mechanical problem, the existing microbial community models are often limited in their complexity in one or more of the following ways.
-
1.
Only simple microbial geometries are applied, either spheres or cylinders.
-
2.
Structural properties of the aggregate are not determined by the actions of individual agents, but are imposed on a collection of agents.
-
3.
Rigid connections are used for intra- or intercellular links.
Microbial morphology consists of essentially two elements: primary morphology refers to cell shape (e.g., cocci are spherical cells, bacilli are rod-shaped, etc.), whereas secondary morphology is related to division mode and subsequent sibling connections (e.g., strings of streptococci, grapelike staphylococci colonies, sarcina tetrads, filamentous bacilli, branched filamentous streptomyces, etc.). The simplest shape (i.e., a sphere in 3D or a circle in 2D) for a microbial cell allows for ready computation of division and anticollision (4,23), but it brings serious limitations when describing a series of other aspects numerically, as it can be easily observed that cells have a wide variety of morphologies (24). For example, bacilli (rod-shaped cells) may have a different response to substrate concentrations compared to cocci (sphere-shaped cells), as rods have a larger surface/volume ratio than spheres. Rod-shaped cells also transfer genes differently when they are positioned side by side than when they are perpendicular to each other (10). Interspecies or microbe-surface electron transfer can also be influenced by cell shape and the way cells connect in a filamentous microcolony (25). It is also hypothesized that specific coaggregation between cells with different morphology (e.g., filamentous actinomycetes with streptococci or lactobacilli) is essential in the formation of complex food webs, such as in dental plaque (26)). Cell morphology also strongly affects the shape of the aggregate. For example, an array of filamentous rod-shaped cells can form a longer, more slender, and more rigid filament than the equivalent number of spherical cells. Therefore, understanding how filamentous microorganisms influence aggregates is very important in the development of activated sludge flocs used in water treatment (27,28). Real-world functionality of morphology infers that different cell shapes should also be included in agent-based modeling, particularly where interactions between individual cells are being investigated.
In a coarse-grain representation of the biofilm microbial structure, grouping of cells as a collection (cluster) and modeling only the interactions between different clusters would remove interactions between individual cells that could otherwise have a crucial effect on the aggregate structure. Nitrifying biofilms are one typical example where clustering is important, with ammonium- and nitrite-oxidizing organisms typically organized in spherical clusters (6,29). This clustering would be more easily modeled using structural elements (e.g., strong adhesion forces between sibling cells).
In a mechanical model of microbial aggregates, the function of extracellular polymers is mainly to act as an elastic link between particles. Including biofilm structural components such as EPS as hard spherical objects (5,30,31) or rigid links (32) may introduce artifacts related to the volumetric occupation and to the actual rheological properties of the polymeric matrix. Rather, in concordance with the particle-spring representation of microbial cells, the EPS matrix could be described by a collection of springs connecting a series of cells.
In-depth numerical methods for simulating microbial growth and the resulting structures at the cell and cluster levels (e.g., the cellular Potts model (32,33)) are readily available in the literature. Particle-spring approaches have long been used in chemistry to model molecular interactions, for example, in proteins using amino acid subunits (34). Particle-spring models have been used for maintaining an elastic cell shape and allowing for deformable cell-cell and cell-particulate connections in biofilms (17,35). More recently, these models have been constructed to explain patterns developed during the social movement of myxobacteria (16,17), where populations of flexible, gliding rod-shaped cells were shown to form specific patterns as a function of the various forces acting on each bacterial body as it is subjected to multiple cell-cell interactions. By a similar method, large populations of long, flexible filamentous cells of gliding cyanobacteria were modeled and the effectiveness of photophobic responses in this population was quantified (36). Recently, growth and colony formation of zigzagged Diatoma chains in contrasting flow environments have also been modeled with a particle-spring model (37). However, the approach of modeling heterogeneous biofilms with growing microorganisms of variable morphology has not been previously addressed.
To address some of the restrictions in existing IbMs, we have developed a variable-morphology physics-based approach for modeling microbial communities. The cell shape, as well as the cell aggregate morphology, is provided by a particle-spring approach in an overall Lagrangian approach, allowing inheritance of morphological and other properties. This approach has been applied to simple single- and mixed-population systems.
Model Description
The numerical model is designed to simulate formation of complex microbial community structures (e.g., biofilms, biological flocs) based on mechanical interactions between cells with variable primary, secondary, and tertiary morphology (e.g., cocci, bacilli, and filaments). This section describes the modeling approach for the elemental components (subcellular agents) as well as for primary (cellular), secondary (cell-descendants), and tertiary (intercellular/environmental) relationships between microbial cells.
Components and structure
Elemental components: particles and springs
The basic model elements are particles (mass agents) connected by massless springs. Each particle is characterized by three state variables: mass (m), velocity (v), and position (p). Springs join particles to each other or to fixed reference points (e.g., a biofilm substratum) and have a characteristic spring constant, ks, and a rest length, Lsrest. A microbial cell can consist of one particle (in the case of spherical cells) or of multiple particles connected by intracellular springs (for rods and more complicated geometries). Cells can also be linked by intercellular springs into filaments. Further links connect cells and filaments into higher-level structures such as aggregates, biofilms, or flocs.
All springs used in this model are linearly elastic, following Hooke’s Law. Equation 1 describes the force in a spring connecting two particles:
| (1) |
where Fs is the force acting on particle a, ks is the spring constant, Ls is a vector describing the relative position of particle a with respect to the position of particle b (i.e., Ls = pb − pa), Ls is the length (norm) of vector Ls, and is the rest length of the spring. The force acting on particle b is −Fs.
Primary structures: cell types
The primary structure defines the shape of individual cells. Different cellular geometries can be defined by connecting particles with springs. Cocci are spherical microbes, represented in the model by single particles with diameter Ds. Bacilli are rod-shaped cells, represented by two particles with fixed diameter, Dr, connected by a stiff spring with variable rest length, (see Fig. 1 A). If flexible cell bodies or other shapes (e.g., bacteria with different aspect ratios Lr/Dr, helical bacteria, spirochetes, etc.) are of interest, these could be modeled by multiple particles connected by different settings of elastic and angular springs (16,17,34).
Figure 1.
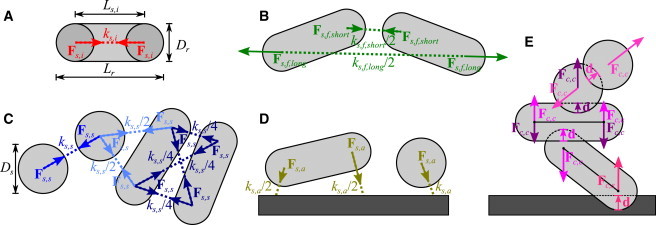
Forces acting on the mass particles. (A) Internal spring forces, Fs,i, in rod-shaped cells. (B) Short and long filial spring forces, Fs,f, in rod-shaped cells. (C) Sticking spring forces, Fs,s, using four springs between rod-shaped cells, two springs between a rod-shaped and a spherical cell, and one spring between spherical cells. (D) Anchoring forces, Fs,a. (E) Collision response forces between rod-shaped cells, spherical cells, and rod-shaped and spherical cells, Fc,c, and between cell and substratum, Fc,s. In addition to the forces shown in the figure, drag acts on all particles opposing the direction of movement. Force vectors are added to a resultant force vector for each mass particle. Spring constants (ks) are scaled for the number of springs in that link. To see this figure in color, go online.
Microbial cells have an inherent density, ρ, but their mass changes during cell growth, leading to a change in cell shape or size. The spherical cell diameter, Ds, can be calculated as . Rod-shaped cells are assumed to have a diameter Dr that does not change as the cell grows and an internal spring rest length that changes as a function of the current microbial mass, so that the cell density remains constant. A rod-shaped cell consists of two half-spheres and an open-ended cylinder, so that the internal spring rest length is set by the mass via . A stiff internal spring (high ks,i value) keeps the actual spring length (Ls,i) approximately at the desired spring length (), so that the cell length can be described by .
Secondary structures: filial links
The secondary structure defines microbial assemblies related by filial links between immediate siblings. Examples include diplococci and diplobacilli (pairs of spheres or rods), streptococci and streptobacilli (filaments of spheres or rods through division along a single plane), and sarcina and tetrads (square and cubic structures formed by division of cocci along two and three planes, respectively (38)). Less structured links lead to staphylococci clusters (grapelike structures) and palisade bacilli. In this article, only modeling of straight and branched rod filaments is illustrated, but filaments of spherical cells can easily be implemented using sets of filial springs.
Straight filaments of rods can be created in several ways. Short head-to-tail springs ensure that cells will remain connected by inducing the elastic force, Fs,f,short (a function of ks,f,short and Ls,f,short; see Eq. 1 and Fig. 1 B). The angle between cells can be controlled by adding longer-range springs with the elastic force Fs,f,long. By changing the difference in rest length of the two springs, the filament rigidity (i.e., the resistance to chain bending) and the gap between two bacilli in a filament can be readily controlled. The rest length for filament springs between two cells A and B is a function of the internal spring rest lengths of the cells ( and ) and diameter Dr. In addition, spring length factors (ls,short and ls,long) control the size of the gap between cells. For straight filaments, the rest length is given by and .
Filament branching is implemented in a similar way. In a branch joint, two sets of springs are created from newly branched cell A to neighboring cells B and C. The joint between cell A and cell B is described by a set of springs with rest lengths and , where ls,f,branch = 0.5(ls,f,short + ls,f,long). By substituting the internal spring rest length of cell C for that of B, the springs in the joint between A and C can be described.
The set of a short and a long spring is very similar to the use of an angular spring. By setting the relative spring length, the stiffness of the filaments and branches can be maintained, thus allowing a high versatility in defining and maintaining secondary structures.
Tertiary structures: sticking and anchoring links
In this model, nonfilial cell-cell and cell-substratum links are called tertiary links and include sticking and anchoring connections for cell-cell and cell-substratum links, respectively. These links may describe the adhesive forces created by EPS (see Burdman et al. (39) and references therein), thus enabling aggregation of biomass.
Sticking links form an elastic matrix by creating cell-cell bonds with the number of springs depending on cell morphology. One spring is needed for sphere-to-sphere, two springs for sphere-to-rod, and four springs for rod-to-rod connections (Fig. 1 C) to fully satisfy geometric degrees of freedom. This approach allows for implicit modeling of elasticity and strength of the sticking-link matrix, without actually defining the mass of the EPS. Tertiary structure linear springs generate forces Fs,s with rest length defined by (Eq. 1). The spring constants, ks,s, are scaled for the number of springs involved in the link (ks,s/Ns,s).
Cell-substratum bonds play an important role in the tertiary biofilm structure. These links are modeled using anchoring forces Fs,a, characterized by ks,a/Ns,a and . A sphere is fixed using a single spring, whereas rods require two springs to be immobilized so that all rotational degrees of freedom are eliminated (Fig. 1 D). The locations on the substratum at which the springs are fixed are determined by projecting the position of the cell particles along the vertical axis onto the horizontal plane.
Collision response
During growth and division, cells will collide with each other and with the substratum. To avoid overlapping cells, a collision detection mechanism was implemented, and collision response forces are applied on overlapping particles.
Collision detection is handled by factorial checking of all cell pairs, with proximity and factorial elimination used to minimize checks. Routines detect collision events (40) by calculating the distance, δ, for point-point (two spherical cells), line-segment-point (a spherical and a rod-shaped cell), line-segment-line-segment (two rod-shaped cells), and point-plane (particle-substratum). For two cells A and B, the collision detection functions return the overlap vector d = (DA + DB)/2 − δ, which provides distance and direction of overlap. Collision response is based on elastic repulsion of colliding objects, by adding forces Fc,c = kc,c d whenever overlap is detected, where kc,c is the cell-cell collision coefficient. For spherical cells, the collision response force, Fc,c, will act in the sphere center. For rod-shaped cells, Fc,c is distributed proportionally between the two particles according to the inverse of the distance between collision point and particle (Fig. 1 E).
In a similar way, for cell-substratum collision, the force Fc,s is introduced with a coefficient kc,s.
DLVO force
Cells in proximity to a planar substratum encounter an attractive van der Waals force (FvdW ∝ −d−2, where d is the distance between cell surface and substratum) and a repulsive electrostatic force (FR ∝ κe−κd, where κ is the inverse Debye length) (41). The combination of the van der Waals and electrostatic force is called the DLVO force (FDLVO = CESκe−κd − CvdWd−2, with key constants CES and CvdW), after the surname initials of the researchers who independently formulated the theory (Derjaguin and Landau, Verwey and Overbeek). DLVO forces allow cells to maintain a fixed stable distance from the substratum, usually on the order of a few nanometers (reversible adhesion). If a cell overcomes the repulsive force and further approaches the substratum, the attractive force becomes dominant again and pulls the cell onto the substratum (irreversible adhesion). Because other forces in the model operate on the micrometer scale, the DLVO forces can make the numerical model stiff. To minimize model stiffness, the norm of d in the DLVO force is set to have a lower limit of 6/κ, even if the actual distance between cell surface and substratum is smaller.
Model processes
The major processes included in the model are i), cell growth and division, and ii), particle movement and link reorganization to achieve mechanical relaxation. When needed, other processes could be introduced in this framework (see Discussion).
Cell growth
In the model, increase in cell size is driven by an increase in cell mass, assuming constant cell density. Spherical cells can only grow in diameter, whereas rod-shaped cells grow only in length, maintaining a fixed diameter (46,47).
Mass change for a single cell is the result of specific microbial growth rate (μ) (48), so that the increase in mass is described by dm/dt = μm. For rod-shaped cells, the mass is distributed equally over the two particles comprising a cell. For this study, the specific growth rate is generated randomly for each growth step and for each cell, following a normal distribution around the mean with a standard deviation (see Table 1). Because the scope of this framework is the microbial community structure, other factors affecting the net growth rate are not taken into account in this study (e.g., biomass decay and starvation that lead to cell mass decrease, substrate limitation, and product/substrate inhibition, etc.).
Table 1.
Model parameters
| Parameter | Symbol | Default value | Units | Reference |
|---|---|---|---|---|
| Internal springs | ||||
| Spring constant | ks,i | 5 × 10⁻¹¹ | N m−1 | |
| Filial links (E. coli) | ||||
| Short spring spring constant | ks,f,short | 5 × 10⁻¹³ | N m−1 | |
| Long spring spring constant | ks,f,long | 5 × 10⁻¹³ | N m−1 | |
| Stretch limit | df,break | 1 | μm | |
| Short spring relative length | lf,short | 0.5 | — | |
| Long spring relative length | lf,long | 1.7 | — | |
| Filial links (activated sludge) | ||||
| Short spring spring constant | ks,f,short | 2 × 10⁻¹¹ | N m−1 | |
| Long spring spring constant | ks,f,long | 2 × 10⁻¹¹ | N m−1 | |
| Stretch limit | df,break | 2 | μm | |
| Short spring relative length | lf,short | 0.5 | — | |
| Long spring relative length | lf,long | 1.7 | — | |
| Sticking links (activated sludge) | ||||
| Spring constant | ks,s | 1 × 10⁻¹¹ | N m−1 | |
| Formation limit | ds,form | 0.5 | μm | |
| Stretch limit | ds,break | 1 | μm | |
| Anchoring links (E. coli) | ||||
| Spring constant | ks,a | 1 × 10⁻¹¹ | N m−1 | |
| Formation limit | da,form | 0.5 | μm | |
| Stretch limit | da,break | 1 | μm | |
| DLVO forces (E. coli) | ||||
| Electrostatic force grouped constants | CES | 1 × 10⁻²² | N m | |
| Van der Waals force grouped constants | CvdW | 1 × 10⁻³¹ | N m2 | |
| Inverse Debye length | κ | 5 × 10⁷ | m−1 | |
| Collision response | ||||
| Cell-cell collision spring constant | kc,c | 1 × 10⁻¹⁰ | N m−1 | |
| Cell-substratum collision spring constant | kc,s | 1 × 10⁻¹⁰ | N m−1 | |
| Other forces | ||||
| Velocity damping coefficient | kd | 1 × 10⁻¹³ | N s m−1 | |
| Bacilli geometry (E. coli) | ||||
| Cell diameter | Dr | 0.75 ± 0.0375 | μm | (42) |
| Initial cell length | Lr,0 | 3 | μm | |
| Final cell length | Lr,div | 5.75 | μm | (42) |
| Cell mass at division | mr,div | 2.45 × 10⁻¹⁵ | kg | |
| Filament-former geometry (activated sludge) | ||||
| Cell diameter | Dr | 0.5 | μm | (43) |
| Initial cell length | Lr,0 | 1.67 | μm | |
| Final cell length | Lr,div | 4 | μm | (43) |
| Cell mass at division | mr,div | 3.70 × 10⁻¹⁵ | kg | |
| Floc former geometry (activated sludge) | ||||
| Cell diameter | Dr | 0.35 | μm | (43) |
| Initial cell length | Lr,0 | 0.317 | μm | |
| Final cell length | Lr,div | 1.1 | μm | (43) |
| Cell mass at division | mr,div | 6.09 × 10⁻¹⁶ | kg | |
| Growth (E. coli) | ||||
| Growth rate coefficient for bacilli | μ | 1.23 ± 0.277 | h−1 | (44,45) |
| Growth (activated sludge, low O2 concentration) | ||||
| Growth rate coefficient for fil. form. | μ | 0.217 ± 0.0434 | h−1 | |
| Growth rate coefficient for floc form. | μ | 0.153 ± 0.0306 | h−1 | |
| Growth (activated sludge, high O2 concentration) | ||||
| Growth rate coefficient for fil. form. | μ | 0.271 ± 0.0542 | h−1 | (43) |
| Growth rate coefficient for floc form. | μ | 0.383 ± 0.0766 | h−1 | (43) |
| Other parameters | ||||
| Biomass density | ρ | 1010 | kg m−3 | |
Cell division
Division is biochemically a very complex process, with one of the key issues being the division plane (24). Prokaryotic bacilli such as Escherichia coli will normally divide longitudinally along a plane in the central cross section of the rod, whereas cocci may divide into one, two, three, or any number of planes to form filaments, tetrads, sarcina, or staph structures, respectively (38). For rods, the division plane is inherent in the geometry of the cell.
In the model, a cell divides when a critical mass has been reached. Apart from determining divisional plane and cell-sibling orientation, the other major issue is sharing of links in secondary and tertiary structures. Secondary links are redistributed to maintain a straight filament by inserting newly formed cells in the array (branching excluded), whereas tertiary links are distributed between mother and daughter according to the proximity of the cell.
Mechanical relaxation
The initial collection of cells is made of a system of particles and springs in mechanical equilibrium. When new cells are formed as a result of microbial growth and division, this equilibrium is perturbed. The model takes a physics-based approach to compute the new location for each particle by relaxing the momentum balances toward the equilibrium of forces:
| (2) |
where v = [vx, vy, vz] is the particle velocity and ΣFj the sum of all forces acting on the particle. Position p = [px, py, pz] is then calculated from velocity:
| (3) |
Each particle will contribute with six equations (Eqs. 2 and 3 in a three-dimensional Cartesian coordinate system) to the system of ordinary differential equations, which describes the redistribution of the microbial community.
Included in the model presented here are elastic forces, Fs, due to intracellular, intercellular, or cell-substratum springs, and collision-response forces, Fc. In addition, velocity-damping forces Fd = −kdv prevent large oscillations and stabilize the movement of particles toward the mechanical equilibrium. For simulations involving a planar substratum, the DLVO force and normal forces act on cells as well.
During each time step of mechanical relaxation, cell-cell and cell-substratum distances are checked and tertiary links are formed or broken. Formation of a new set of springs between two cells A and B (a sticking link) occurs when the distance, d, between the cell center (for a spherical cell) or the cell axis (for rod-shaped cells) and the center or axis of the other cell is d < ds,form. An existing link is broken when the actual spring length exceeds the maximum length, . In a similar way, anchoring links are formed and broken, with d the distance between cell and substratum. The spring constants are set such that the springs are stiff enough for the cell structures to be rigid under weak stress and to mitigate overall model stiffness. Intracellular springs have relatively high stiffness compared to intercellular springs, as also suggested in literature (49). Values for spring constants, formation, and stretch limits are given in Table 1.
Model implementation and solution
As cell growth and division are orders of magnitude slower than the mechanical relaxation (minutes/hours versus seconds (50)), it is computationally advantageous to use a model solution that splits the time-stepping algorithm into two phases. During the growth phase, executed with time steps on the order of hours, cell masses increase. When the cell mass exceeds a critical value after the growth step, the cell divides. Filial links may be created between the involved cells. In a second phase, a partially relaxed state is calculated by moving the particles according to the ordinary differential equation momentum balances (Eqs. 2 and 3), solved over a much shorter time interval. Sticking and anchoring links can be created or removed during this phase. A Dormand-Prince Runge-Kutta ordinary differential equation solver (51) is used to determine relaxation. For the small-size microbial aggregates simulated, 1 s of mechanical relaxation was in general sufficient.
After relaxation, the state variables for each particle and cell links are stored, and a new growth/division phase begins.
The model solution algorithm has been implemented as object-oriented Java code. Through the JMatIO library (December 2012, http://sourceforge.net/projects/jmatio/), MATLAB (R2012b, The MathWorks, Natick, MA) was used to preprocess for rendering in POV-Ray (3.7 Beta, http://www.povray.org/, Persistence of Vision Pty., Williamstown, Victoria, Australia).
Results and Discussion
Two case studies are discussed to illustrate the potential of this modeling approach. The first case is a simulation of colony growth of rod-shaped cells (e.g., E. coli, Bacillus subtilis, etc.) on a planar surface. In the second case, a mix of two cell morphologies is used (spherical cells and chains of rod-shaped cells) to simulate communities of floc-forming and filamentous bacteria in mixed population systems, as encountered in activated sludge flocs and anaerobic biofilms.
Rod-shaped cells on a planar surface
Growth of a pure culture containing rod-shaped cells is simulated on a planar substratum, which may represent an agar surface. Cell diameter and final length are taken from earlier experimental work (42), assuming E. coli growth on glucose. When a cell is formed, its diameter is determined by random sampling from a normal distribution with a standard deviation of 5% of the mean diameter (Table 1). The cell diameter remains constant for the rest of the simulation and the cell length is set to satisfy the equations described in the section Primary structures: cell types. The specific growth rate of a cell is generated randomly at each time step from a normal distribution, with parameters as found in Koch and Wang (44) and Képès (45). The cell is modeled by two particles connected by a stiff spring. Primarily, collision response, DLVO, and velocity-damping forces act on the cells. Additional forces are introduced when investigating the effect of cell-substratum (anchoring) and filial links. Ten simulations with different initial states are run for each case.
Colony formation without anchoring and filial links
Without anchoring links to bind the cells to the substratum, cells can move along the surface and encounter only a drag force relative to the cell velocity (introduced as damping in this model). Although the differences in diameter cause cells to displace each other slightly in the vertical dimension, DLVO forces prevent cells from stacking for an average of 3.8 h (Fig. 2 A, Fig. 3 B, and Movie S1 in the Supporting Material). By fitting an ellipse to enclose all cells, the mean area of the biofilm at which stacking occurs is for this particular case found to be 730 ± 80 μm2 (95% confidence interval).
Figure 2.

Colony development for a pure culture of rod-shaped cells on a planar substratum (top and lateral views) after 4.67 h, with no anchoring and no filial links (A), with cell-substratum anchoring (B), and with filial links only (C). Colors denote the first four cell generations: red, yellow, blue, and green, respectively. Animations of these simulations are presented in Movies S1–S3 in the Supporting Material. To see this figure in color, go online.
Figure 3.
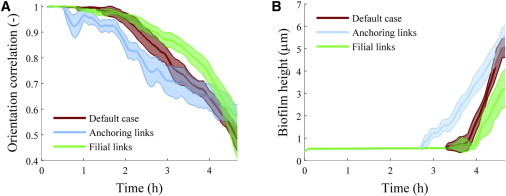
(A) Orientation correlation coefficient. (B) Biofilm thickness, for simulated colonies of rod-shaped cells growing on a planar substratum. The shaded regions represent the 95% confidence interval for the mean, based on 10 simulations (two-tailed t-test). To see this figure in color, go online.
Simulation results suggest that the cells remain aligned during colony expansion, as observed in Fig. 2 A. The overall orientation of cells in the colony can be quantified with the orientation correlation coefficient (16), , where o is the orientation vector for the cell (equivalent to Ls,i).
From a parallel alignment of cells in the early stage of colony formation, a more random orientation develops over time (see Fig. 3 A). The initial parallel positioning can be explained by the cell division mechanism. Directly after division, both cells are aligned head to tail. The internal springs then relax, displacing the cells slightly while maintaining strong alignment. After several division and relaxation steps, the alignment is lost.
The spread of different generations throughout the biofilm can be observed by labeling the first four generations of cells with different colors. After 70 divisions (4.67 h), cell generations are generally grouped (i.e., phase separation occurs, Fig. 2 A), but some cell clusters have moved into cell collections of a different generation.
These simulations suggest that when rod-shaped cells with parameters as in Table 1 grow on a flat, smooth substratum to which no EPS links can be formed, the biofilm may grow as a monolayer for a limited period of time. The simulated colony formation is very similar to the experimental observations of E. coli growth presented as time lapse microscopy movies by Stewart et al. (52). Also, colonies of B. subtilis have been observed to develop the same morphology (53).
Effect of anchoring to substratum
Observational work also shows that multiple layers of cells can form when rod-shaped bacteria grow on a planar substratum (46). The underlying mechanism for this mounding of cells is not well understood, and one factor that can contribute to cell stacking is anchoring between cells and the substratum, which would impede the movement along the substratum. In this way, the newly formed cells could meet more resistance to movement along the substratum plane and be forced to escape toward the top of the colony. The anchoring links can be seen as strong cell bonds with substratum due to pili, or as a result of sticky EPS.
During simulations of this scenario, cell-substratum links are formed, stretched, broken, and formed again as new cells displace their neighbors. Simulations show that initially the colony can expand along the plane, similar to two-dimensional development without anchoring forces. However, as the colony increases in size, the amount of opposing force met by a cell growing far from the colony edge increases until DLVO and anchoring forces are overcome, the cell is pushed up into the third dimension and the anchoring link is broken. If the cell is close enough to the substratum, a new cell-substratum link is formed, but this link is quickly broken as well because of the excessive upward force. This process repeats until eventually the cell is pushed too far from the substratum to form new anchoring links, and where DLVO force is weaker, thereby escaping the substratum (Fig. 2 B and Movie S2). Cells not anchored to the substratum continue to grow freely and eventually form stacks and mounds. Similar to experimental observations (46), this mound is highest around the colony center. The first cells that break away from the substratum are positioned around the middle of the colony, where the forces required to displace neighboring cells are the highest.
The model biofilm thickness (colony height) has been quantified and compared to that of a biofilm without anchoring links (Fig. 3 B). Without anchoring links, the biofilm can remain flat for almost 4 h. Including cell anchoring leads to three-dimensional colonies after on average of 2.9 h for the set of parameters described in Table 1. The mean surface area at which cell stacking is first observed is 210 ± 30 μm2. This area is much smaller than the default case due to anchoring links limiting the horizontal expansion of the biofilm, as well as a lower cell count at which cells first stack.
By increasing or decreasing the strength of the anchoring links (via da,break), the moment at which stacking occurs can be advanced or delayed. For example, setting da,break to twice the default length causes cells to stack after 1.9 h on average, whereas halving da,break results in cell stacking after 3.08 h.
Cell-substratum links also appear to disrupt the parallel alignment of rod-shaped cells in the biofilm. Anchored cells respond to displacement with an opposing force, pushing away other cells in different directions, eventually causing the biofilm to lose the parallel cell alignment (i.e., the orientation correlation quickly decreases; see Fig. 3 A).
In conclusion, it is expected that biofilms able to form cell-substratum connections will become thicker and much less spread out than biofilms less able to bind to a substratum. This can be investigated experimentally by inoculating substrata with different surface roughness and observing the biofilm spread and thickness through microscopy. An extension of this case study is the inclusion of a slime capsule cell-substratum link (17). Although both approaches maintain a constant distance between cell and substratum, the slime allows the cells to freely glide along the plane, whereas anchoring links exert force and eventually break when cells are displaced horizontally. Simulation results suggest, as expected, that gliding prevents cells from stacking (results not shown).
Effect of filial links
Independent of the presence of anchoring links, the model consistently produces colonies with rounded edges (Fig. 2, A and B), in contrast to some experimental observations (52,53), which show also elongated or irregularly shaped colonies. One possible explanation is that elongated colonies could be the result of cells maintaining a head-to-tail connection after division, which was implemented in the model through the use of filial links.
Simulations with filial links and no anchoring to substratum indeed resulted in irregularly shaped monolayer colonies, with less circularity (Fig. 2 C and Movie S3). Initially, the alignment of cells is better maintained in the presence of filial links, but near the end of the simulation (3.67 h), the alignment is lost completely (Fig. 3 A).
It can be seen in Fig. 3 B that filial links have no significant effect on the moment at which cell stacking first occurs (4.02 h with filial links). For these simulations, the area of the biofilm at the time mound formation is first observed is 1100 ± 200 μm2, much larger than in the default case. A possible explanation for this increase is that due to the decreased colony roundness a larger ellipse is needed to envelop the cells.
The simulations show that the colony roundness can be largely determined by the ability of the species to form head-to-tail connections: cells capable of forming chains show more irregularity in their colony shape. A relation between mound formation and filial links was not observed. One way to further assess this is to compare biofilm morphology for species that have similar cell morphology but differ in their ability to form filial links (either through manipulation or strain selection). Through image processing, the effect of filial links on cell orientation can be quantified experimentally.
Activated sludge floc structure and bulking
Wastewater treatment involves extensive use of activated sludge processes, where the microorganisms aggregated in flocs are retained in the treatment system by use of gravity clarifiers. One of the main problems of this technology is that bulking of sludge causes flocs with poor settleability and dewaterability. Sludge bulking is a result of the shape and low density of flocs, often caused by excessive and long filament formers (24,28). In activated sludge floc formation, a distinction can be made between two groups of microorganisms: floc formers, which grow in densely packed, quasispherical aggregates, and filament formers, which grow in long structured chains of cells (28). It is generally believed that by maintaining a healthy balance between both groups, the floc structure formed can be optimized to minimize bulking (54). Ideal flocs would have an internal filamentous matrix to provide structure. However, growth of filaments outside of the floc should be prevented to limit interfloc bridging, poor settling, and compressibility (filamentous bulking sludge (28)).
The analysis here focuses on the balance between two characteristic organisms, the filament former Sphaerotilus natans and a floc former from the Citrobacter genus, growing together in the same floc. S. natans is a rod-shaped organism known to form relatively rigid filaments and is widely found in wastewater treatment plants that have bulking sludge problems (55). Growth parameters are readily available for both pure culture (56) and growth in coculture with a floc former (43). For the sake of simplicity, variation in rod cell diameters has been neglected. By varying some of the microbial properties (e.g., relative growth rates, filament stiffness, sticking strength, presence of branching, floc former cell shape), effects on the structure of the resulting flocs can be investigated.
Relative growth rate of floc and filament formers
Compared to filament formers, floc formers have a higher maximum growth rate but a lower affinity for both oxygen and soluble carbon (28). Therefore, at low substrate concentrations the filament formers can dominate the floc. Although the model currently does not calculate substrate concentration fields, the ratio of the average growth rates of both species can be scaled by assuming fixed bulk concentrations. Two sets of parameters were used (Table 1), corresponding to low and high oxygen concentration. In the initial floc, the same total mass of floc and filament formers was taken. That is, the inoculum contains six times as many floc former cells as filament former cells due to the different cellular masses of the two cell types (Fig. 4 A).
Figure 4.

Simulated activated sludge floc structures made of floc-former (gray) and filament-former (red) rod-shaped cells, showing the effect of different types of intercellular links. (A) Initial state for all simulated flocs. (B) The standard case (low O2 concentration (ls,f,shor t = 0.5, ls,f,long= 1.7), and ds,break = 1 μm). (C) Increased relative floc-former growth rate (high O2 concentration parameter set from Table 1). (D and E) Different filament stiffness is generated by changing (ls,f,short, ls,f,long) to (0.1, 2.1) for stiff filaments (D) and (0.9, 1.3) for flexible filaments. (E). (F and G) Sticking-link strength is adjusted by changing ds,break to 5 μm for strong sticking (F) and 0.2 μm for weak sticking (G). States A, B, and D–G are shown after 16.80 h (369 cells), and state C after 7.67 h (362 cells). Animations of aggregate development for all simulations can be seen in Movies S4–S9. To see this figure in color, go online.
At low concentrations, starting from an initial state (Fig. 4 A), the filament former grows faster than the floc former (Fig. 4 B). The developed floc is disperse, with small colonies of floc formers attached at different positions to filaments extending freely into the bulk liquid. This behavior has frequently been reported in the literature (see, e.g., Martins et al. (27) and references therein). The faster filament growth quickly puts filament formers out of reach of floc formers, which mainly occupy the floc interior. The chains of filament formers can then quickly expand into the bulk liquid and form interfloc bridges, in turn making sludge bulking possible (as experimentally visualized by Xie et al. (57); see Fig. 5 F).
Figure 5.
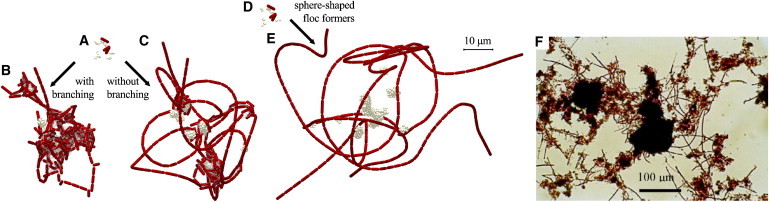
Simulated activated sludge floc structures showing the effects of filament branching and spherical floc formers. (A) Initial state for a rod-shaped floc former. (B and C) Rod-shaped floc former with 30% filament branching (B) and in a strictly straight (nonbranching) configuration. (D) Initial state for spherical floc former. (E) Spherical floc former. (F) Interfloc bridging observed in a Gram-stained visible light micrograph (from Xie et al. (57)). Simulation results are shown after 19.65 h. Animations of aggregate development resulting in structures B, C, and E can be viewed in Movies S10, S4, and S11, respectively. To see this figure in color, go online.
The model predicts that at high substrate concentrations (starting from the same initial state), an ideal floc is formed (28). The filaments are present inside the floc but do not extend into the bulk liquid because they are captured by the floc formers before they escape from the floc (Fig. 4 C). The dividing filamentous cells are very likely to connect through sticking springs with the more abundant floc formers that grow faster at high O2 concentrations, preventing the filament from growing away from the dense floc kernel. In time, however, the filaments will still be able to escape the floc (Movie S5), pushing other cells away and breaking cell-cell links as they grow away from the floc.
Stiffness of filaments
Filament stiffness (resistance to filament buckling) can be tuned by changing relative spring rest lengths for filial links, e.g., a shorter ls,f,short and longer ls,f,long lead to stiffer filaments. Three parameter sets were used here for (ls,f,short, ls,f,long): standard (0.5, 1.7), flexible (0.9, 1.3), and stiff (0.1, 2.1), together with the low-concentration growth parameters (Table 1). The gap size between cells is identical for these parameter sets.
The simulation results suggest that filial-link stiffness in the range tested does not play a major role in interfloc bridging, as all three cases resulted in a similar floc structure (Fig. 4, B, D, and E). Note that the stretch limit df,break was not increased with increasing stiffness, so filaments already under tension (stiff) could break under a lower force than flexible filaments. For these parameters, however, filament link breakage occurred only rarely.
Strength of sticking links
The influence of sticking links on floc formation (e.g., due to different EPS strength) was investigated by varying the sticking-spring stretch limit (ds,break) among normal (1 μm), strong (5 μm), and weak (0.2 μm) limits. It was found that sticking springs play an essential role in the formation of floc structure and therefore in interfloc bridging (Fig. 4, B, F, and G). Strong sticking links allow floc formers to capture and maintain links with filament formers, resulting in a compact floc with few outreaching filaments (Fig. 4 F). For weaker sticking links, the floc breaks up as it grows (Fig. 4 G), resulting in a very disperse structure. These simulations suggest that the strength of EPS in activated sludge communities is a major factor in sludge bulking. It is even possible that by adding chemicals to degenerate EPS, sludge bulking can increase where EPS structure is weakened instead of broken down completely. This is a challenge to assess by means of simple experiments, since methods to reduce EPS strength (e.g., ion exchange resins or EDTA) also can have an impact on environmental factors.
Branching of filaments
Although the modeled organism S. natans does not show true branching, many other filament formers do (e.g., Nocardia (56)). To model filament branching effects on floc bridging, a 30% chance is set to form a new branch at division instead of inserting the new cell in the straight filament. Model simulations show how the branching filament former sprouts numerous side chains, at the expense of filament length (Fig. 5 B). In the floc with filament branching, the filaments are not long enough to extend far into the bulk liquid. The density of such a floc is therefore greater than that of a floc made of straight filaments growing at a similar rate (Fig. 5 C), thereby attenuating the bulking tendency of filamentous sludge, as also observed experimentally (50).
Sphere-shaped versus rod-shaped floc formers
Although for this study most simulations included rod-shaped floc formers, spherical cells are also widespread in activated sludge (56). Simulations have been run to investigate the effect of floc former morphology on floc structure. All parameters (i.e., mass, growth rate, and spring constants) for spherical cells were the same as those for rod-shaped floc formers, except for the maximum diameter, which was set to obtain the same maximum mass (Ds,div = 0.52 μm). The same initial number of cells and a similar initial cell distribution were created (compare Fig. 5, A and D).
Simulated flocs including spherical floc formers (Fig. 5 E) were more disperse than those created with rod-shaped cells (Fig. 5 C). The most notable difference is that the spherical cells do not capture filaments as well as the rod-shaped cells. The denser packing of spherical cells in a colony leads to a smaller cluster volume for the spherical floc formers. This means that the chance to encounter a filament former is smaller for spherical floc formers than for rod-shaped cells, resulting in less dense flocs.
Context and applications
Although both simple (single-population) and more complex (mixed-population and mixed-morphology) applications have been demonstrated here on a largely physical basis, the method allows for obvious extension to applications where substrate fields are also solved (i.e., solute transport and reaction are included). This would allow more realistic growth based on substrate and product concentration fields and would make the model available to investigate biochemical phenomena such as interspecies electron transfer on an aggregate scale.
Another key application is physical dynamics in the presence of a convective field, with two-way coupling through computational fluid dynamics (58). Rather than imposing a specific geometry and set of mechanical properties on the biofilm, these can be dynamically developed in the presence of the flow field. The model proposed here is well suited to this application due to its fundamental mechanical basis.
There is a wide range of possible extensions, including microbial motility, implementation of inert and substrate particles, and imposition of planar axes and division rules that allow formation of packets such as tetrads. The main negative of this approach is the computational requirements, particularly with large numbers of agents, but this can be addressed in a number of ways, including solver optimization and code parallelization.
Another key issue is experimental or observational verification of model-based analysis. In this article, we have largely focused on development and application of a variable morphology technique and this has identified possible controlling mechanisms on a basic level that drive apparently complex colony behavior. This highlights the application of model-based analysis to develop experimental hypotheses that then can be further investigated, with application to both simple and complex systems. One of the strengths of identifying experiments based on model analysis is that specific experiments can be observed and modeled under dynamic conditions to provide a complete picture of how morphology is derived from basic properties.
Conclusions
Application of a variable morphology model allows for better understanding of how the geometric and mechanical properties of elemental agents (microbes and EPS) can influence larger aggregates. Specifically, we showed here that for both uniform populations (e.g., of bacilli), as well as complex mixed cultures (in flocs), larger aggregates are strongly influenced by the shape of the microbe, as well as by physical characteristics of filial and EPS connections. This approach can be extended to a wide range of potential systems, with particular applicability to problems where mechanical properties of the aggregate are important or coupled to the growth environment.
Acknowledgments
This project was supported under the Australian Research Council’s (ARC) Discovery Projects funding scheme (project number DP0985000). Dr. Damien Batstone is the recipient of an ARC Research Fellowship. The work of Dr. Cristian Picioreanu was funded by the Netherlands Organization for Scientific Research (NWO, VIDI grant 864.06.003). Dr. Bernardino Virdis is supported by strategic funding for the Centre for Microbial Electrosynthesis (UQ).
Supporting Material
References
- 1.Wanner O., Gujer W. A multispecies biofilm model. Biotechnol. Bioeng. 1986;28:314–328. doi: 10.1002/bit.260280304. [DOI] [PubMed] [Google Scholar]
- 2.Alpkvist E., Klapper I. A multidimensional multispecies continuum model for heterogeneous biofilm development. Bull. Math. Biol. 2007;69:765–789. doi: 10.1007/s11538-006-9168-7. [DOI] [PubMed] [Google Scholar]
- 3.Merkey B.V., Rittmann B.E., Chopp D.L. Modeling how soluble microbial products (SMP) support heterotrophic bacteria in autotroph-based biofilms. J. Theor. Biol. 2009;259:670–683. doi: 10.1016/j.jtbi.2009.05.010. [DOI] [PubMed] [Google Scholar]
- 4.Kreft J.-U., Picioreanu C., van Loosdrecht M.C.M. Individual-based modelling of biofilms. Microbiology. 2001;147:2897–2912. doi: 10.1099/00221287-147-11-2897. [DOI] [PubMed] [Google Scholar]
- 5.Lardon L.A., Merkey B.V., Smets B.F. iDynoMiCS: next-generation individual-based modelling of biofilms. Environ. Microbiol. 2011;13:2416–2434. doi: 10.1111/j.1462-2920.2011.02414.x. [DOI] [PubMed] [Google Scholar]
- 6.Alpkvist E., Picioreanu C., Heyden A. Three-dimensional biofilm model with individual cells and continuum EPS matrix. Biotechnol. Bioeng. 2006;94:961–979. doi: 10.1002/bit.20917. [DOI] [PubMed] [Google Scholar]
- 7.Wood B.D., Whitaker S. Diffusion and reaction in biofilms. Chem. Eng. Sci. 1998;53:397–425. [Google Scholar]
- 8.Xavier Jde. B., Picioreanu C., van Loosdrecht M.C.M. A general description of detachment for multidimensional modelling of biofilms. Biotechnol. Bioeng. 2005;91:651–669. doi: 10.1002/bit.20544. [DOI] [PubMed] [Google Scholar]
- 9.Xavier J.B., Foster K.R. Cooperation and conflict in microbial biofilms. Proc. Natl. Acad. Sci. USA. 2007;104:876–881. doi: 10.1073/pnas.0607651104. [DOI] [PMC free article] [PubMed] [Google Scholar]
- 10.Seoane J., Yankelevich T., Smets B.F. An individual-based approach to explain plasmid invasion in bacterial populations. FEMS Microbiol. Ecol. 2011;75:17–27. doi: 10.1111/j.1574-6941.2010.00994.x. [DOI] [PubMed] [Google Scholar]
- 11.Rudge T.J., Steiner P.J., Haseloff J. Computational modeling of synthetic microbial biofilms. ACS Synth. Biol. 2012;1:345–352. doi: 10.1021/sb300031n. [DOI] [PubMed] [Google Scholar]
- 12.Nadell C.D., Foster K.R., Xavier J.B. Emergence of spatial structure in cell groups and the evolution of cooperation. PLOS Comput. Biol. 2010;6:e1000716. doi: 10.1371/journal.pcbi.1000716. [DOI] [PMC free article] [PubMed] [Google Scholar]
- 13.Nadell C.D., Xavier J.B., Foster K.R. The evolution of quorum sensing in bacterial biofilms. PLoS Biol. 2008;6:e14. doi: 10.1371/journal.pbio.0060014. [DOI] [PMC free article] [PubMed] [Google Scholar]
- 14.Melke P., Sahlin P., Jönsson H. A cell-based model for quorum sensing in heterogeneous bacterial colonies. PLOS Comput. Biol. 2010;6:e1000819. doi: 10.1371/journal.pcbi.1000819. [DOI] [PMC free article] [PubMed] [Google Scholar]
- 15.Picioreanu C., Head I.M., Scott K. A computational model for biofilm-based microbial fuel cells. Water Res. 2007;41:2921–2940. doi: 10.1016/j.watres.2007.04.009. [DOI] [PubMed] [Google Scholar]
- 16.Janulevicius A., van Loosdrecht M.C.M., Picioreanu C. Cell flexibility affects the alignment of model myxobacteria. Biophys. J. 2010;99:3129–3138. doi: 10.1016/j.bpj.2010.08.075. [DOI] [PMC free article] [PubMed] [Google Scholar]
- 17.Harvey C.W., Morcos F., Alber M. Study of elastic collisions of Myxococcus xanthus in swarms. Phys. Biol. 2011;8:026016. doi: 10.1088/1478-3975/8/2/026016. [DOI] [PubMed] [Google Scholar]
- 18.Chambless J.D., Hunt S.M., Stewart P.S. A three-dimensional computer model of four hypothetical mechanisms protecting biofilms from antimicrobials. Appl. Environ. Microbiol. 2006;72:2005–2013. doi: 10.1128/AEM.72.3.2005-2013.2006. [DOI] [PMC free article] [PubMed] [Google Scholar]
- 19.Picioreanu C., Kreft J.-U., Van Loosdrecht M.C.M. Particle-based multidimensional multispecies biofilm model. Appl. Environ. Microbiol. 2004;70:3024–3040. doi: 10.1128/AEM.70.5.3024-3040.2004. [DOI] [PMC free article] [PubMed] [Google Scholar]
- 20.Batstone D.J., Picioreanu C., van Loosdrecht M.C.M. Multidimensional modelling to investigate interspecies hydrogen transfer in anaerobic biofilms. Water Res. 2006;40:3099–3108. doi: 10.1016/j.watres.2006.06.014. [DOI] [PubMed] [Google Scholar]
- 21.Xavier J.B., De Kreuk M.K., Van Loosdrecht M.C.M. Multi-scale individual-based model of microbial and bioconversion dynamics in aerobic granular sludge. Environ. Sci. Technol. 2007;41:6410–6417. doi: 10.1021/es070264m. [DOI] [PubMed] [Google Scholar]
- 22.Picioreanu C., van Loosdrecht M.C.M., Scott K. Model based evaluation of the effect of pH and electrode geometry on microbial fuel cell performance. Bioelectrochemistry. 2010;78:8–24. doi: 10.1016/j.bioelechem.2009.04.009. [DOI] [PubMed] [Google Scholar]
- 23.Kreft J.-U., Booth G., Wimpenny J.W. BacSim, a simulator for individual-based modelling of bacterial colony growth. Microbiology. 1998;144:3275–3287. doi: 10.1099/00221287-144-12-3275. [DOI] [PubMed] [Google Scholar]
- 24.Clark D., Dunlap P., Martinko J. 13th ed. Benjamin Cummings; San Francisco: 2009. Brock Biology of Microorganisms. [Google Scholar]
- 25.Pfeffer C., Larsen S., Nielsen L.P. Filamentous bacteria transport electrons over centimetre distances. Nature. 2012;491:218–221. doi: 10.1038/nature11586. [DOI] [PubMed] [Google Scholar]
- 26.Kolenbrander P.E. Oral microbial communities: biofilms, interactions, and genetic systems. Annu. Rev. Microbiol. 2000;54:413–437. doi: 10.1146/annurev.micro.54.1.413. [DOI] [PubMed] [Google Scholar]
- 27.Martins A.M.P., Pagilla K., van Loosdrecht M.C.M. Filamentous bulking sludge—a critical review. Water Res. 2004;38:793–817. doi: 10.1016/j.watres.2003.11.005. [DOI] [PubMed] [Google Scholar]
- 28.Seviour R.J. Factors affecting the bulking and foaming filamentous bacteria in activated sludge. In: Seviour R.J., Nielsen P.H., editors. Microbial Ecology of Activated Sludge. International Water Association; London: 2010. pp. 139–167. [Google Scholar]
- 29.Okabe S., Satoh H., Watanabe Y. In situ analysis of nitrifying biofilms as determined by in situ hybridization and the use of microelectrodes. Appl. Environ. Microbiol. 1999;65:3182–3191. doi: 10.1128/aem.65.7.3182-3191.1999. [DOI] [PMC free article] [PubMed] [Google Scholar]
- 30.Xavier J.B., Picioreanu C., van Loosdrecht M.C.M. A framework for multidimensional modelling of activity and structure of multispecies biofilms. Environ. Microbiol. 2005;7:1085–1103. doi: 10.1111/j.1462-2920.2005.00787.x. [DOI] [PubMed] [Google Scholar]
- 31.Matsumoto S., Katoku M., van Loosdrecht M.C. Microbial community structure in autotrophic nitrifying granules characterized by experimental and simulation analyses. Environ. Microbiol. 2010;12:192–206. doi: 10.1111/j.1462-2920.2009.02060.x. [DOI] [PubMed] [Google Scholar]
- 32.Popławski N.J., Shirinifard A., Glazier J.A. Simulation of single-species bacterial-biofilm growth using the Glazier-Graner-Hogeweg model and the CompuCell3D modeling environment. Math. Biosci. Eng. 2008;5:355–388. doi: 10.3934/mbe.2008.5.355. [DOI] [PMC free article] [PubMed] [Google Scholar]
- 33.Izaguirre J.A., Chaturvedi R., Glazier J.A. CompuCell, a multi-model framework for simulation of morphogenesis. Bioinformatics. 2004;20:1129–1137. doi: 10.1093/bioinformatics/bth050. [DOI] [PubMed] [Google Scholar]
- 34.Windisch B., Bray D., Duke T. Balls and chains—a mesoscopic approach to tethered protein domains. Biophys. J. 2006;91:2383–2392. doi: 10.1529/biophysj.105.078543. [DOI] [PMC free article] [PubMed] [Google Scholar]
- 35.Dillon R., Fauci L., Gaver D., III Modeling biofilm processes using the immersed boundary method. J. Comput. Phys. 1996;129:57–73. [Google Scholar]
- 36.Tamulonis C., Postma M., Kaandorp J. Modeling filamentous cyanobacteria reveals the advantages of long and fast trichomes for optimizing light exposure. PLoS ONE. 2011;6:e22084. doi: 10.1371/journal.pone.0022084. [DOI] [PMC free article] [PubMed] [Google Scholar]
- 37.Celler K., Hödl I., Picioreanu C. A mass-spring model unveils the morphogenesis of phototrophic Diatoma biofilms. Sci. Rep. 2014;4:3649. doi: 10.1038/srep03649. [DOI] [PMC free article] [PubMed] [Google Scholar]
- 38.Rothfield L.I., Zhao C.R. How do bacteria decide where to divide? Cell. 1996;84:183–186. doi: 10.1016/s0092-8674(00)80971-x. [DOI] [PubMed] [Google Scholar]
- 39.Burdman S., Jurkevitch E., Okon Y. Aggregation in Azospirillum brasilense: effects of chemical and physical factors and involvement of extracellular components. Microbiology. 1998;144:1989–1999. doi: 10.1099/00221287-144-7-1989. [DOI] [PubMed] [Google Scholar]
- 40.Ericson C. 2nd ed. Morgan Kaufmann; San Francisco: 2005. Real Time Collision Detection. [Google Scholar]
- 41.Hermansson M. The DLVO theory in microbial adhesion. Colloids Surf. B Biointerfaces. 1999;14:105–119. [Google Scholar]
- 42.Pierucci O. Dimensions of Escherichia coli at various growth rates: model for envelope growth. J. Bacteriol. 1978;135:559–574. doi: 10.1128/jb.135.2.559-574.1978. [DOI] [PMC free article] [PubMed] [Google Scholar]
- 43.Lau A.O., Strom P.F., Jenkins D. Growth kinetics of Sphaerotilus natans and a floc former in pure and dual continuous culture. J. Water Pollut. Control Fed. 1984;56:41–51. [Google Scholar]
- 44.Koch A.L., Wang C.H. How close to the theoretical diffusion limit do bacterial uptake systems function? Arch. Microbiol. 1982;131:36–42. doi: 10.1007/BF00451496. [DOI] [PubMed] [Google Scholar]
- 45.Képès F. The cell cycle of Escherichia coli and some of its regulatory systems. FEMS Microbiol. Lett. 1986;32:225–246. [Google Scholar]
- 46.Shapiro J.A., Hsu C. Escherichia coli K-12 cell-cell interactions seen by time-lapse video. J. Bacteriol. 1989;171:5963–5974. doi: 10.1128/jb.171.11.5963-5974.1989. [DOI] [PMC free article] [PubMed] [Google Scholar]
- 47.Stewart P.S. Diffusion in biofilms. J. Bacteriol. 2003;185:1485–1491. doi: 10.1128/JB.185.5.1485-1491.2003. [DOI] [PMC free article] [PubMed] [Google Scholar]
- 48.Harvey R.J., Marr A.G., Painter P.R. Kinetics of growth of individual cells of Escherichia coli and Azotobacter agilis. J. Bacteriol. 1967;93:605–617. doi: 10.1128/jb.93.2.605-617.1967. [DOI] [PMC free article] [PubMed] [Google Scholar]
- 49.Volle C., Ferguson M., Aidala K. Physical properties of native biofilm cells explored by atomic force microscopy. Biophys. J. 2009;96(Supplement):398a. Abstract. [Google Scholar]
- 50.Picioreanu C., Van Loosdrecht M.C., Heijnen J.J. Effect of diffusive and convective substrate transport on biofilm structure formation: a two-dimensional modeling study. Biotechnol. Bioeng. 2000;69:504–515. doi: 10.1002/1097-0290(20000905)69:5<504::aid-bit5>3.0.co;2-s. [DOI] [PubMed] [Google Scholar]
- 51.Press W.H., Teukolskky S.A., Flannery B.P. 3rd ed. Cambridge University Press; Cambridge, United Kingdom: 2007. Numerical Recipes: The Art of Scientific Computing. [Google Scholar]
- 52.Stewart E.J., Madden R., Taddei F. Aging and death in an organism that reproduces by morphologically symmetric division. PLoS Biol. 2005;3:e45. doi: 10.1371/journal.pbio.0030045. [DOI] [PMC free article] [PubMed] [Google Scholar]
- 53.de Jong I.G., Beilharz K., Veening J.-W. Live cell imaging of Bacillus subtilis and Streptococcus pneumoniae using automated time-lapse microscopy. J. Vis. Exp. 2011;3145:1–6. doi: 10.3791/3145. [DOI] [PMC free article] [PubMed] [Google Scholar]
- 54.Sezgin M., Jenkins D., Parker D.S. A unified theory of filamentous activated sludge bulking. J. Water Pollut. Control Fed. 1978;50:362–381. [Google Scholar]
- 55.Bitton G. 4th ed. Wiley-Blackwell; Hoboken, NJ: 2011. Wastewater Microbiology. [Google Scholar]
- 56.Seviour E.M., McIlroy S., Seviour R.J. Descriptions of activated sludge organisms. In: Seviour R.J., Nielsen P.H., editors. Microbial Ecology of Activated Sludge. International Water Association; London: 2010. pp. 453–487. [Google Scholar]
- 57.Xie B., Dai X.-C., Xu Y.-T. Cause and pre-alarm control of bulking and foaming by Microthrix parvicella—a case study in triple oxidation ditch at a wastewater treatment plant. J. Hazard. Mater. 2007;143:184–191. doi: 10.1016/j.jhazmat.2006.09.006. [DOI] [PubMed] [Google Scholar]
- 58.Alpkvist E., Klapper I. Description of mechanical response including detachment using a novel particle model of biofilm/flow interaction. Water Sci. Technol. 2007;55:265–273. doi: 10.2166/wst.2007.267. [DOI] [PubMed] [Google Scholar]
Associated Data
This section collects any data citations, data availability statements, or supplementary materials included in this article.