

Abstract
Static 2H NMR spectroscopy is used to study the critical behavior of mixtures of 1,2-dioleoyl-phosphatidylcholine/1,2-dipalmitoyl-phosphatidylcholine (DPPC)/cholesterol in molar proportion 37.5:37.5:25 using either chain perdeuterated DPPC-d62 or chain methyl deuterated DPPC-d6. The temperature dependence of the first moment of the 2H spectrum of the sample made with DPPC-d62 and of the quadrupolar splittings of the chain-methyl-labeled DPPC-d6 sample are directly related to the temperature dependence of the critical order parameter η, which scales as near the critical temperature. Analysis of the data reveals that for the chain perdeuterated sample, the value of Tc is 301.51 ± 0.1 K, and that of the critical exponent, βc = 0.391 ± 0.02. The line shape analysis of the methyl labeled (d6) sample gives Tc = 303.74 ± 0.07 K and βc = 0.338 ± 0.009. These values obtained for βc are in good agreement with the predictions of a three-dimensional Ising model. The difference in critical temperature between the two samples having nominally the same molar composition arises because of the lowering of the phase transition temperature that occurs due to the perdeuteration of the DPPC.
Introduction
The phase behavior, particularly the coexistence of two fluid phases (liquid-disordered (ld) and liquid-ordered (lo)) (1), has been studied for a number of mixed lipid systems containing cholesterol (2–17) and in giant plasma membrane vesicles (18,19). Associated with this two-phase coexistence there is generally a line of critical compositions on the two-phase boundary separating the higher temperature single-phase region from the two-phase ld/lo coexistence region below. For temperatures and compositions close to this line of critical points, the local composition of the bilayer fluctuates. Such fluctuations not only have consequences for the physical properties of these model membrane systems, but, if they occur in natural biological membranes, may have important consequences for the biological function. The fluctuations and even the phase behavior can be influenced by external factors such as the interaction with actin (20), streptavidin (21), or anesthetics (22), or through surface adhesion (23).
Critical behavior can be observed in a tremendous variety of different physical systems (24,25), whether in superfluids, superconductors, binary liquids, or ternary lipid mixtures containing cholesterol. The phenomena observed, however, have remarkable similarities among systems which are members of the same universality class. For example, uniaxial ferromagnets, binary liquids, and multilamellar dispersions of DOPC/DPPC/cholesterol all would appear to belong to the same class. As the critical point is approached in any of these systems, quantities such as the specific heat, susceptibility, and the order parameter for the phase transition all vary with temperature according to the same power law. Thus, the specific heat varies as , the susceptibility varies as , and the order parameter varies as . The three-dimensional (3D) Ising model describes this theoretically and predicts that α3D = 0.11, β3D = 0.325, and γ3D = 1.24. If the physical system is only two-dimensional (2D), then the 2D Ising model would predict α2D = 0 (actually, the specific heat diverges logarithmically), β2D = 0.125, and γ2D = 1.75 (26). In either case, theory predicts αc + 2βc + γc = 2.
An essential feature of critical behavior is the divergence of the length scale, ξ, describing fluctuations in the order parameter as the critical point is approached. Far above Tc the order parameter is zero and there is no correlation (for example in the orientation of the Ising spin) but as T approaches Tc, even though long-range order is still zero, locally there starts to be a correlation between neighboring spins. The correlation length varies as [(T − Tc) / Tc]−νc. The exponent νc is related to those discussed above by the relation 2 − αc = νc × d, where d is the dimensionality of the system (26). In the 2D Ising model, the exponent is ν2D = 1, whereas in the 3D Ising model, ν3D = 0.63. Above Tc, one can study the local fluctuations using a variety of physical techniques. Below Tc, one can measure the order parameter itself.
In giant unilamellar vesicles (GUVs), fluorescence microscopy has been used to study these fluctuations close to Tc, where the correlation length becomes longer than the wavelength of light. Since the thickness of a single lipid bilayer (or a biological membrane) is only 4–6 nm, it seems logical to expect these vesicles to behave approximately like a 2D system, since the wavelength of visible light is much larger than the thickness of the bilayer. On the other hand, NMR of multilamellar dispersions can be used to study the fluctuations farther from the critical point, where the fluctuations are not yet visible in optical microscopes. In addition, the close juxtaposition of very many lipid bilayers may result in these sytems behaving more as 3D systems in NMR studies.
Careful experimentation can reveal the physical character of these compositional fluctuations. Studies on GUVs using fluorescence microscopy techniques have led to the conclusion that these single-bilayer vesicles behave as 2D systems consistent with a 2D Ising model universality class (19,27,28). Our previous work on DOPC/DPPC/cholesterol multilamellar dispersions (10) led us to conclude that the critical behavior in multilamellar systems is better described within the 3D Ising universality class. This was a result of our observation that the sample spin rate dependence of the line width of the 2H NMR magic angle spinning (MAS) side bands scaled with temperature with an exponent νc = 0.628 ± 0.01 consistent with the 3D Ising prediction of ν3D = 0.63, rather than the value ν2D = 1 expected for the 2D Ising universality class (26).
In this article, we present static 2H NMR results on samples of DOPC/DPPC/cholesterol (with molar composition 37.5:37.5:25), where the DPPC is either chain perdeuterated or is deuterated only at the chain terminal methyl groups. Below the critical temperature, Tc, the first moment, M1, of the spectra for the chain perdeuterated sample, and the 2H quadrupolar splittings of the methyl deuterated sample are both directly related to the critical order parameter. The temperature dependence of this order parameter, which goes to zero at the critical temperature, scales as . Analysis of these data gives βc = 0.391 ± 0.02 for the chain perdeuterated sample and βc = 0.338 ± 0.009 for the methyl deuterated sample. Both agree quite well with the 3D Ising value of β3D = 0.325, but not with the 2D Ising value, β2D = 0.125.
In the next section, we describe the method of sample preparation, the experimental procedures used, and the method of analysis of the data. We then present the experimental results and a discussion of their interpretation. We conclude with a brief summary and comparison to other work.
Materials and Methods
Sample preparation
Cholesterol was obtained from Sigma-Aldrich (St. Louis, MO) and twice recrystallized from ethanol before use. 1,2-dioleoyl-sn-glycero-3-phosphocholine (DOPC), 1,2-di-[d31]-palmitoyl-sn-glycero-3-phosphocholine (DPPC-d62) and chain methyl labeled 1,2-di-[d3]-palmitoyl-sn-glycero-3-phosphocholine (DPPC-d6) were obtained from Avanti Polar Lipids (Alabaster, AL) and used without further purification. Sample preparation was as described by Davis et al. (10). We focus here on two samples having the same nominal composition, namely, a 37.5:37.5:25 molar composition of DOPC/DPPC/cholesterol. The first sample was prepared using chain perdeuterated DPPC-d62, and the second using chain methyl deuterated DPPC-d6. Each sample contained ∼20 mg of labeled DPPC. Each sample was hydrated using 50 mM potassium phosphate buffer, pH 7.0, at a buffer volume/total dry weight ratio of 3:4. Samples were accurately weighed before and after the NMR experiments were performed and no change in weight, i.e., no water loss, was observed. Spectra at 308.8 K, well above the two-phase coexistence region, taken at the beginning and end of the sequence of experiments were used to assess sample stability against hydrolysis of the lipids. No change in the spectrum was observed for either sample.
Static 2H NMR
All NMR experiments were performed on a 500 MHz wide-bore Bruker Avance II spectrometer (Bruker BioSpin, Milton, ON, Canada) at a 2H NMR frequency of 76.77 MHz. For these static 2H NMR experiments, a home-built probe was used with the quadrupolar echo pulse sequence (29). This probe uses a copper oven for regulating the sample temperature rather than the commercial air-flow system used by Bruker Biospin probes. This design significantly reduces the temperature gradient across the sample, permitting finer control. The probe temperature was sensed using a Pt-100 resistance thermometer embedded in the wall of the copper oven. The temperature was calibrated using the chemical shift of Pb(NO3)2 (30,31). The phase transition temperatures of DMPC-d54 (32) and DPPC-d62 (33) were used as reference points for this calibration. The temperature gradient across the sample, for temperatures near 300 K, is estimated to be <0.1 K (i.e., ±0.05 K).
In these experiments, we focused on the temperature range close to the critical region (from 306 K down to 298 K for the chain perdeuterated sample, and from ∼313 down to 287 K for the methyl deuterated sample). Near the critical point, sample temperature was decreased in small steps, either 0.1, 0.2, or 0.3 K. To permit a careful moment analysis of the spectra of the sample containing DPPC-d62 (33,34), 4096 scans were collected and a simple shift algorithm (34,35) was used to position the start of the time domain signal precisely at the top of the quadrupolar echo. The receiver dead time, dominated by acoustic ringing, which occurs for frequencies in the range of 80 MHz or lower, required the use of echo delay times of at least 35 μs. Two 90° pulses of 2.9 μs duration were used to form the quadrupolar echo (except for the DOPC/DPPC-d6/cholesterol sample where 90° pulses of 2.6 μs were used). The area and the first four moments of the spectra,
| (1) |
were calculated and used for the analysis. Here, A is the area of the spectrum , centered at the Larmor frequency , and Mn is its nth moment. The limits () of the integral are chosen to be large enough to include all of the spectrum intensity. The systematic error in evaluation of the moments is minimized by the procedures discussed above (which provide a very flat baseline), whereas the random errors (determined by the signal/noise ratio) are reduced by using a large sample and a large number of scans in obtaining the spectra. We estimate the uncertainties for the series of experiments on the 37.5:37.5:25 perdeuterated DPPC sample to be ∼2% for the area, 0.5% for M1, and 1% for M2. (Note that the uncertainty in the first two moments turns out to be smaller than that of the area, since the intensity of the spectrum depends on small variations in probe tuning to which the shape of the spectrum is insensitive.)
For the DPPC-d6 sample, where line shape fitting was to be used, only 2048 scans were taken at each temperature. The spectra were analyzed by fitting to a superposition of three Gaussian (or Lorentzian) broadened powder-pattern line shapes. Each powder pattern was characterized by an area, a quadrupolar splitting, and a line broadening. The lo phase component consists of two powder patterns due to the inequivalence of the two DPPC methyl groups observed at high cholesterol concentrations, whereas the ld phase component is fitted with a single powder pattern.
The fitting function was written in Origin C, and was run by OriginPro 9.0 (OriginLab, Northampton, MA). It consisted of the superposition of quadrupolar split doublets having either a Gaussian or Lorentzian shape. Initially, the superposition of splittings was weighted by sinθ, where θ is the angle between the bilayer normal and the magnetic field, as would be expected for spherical liposomes. It was found that both Lorentzian and Gaussian line shapes resulted in too much intensity for the 0° shoulders compared to what is observed in the spectra. One of the factors resulting in the reduced experimental intensity in the shoulders is the slight distortion of the spherical liposomes by the strong magnetic field. This distortion leads to slightly prolate ellipsoidal liposomes and results in an angular distribution of doublets weighted by (36)
| (2) |
Here, ρ is the ratio of the semimajor to semiminor axis of the prolate ellipsoid. The comparison of the experimental and theoretical line shapes is significantly improved when using this distribution.
The lowest temperature spectrum was fitted first, since the three overlapping powder patterns are easily distinguished at low temperatures. The two components corresponding to the two methyl groups in the lo phase were constrained to have equal areas, to within 10% (to allow for slightly differing relaxation times). Having fit the lowest temperature spectrum, the parameter values obtained were used as the starting point for the fit of the next lowest temperature. This process was continued, gradually increasing the temperature, until the sample was within 1 K of the critical point using equal weights for the spectrum data. To continue the process, at <1 K from the critical temperature, we found that it was necessary to use direct weighting (proportional to signal intensity) to obtain reliable fits. The use of direct weighting had no effect on the parameters obtained by the fitting procedure for temperatures >1 K from the critical point. In this way, we were able to continue the fitting procedure until the sample temperatures was <0.25 K from the critical point.
Results and Discussion
The spectra in Fig. 1 illustrate the changes that occur as the sample temperature is lowered through the critical point into the two-phase coexistence region. As reported previously (2,3,37), well above Tc the 2H spectra of chain perdeuterated DPPC-d62 in the 37.5:37.5:25 mixture (Fig. 1 a) are characteristic of the rapid molecular reorientation of the liquid disordered (ld) phase. As the sample temperature approaches the critical point, there is noticeable line broadening (Fig. 1, b and c). Below Tc, the spectra show the coexistence of the two phases (Fig. 1, d–f). Although it is difficult to simulate the details contained in the spectra of perdeuterated samples, the moments of these spectra can provide a valuable perspective on the behavior occurring near the critical temperature.
Figure 1.
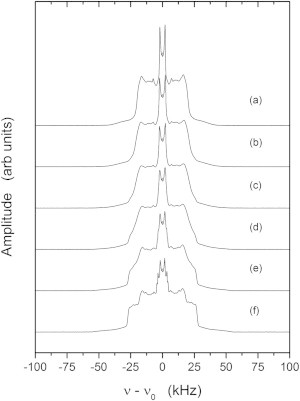
Static 2H NMR spectra of the 37.5:37.5:25 molar proportion DOPC/DPPC-d62/cholesterol sample showing the changes in the powder-pattern spectra as the sample is cooled from the higher-temperature ld phase into the fluid-fluid ld/lo two-phase coexistence region. Spectra are shown for 307.18 K (a), 303.13 K (b), 301.5 K (c), 301.09 K (d), 301.1 K (e), and 298.47 K (f).
Fig. 2 shows the temperature dependence of the first moment, M1, for this sample. Above Tc the first moment increases approximately linearly as the temperature is decreased. In the region below Tc the sample has two phases, one rich in cholesterol and the saturated lipid (the lo phase) and the other low in cholesterol and rich in the unsaturated lipid (the ld phase). Because of the strong ordering effect of cholesterol on saturated lipids, there is a dramatic difference in the quadrupolar splittings of the 2H NMR spectra of these two phases (see Fig. 1, f). In such a two-phase coexistence region, the first moment of the 2H NMR spectrum can be written as the sum of two parts:
| (3) |
and are the first moments of the spectral components arising from the two different types of domain within the sample, and glo is the fraction of DPPC in the lo phase. Since M1 is proportional to the average quadrupolar splitting (33,34), and since the lo phase is more ordered than the ld phase, and ΔM1 > 0. Thus, at the critical point, there is a dramatic change in the slope in the graph M1 versus T. The shape of this curve depends on both ΔM1 and glo.
Figure 2.
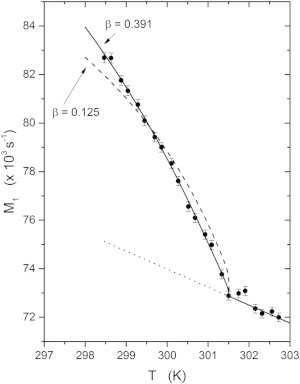
The temperature dependence of the first moment of the 2H NMR spectra of the 37.5:37.5:25 molar proportion DOPC/DPPC-d62/cholesterol sample. The dotted line shows the baseline temperature dependence of M1. The deviation of the experimental data from this baseline occurring at Tc is due to the separation of the sample into two phases. The solid curve below Tc shows the comparison with the best fit to a power law giving β = 0.391 ± 0.02, whereas the dashed line shows the prediction for a 2D Ising model with β = 0.125
The value of ΔM1 = 4π / (3)Δ(< δνQ >) depends on the difference in cholesterol concentrations in the two phases. For example, we have found that M1 varies linearly with cholesterol concentration between 0 and 30 mol % for samples having equal molar proportions of DOPC and DPPC-d62, with M1 (zchol) = 5.17 × 10⁴ + 8.75 × 10⁴ × zchol (with an adjusted R2 = 0.9986). Of course, for any given sample composition, on passing through the phase boundary from the ld phase into the ld/lo coexistence region, the compositions of the two domains are determined by the lever rule, and the molar proportions of all three components change in accordance with the curvature of the phase boundaries. We note that the difference in quadrupolar splittings (and therefore in the values of M1) of coexisting ld and lo domains (which may have, for example, 12 and 30 mol % cholesterol) is greater than that found for equimolar mixtures of DOPC and DPPC-d62 having corresponding cholesterol concentrations. This is because there is also a large difference in the ratio of the unsaturated to saturated lipid in the different domains.
In pure fluids that exhibit critical behavior, the order parameter η used to describe the behavior is taken to be proportional to the fluid density. Below the critical temperature, there is a gas-liquid equilibrium, with the two phases having different densities. As the critical point is approached from below, the difference in the densities approaches zero as , where βc is the critical exponent for the order parameter. Above Tc, the distinction between the two phases vanishes. In ternary mixtures, it is expected that the composition can play the role of the order parameter, and in this case, the concentration of cholesterol seems to be the most important factor. Molecular density, or the inverse of molecular volume, may also be taken as the order parameter. In either case, the deuterium quadrupolar splittings provide an experimental measure of the order parameter: they are very sensitive to the relative concentrations of DPPC, DOPC, and cholesterol and they are directly related to the hydrocarbon chain length (16,38–41). In our analysis, we will assume that the difference between the first moments of the 2H NMR spectra of DPPC-d62 in the lo and ld phases is proportional to the order parameter. We will also assume that the difference between the 2H quadrupolar splittings of the chain terminal methyl groups in the two phases provides an equally good measure of the order parameter.
Since the value of depends on glo as well as on ΔM1, we need to independently measure glo as a function of temperature to use the data in Fig. 2 to determine the value of the critical exponent βc. Close examination of the spectra in Fig. 1 suggests that a careful analysis of the contribution of the chain terminal methyl groups to the spectrum may allow not only a determination of glo but also a direct measurement of Δ(δν), the difference in the quadrupolar splittings for the methyl groups in the lo and ld phases. Unfortunately, the sizable background from the methylene groups in the perdeuterated sample makes it too difficult to extract accurate results. For this reason, we prepared a second sample having the same nominal composition but using methyl deuterated DPPC-d6.
Fig. 3 shows a series of 2H NMR spectra of 37.5:37.5:25 molar proportion DOPC/DPPC-d6/cholesterol taken at different temperatures near the critical point. Well above Tc (Fig. 3 a), the spectrum is characteristic of a single homogeneous phase. The intensity of the 0° shoulders is weaker than expected for an ideal powder pattern where all orientations are equally probable. This can be partially accounted for by a slight elliptical distortion of the liposomes by the strong magnetic field. As the sample temperature approaches the critical point, there is substantial broadening of the powder pattern (Fig. 3 b). Below Tc, the inequivalence of the methyl groups becomes apparent, and three quadrupolar splittings can be seen; the smallest splitting corresponds to lipids within the ld phase and the two larger splittings are for the lipids within the lo phase. From the spectra in Fig. 3, it is clear that at lower temperatures, the relative amount of DPPC-d6 in the ld phase is reduced. The small sharp peak at the left of center of each spectrum is due to natural-abundance HDO in the buffer.
Figure 3.
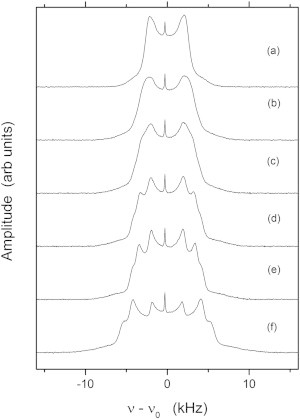
Static 2H NMR spectra of the 37.5:37.5:25 molar proportion DOPC/DPPC-d6/cholesterol sample showing the changes in the powder-pattern spectra as the sample is cooled from the higher-temperature ld phase to the fluid-fluid (ld/lo) two-phase coexistence region. Spectra are shown for 310.4 K (a), 305.56 K (b), 303.86 K (c), 303.38 K (d), 302.32 K (e), and 300.85 K (f). Notice that the critical temperature is slightly higher for the d6-labeled sample than for the d62-labeled sample (Fig. 1).
These spectra have been analyzed by fitting the line shapes to Gaussian or Lorentzian broadened powder patterns, allowing for an ellipsoidal distortion of the liposomes by the magnetic field. Fig. 4 shows the spectrum at a temperature of 310.39 K, well above the critical temperature. The best fit to a Lorentzian broadened powder pattern, shown by the dotted line in the figure, is obtained with a semimajor/semiminor axis ratio of ρ = 1.27. This line shape clearly has too much intensity in the wings of the spectrum. The best fit to a Gaussian broadened powder pattern, with ρ = 1.07, is shown by the dashed line. Although the fit in the wings of the spectrum is improved, the experimental line shape is not perfectly reproduced. Although further refinement, allowing a mixture of Gaussian and Lorentzian character in the line shape, would provide closer agreement with the experimental spectrum, it is felt that the Gaussian powder pattern with ellipsoidal distortion provides an adequate representation of the spectra. The spectra above Tc are fit with a single Gaussian broadened powder pattern. The parameter ρ was in the range 1.05–1.08 above Tc. The other parameters obtained are summarized below. Below Tc, a superposition of three Gaussian powder patterns, all having the same ellipsoidal ratio, ρ, was used. Each powder pattern was characterized by an area, a quadrupolar splitting, and a Gaussian broadening factor, σ. The areas of the two components from the lo phase were constrained by the fitting procedure to remain within 10% of each other. The factor ρ varied from 1.0 to 1.08 as temperature was varied below Tc.
Figure 4.
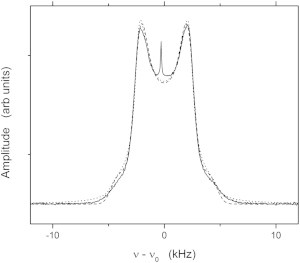
Comparison of the fit of the experimental 2H NMR spectrum (solid line) of 37.5:37.5:25 DOPC/DPPC-d6/cholesterol at a temperature of 289 K to a Lorentzian broadened powder-pattern line shape (dotted line) and a Gaussian broadened powder-pattern line shape (dashed line). Notice that neither line shape fits the 0° shoulders very well, presumably due to an orientation-dependent T2e.
Fig. 5 shows the quadrupolar splittings obtained both above and below Tc, the error bars are the standard errors returned by the fitting procedure. As expected, above Tc there is a gradual, almost linear, increase in quadrupolar splitting as the sample temperature is lowered. This can be compared to the roughly linear variation of M1 with temperature shown in Fig. 2 for the chain perdeuterated sample. At the critical temperature, the powder pattern splits into three components, as previously mentioned. The uncertainties in the quadrupolar splittings are quite large near the critical point where all three splittings rapidly approach each other (as Tc is approached from below). The changes in the quadrupolar splittings shown here are the result of two factors: first, the splittings are gradually increasing as temperature is lowered; and second, the domain compositions are continuously changing as temperature is lowered. In particular, the cholesterol concentration of the ld phase domains (those having the smallest splitting) decreases substantially from that of the nominal sample compositions (25 mol %) and the cholesterol concentration of the lo phase domains increases somewhat.
Figure 5.
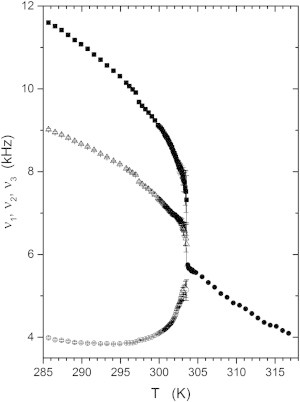
Temperature dependence of the quadrupolar splittings for ld and lo components of the 2H spectrum of the 37.5:37.5:25 molar proportion DOPC/DPPC-d6/cholesterol sample. Solid circles represent the ld component above the critical temperature, Tc, open circles the ld component, ν1, below Tc. Open triangles and squares represent the lo phase components, ν2 and ν3.
At 297 K, there appears to be a small discontinuous step in the values of the splittings in Fig. 5. This is an experimental artifact caused by a change in the flow rate of the air used to extract heat from the oven. Regrettably, it was necessary to change this flow rate to further lower the sample temperature.
Each powder pattern is characterized by a Gaussian line width parameter σ, which changes dramatically with temperature both above and below Tc, as illustrated in Fig. 6. The solid circles give the powder-pattern line width, σ1, in the ld phase above Tc, and the open circles are for the ld component below Tc. The open triangles and squares are the line widths, σ2 and σ3, of the two inequivalent powder patterns observed for the lo phase component. These differ slightly from each other but do not appear to show the strong temperature dependence near Tc that the ld component does.
Figure 6.
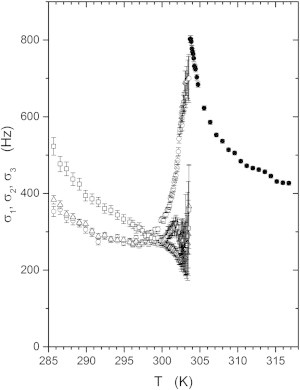
Temperature dependence of the Gaussian line widths of the DOPC/DPPC-d6/cholesterol sample. Open and solid circles correspond to the ld component below and above Tc, respectively; open triangles and squares, are for the lo components below Tc.
The width of the static powder-pattern line shapes observed in 2H NMR spectra of lipid bilayers depends on several factors. Slow fluctuations of the quadrupolar interaction are an important contributor to the line width, but other factors include the temperature homogeneity across the sample and the homogeneity in the sample composition. There may also be a tendency for the two methyl groups to become slightly inequivalent (i.e., have different splittings) at high cholesterol concentrations at lower temperatures, even in the ld phase (42).
Because of the strong dependence of the quadrupolar splittings on cholesterol concentration in these ternary mixtures, the homogeneity of the sample composition is a very important factor. Depending on temperature, the methyl group quadrupolar splitting may vary from something like 4 kHz for no cholesterol to 12 kHz for 30 mol % or more cholesterol. Thus, for a sample whose local cholesterol concentration varies by no more than 1 mol % across the entire sample, we might expect a contribution to the line width of as much as 200–300 Hz. Just below Tc, a temperature gradient of 0.1 K across the sample could also result in a contribution to σ1 of as much as 200 Hz (though evidently this is not a significant factor above Tc, where the splitting of the ld component varies relatively slowly with temperature). However, the line widths σ2 and σ3 remain relatively small and do not change as dramatically as σ1, even though the splittings ν2 and ν3 change rapidly with temperature just below Tc. This suggests that the temperature gradient cannot be an important broadening factor. For this reason, we estimate that the temperature gradient across the sample, near Tc, must be <∼0.1 K.
Orientational fluctuations in the quadrupolar Hamiltonian provide an important contribution to the spectral line width (34,43). Quadrupolar echo relaxation measurements, to determine the echo decay time, T2e, were performed at 308.8 K and 292.6 K using echo delay values varying from 50 to 800 μs. The relaxation across the powder pattern was exponential, with only a slight degree of orientation dependence (the 0° shoulders relax slightly faster than the 90° peaks). At 308.8 K, the relaxation time is T2e = 711 ± 1 μs. Using the relation 2 × σ2e = 1 / (π × T2e), which relates the full width at half-maximum to the Gaussian width σ2e leads to σ2e = 190 Hz, which is much smaller than the static powder-pattern line width of σ = 502.4 ± 1.4 Hz measured at that temperature. In a similar way, in the lo phase at 292.6 K, we obtained , , and which correspond to Hz, Hz, and Hz. These are smaller than the measured Gaussian line widths: Hz, Hz, and Hz. The uncertainties quoted above, both for the relaxation times and for the static line broadening parameters, are those returned by the fitting procedures used. Thus, relaxation accounts for only about half of the static powder-pattern line width observed. This prevents us from analyzing the static powder-pattern line widths in the same manner with which we previously analyzed the magic angle spinning side-band line widths (10).
The fraction of DPPC-d6 that is in the lo phase is given by the ratio of the areas of the spectra of the two inequivalent methyls in the lo phase to the total area of the spectrum
| (4) |
where A1 is the area of the ld component and A2 and A3 are the areas of the lo components. Fig. 7 shows glo as a function of temperature below Tc. The solid curve in the figure is a fit to a simple function of Tc − T
| (5) |
which allows us to interpolate values of glo close to the critical point. No other interpretation is placed on the form of the function used. The parameters of the best fit give a = 0.1516 ± 0.014, b = 0.0102 ± 0.0008, c = 0.553 ± 0.013, and d = 1.59 ± 0.07.
Figure 7.
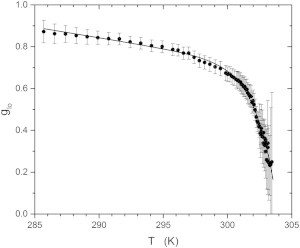
Temperature dependence of the lo phase fraction glo of the DOPC/DPPC-d6/cholesterol sample determined from the ratio of the combined areas of the lo phase signals to the total spectrum area. The solid curve is a fit to an arbitrary function of Tc − T to facilitate comparison with the first-moment data in Fig. 2.
In the earlier discussion of the temperature variation of M1 for the sample made with perdeuterated DPPC-d62, it was pointed out that the behavior below Tc depended on ΔM1 and on the lo fraction glo (Eq. 3 and Fig. 2). We can use the parameters of the fit to the glo versus T data for the sample containing DPPC-d6 to calculate the lo fraction for the sample with DPPC-d62 by replacing the value of the critical temperature for the d6 sample, Tc = 303.74 K, by the value of the critical temperature of the d62 sample, Tc = 301.51 K. Then, we can fit Eq. 3 to the data in Fig. 2 using , to obtain the solid line in Fig. 2. The parameters of this fit are s−1 and βc = 0.391 ± 0.02. This is close to the value of β3D = 0.325 predicted by the 3D Ising model. Also shown for comparison (Fig. 2, dashed line) is the best fit to these data using the critical exponent β2D = 0.125 that corresponds to the 2D Ising model.
Because we have the quadrupolar splittings of the ld and lo components from the analysis of the spectra of the sample containing DPPC-d6, we can evaluate < Δ(δν) > directly (this corresponds to the ΔM1 used for the perdeuterated lipid sample). This is given simply by the expression
| (6) |
The results are plotted in Fig. 8. The error bars are based on the standard errors for the splittings returned by the fitting procedure. The solid line is the result of the fit to the function
| (7) |
The best fit parameters are Δ(δν)0 = 17.37 ± 0.5 kHz and βc = 0.338 ± 0.009. This is in close agreement with the value expected for the 3D Ising model, β3D = 0.325. Also shown for comparison (Fig. 8, dashed line), is the best fit using the critical exponent β2D = 0.125 that corresponds to the 2D Ising model.
Figure 8.
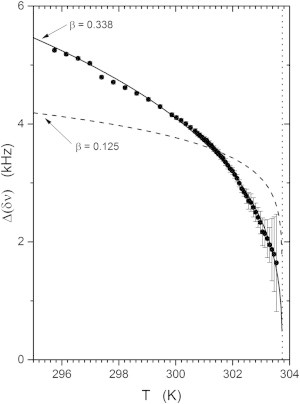
Temperature dependence of the difference between the average methyl group quadrupolar splitting of the lo phase and the methyl splitting of the ld phase below the critical point of the DOPC/DPPC-d6/cholesterol sample. The best fit gives a critical exponent of β = 0.338 ± 0.009 and a critical temperature of Tc = 303.74 ± 0.07 K. The vertical dotted line indicates the critical temperature.
Conclusions
Multilamellar dispersions of the ternary mixture of DOPC/DPPC/cholesterol display a rich phase behavior that includes a broad range of fluid-fluid (ld/lo) phase coexistence when cholesterol concentration is high. Membrane rafts are thought to be manifestations of the same physical chemistry occurring in natural membranes. The existence of isolated domains of lo and ld membrane may be less important than the existence of a critical point for cholesterol concentrations comparable to that found in many cytoplasmic membranes. Proximity to a critical point results in local fluctuations in composition that may play an important role in membrane biochemistry.
In this article, we have presented measurements of ΔM1 of the 2H NMR spectra of chain perdeuterated DPPC-d62 and of Δ(δν) for chain methyl deuterated DPPC-d6 in multilamellar dispersions of DOPC/DPPC/cholesterol with molar proportion 37.5:37.5:25. These two quantities are argued to be proportional to the order parameter, η, that describes the phase transition. These quantities approach zero at the critical point, with critical exponents βc = 0.391 ± 0.02 for M1 of the chain perdeuterated sample and βc = 0.338 ± 0.009 for the methyl deuterated sample. These values, and our earlier results on the critical broadening of the 2H MAS side-band line widths (10), which gave a value for the critical exponent for the correlation length of νc = 0.628 ± 0.01, show that the multilamellar phospholipid dispersions belong to the 3D Ising universality class.
By comparing the powder-pattern line shapes obtained for these static (nonspinning) samples with simulations of Lorentzian or Gaussian broadened powder patterns, we conclude that neither shape can completely describe the experimental line shapes. Measurement of the quadrupolar echo decay time showed that dynamic fluctuations alone are not responsible for the line broadening and, therefore, that a line shape dominated by Lorentzian broadening is not expected. Inhomogeneities in sample composition and sample temperature, though both are estimated to be small, account for the non-Lorentzian contribution to the line width (amounting to ∼50% of the total broadening). For this reason, it was not possible to analyze the temperature dependence of the static powder pattern broadening as we had previously done for the MAS side-band line width.
Connell et al. (11) used atomic force microscopy to measure the difference in thickness between domains of the lo and ld phases in a DOPC/egg sphingomyelin/cholesterol mixture with a molar composition of 48:30:22. They found that the height difference approaches zero as (Tc − T)0.334. Since bilayer thickness is related to the average 2H quadrupolar splitting in deuterated bilayers (38), which is also proportional to the first moment, M1, the measurements of Connell et al. are comparable to those obtained here.
Fluorescence microscopy on GUVs, on the other hand, has yielded critical exponents for the correlation length, νc = 1.2 from line-tension measurements below Tc, and νc = 1 from measurements of the two-point correlation function above Tc (27,28). This work led to the conclusion that the GUVs belonged to the 2D Ising universality class.
Whichever theoretical model might eventually best describe critical phenomena in membrane bilayers, it is clear that the phenomena are a direct result of the large cholesterol concentration and of the differential interaction of cholesterol with long-chain saturated lipids compared to unsaturated lipids. What remains to be established is the extent to which membrane function depends on the critical fluctuations that must be present in natural membranes.
Acknowledgments
We thank Rob Wickham and Ivana Komljenović for helpful discussions and the staff of the University of Guelph NMR Centre for their help with the instrumentation and analysis.
This work was supported by grants from the Natural Sciences and Engineering Research Council of Canada, the Canada Foundation for Innovation, and the Ontario Ministry of Research and Innovation.
References
- 1.Vist M.R., Davis J.H. Phase equilibria of cholesterol/dipalmitoylphosphatidylcholine mixtures: 2H nuclear magnetic resonance and differential scanning calorimetry. Biochemistry. 1990;29:451–464. doi: 10.1021/bi00454a021. [DOI] [PubMed] [Google Scholar]
- 2.Veatch S.L., Soubias O., Gawrisch K. Critical fluctuations in domain-forming lipid mixtures. Proc. Natl. Acad. Sci. USA. 2007;104:17650–17655. doi: 10.1073/pnas.0703513104. [DOI] [PMC free article] [PubMed] [Google Scholar]
- 3.Davis J.H., Clair J.J., Juhasz J. Phase equilibria in DOPC/DPPC-d62/cholesterol mixtures. Biophys. J. 2009;96:521–539. doi: 10.1016/j.bpj.2008.09.042. [DOI] [PMC free article] [PubMed] [Google Scholar]
- 4.Veatch S.L., Gawrisch K., Keller S.L. Closed-loop miscibility gap and quantitative tie-lines in ternary membranes containing diphytanoyl PC. Biophys. J. 2006;90:4428–4436. doi: 10.1529/biophysj.105.080283. [DOI] [PMC free article] [PubMed] [Google Scholar]
- 5.Ionova I.V., Livshits V.A., Marsh D. Phase diagram of ternary cholesterol/palmitoylsphingomyelin/palmitoyloleoyl-phosphatidylcholine mixtures: spin-label EPR study of lipid-raft formation. Biophys. J. 2012;102:1856–1865. doi: 10.1016/j.bpj.2012.03.043. [DOI] [PMC free article] [PubMed] [Google Scholar]
- 6.Nyholm T.K.M., Lindroos D., Slotte J.P. Construction of a DOPC/PSM/cholesterol phase diagram based on the fluorescence properties of trans-parinaric acid. Langmuir. 2011;27:8339–8350. doi: 10.1021/la201427w. [DOI] [PubMed] [Google Scholar]
- 7.Zhao J., Wu J., Feigenson G.W. Phase studies of model biomembranes: complex behavior of DSPC/DOPC/cholesterol. Biochim. Biophys. Acta. 2007;1768:2764–2776. doi: 10.1016/j.bbamem.2007.07.008. [DOI] [PMC free article] [PubMed] [Google Scholar]
- 8.de Almeida R.F.M., Fedorov A., Prieto M. Sphingomyelin/phosphatidylcholine/cholesterol phase diagram: boundaries and composition of lipid rafts. Biophys. J. 2003;85:2406–2416. doi: 10.1016/s0006-3495(03)74664-5. [DOI] [PMC free article] [PubMed] [Google Scholar]
- 9.Veatch S.L., Keller S.L. Miscibility phase diagrams of giant vesicles containing sphingomyelin. Phys. Rev. Lett. 2005;94:148101. doi: 10.1103/PhysRevLett.94.148101. [DOI] [PubMed] [Google Scholar]
- 10.Davis J.H., Ziani L., Schmidt M.L. Critical fluctuations in DOPC/DPPC-d62/cholesterol mixtures: 2H magnetic resonance and relaxation. J. Chem. Phys. 2013;139:045104. doi: 10.1063/1.4816366. [DOI] [PubMed] [Google Scholar]
- 11.Connell S.D., Heath G., Kisil A. Critical point fluctuations in supported lipid membranes. Faraday Discuss. 2013;161:91. doi: 10.1039/c2fd20119d. [DOI] [PubMed] [Google Scholar]
- 12.Bezlyepkina N., Gracià R.S., Dimova R. Phase diagram and tie-line determination for the ternary mixture DOPC/eSM/cholesterol. Biophys. J. 2013;104:1456–1464. doi: 10.1016/j.bpj.2013.02.024. [DOI] [PMC free article] [PubMed] [Google Scholar]
- 13.Elliott R., Szleifer I., Schick M. Phase diagram of a ternary mixture of cholesterol and saturated and unsaturated lipids calculated from a microscopic model. Phys. Rev. Lett. 2006;96:098101. doi: 10.1103/PhysRevLett.96.098101. [DOI] [PubMed] [Google Scholar]
- 14.Putzel G.G., Schick M. Phenomenological model and phase behavior of saturated and unsaturated lipids and cholesterol. Biophys. J. 2008;95:4756–4762. doi: 10.1529/biophysj.108.136317. [DOI] [PMC free article] [PubMed] [Google Scholar]
- 15.de Almeida R.F.M., Borst J.-W., Visser A.J.W.G. Complexity of lipid domains and rafts in giant unilamellar vesicles revealed by combining imaging and microscopic and macroscopic time-resolved fluorescence. Biophys. J. 2007;93:539–553. doi: 10.1529/biophysj.106.098822. [DOI] [PMC free article] [PubMed] [Google Scholar]
- 16.Bartels T., Lankalapalli R.S., Brown M.F. Raftlike mixtures of sphingomyelin and cholesterol investigated by solid-state 2H NMR spectroscopy. J. Am. Chem. Soc. 2008;130:14521–14532. doi: 10.1021/ja801789t. [DOI] [PMC free article] [PubMed] [Google Scholar]
- 17.Heberle F.A., Wu J., Feigenson G.W. Comparison of three ternary lipid bilayer mixtures: FRET and ESR reveal nanodomains. Biophys. J. 2010;99:3309–3318. doi: 10.1016/j.bpj.2010.09.064. [DOI] [PMC free article] [PubMed] [Google Scholar]
- 18.Baumgart T., Hammond A.T., Webb W.W. Large-scale fluid/fluid phase separation of proteins and lipids in giant plasma membrane vesicles. Proc. Natl. Acad. Sci. USA. 2007;104:3165–3170. doi: 10.1073/pnas.0611357104. [DOI] [PMC free article] [PubMed] [Google Scholar]
- 19.Veatch S.L., Cicuta P., Baird B. Critical fluctuations in plasma membrane vesicles. ACS Chem. Biol. 2008;3:287–293. doi: 10.1021/cb800012x. [DOI] [PubMed] [Google Scholar]
- 20.Liu A.P., Fletcher D.A. Actin polymerization serves as a membrane domain switch in model lipid bilayers. Biophys. J. 2006;91:4064–4070. doi: 10.1529/biophysj.106.090852. [DOI] [PMC free article] [PubMed] [Google Scholar]
- 21.Manley S., Horton M.R., Gast A.P. Sorting of streptavidin protein coats on phase-separating model membranes. Biophys. J. 2008;95:2301–2307. doi: 10.1529/biophysj.107.124024. [DOI] [PMC free article] [PubMed] [Google Scholar]
- 22.Gray E., Karslake J., Veatch S.L. Liquid general anesthetics lower critical temperatures in plasma membrane vesicles. Biophys. J. 2013;105:2751–2759. doi: 10.1016/j.bpj.2013.11.005. [DOI] [PMC free article] [PubMed] [Google Scholar]
- 23.Zhao J., Wu J., Veatch S.L. Adhesion stabilizes robust lipid heterogeneity in supercritical membranes at physiological temperature. Biophys. J. 2013;104:825–834. doi: 10.1016/j.bpj.2012.12.047. [DOI] [PMC free article] [PubMed] [Google Scholar]
- 24.Stanley H.E. Scaling, universality, and renormalization: Three pillars of modern critical phenomena. Rev. Mod. Phys. 1999;71:S358–S366. [Google Scholar]
- 25.Honerkamp-Smith A.R., Veatch S.L., Keller S.L. An introduction to critical points for biophysicists; observations of compositional heterogeneity in lipid membranes. Biochim. Biophys. Acta. 2009;1788:53–63. doi: 10.1016/j.bbamem.2008.09.010. [DOI] [PMC free article] [PubMed] [Google Scholar]
- 26.Goldenfeld N. Westview Press; Boulder, CO: 1992. Lectures on Phase Transitions and the Renormalization Group. [Google Scholar]
- 27.Honerkamp-Smith A.R., Cicuta P., Keller S.L. Line tensions, correlation lengths, and critical exponents in lipid membranes near critical points. Biophys. J. 2008;95:236–246. doi: 10.1529/biophysj.107.128421. [DOI] [PMC free article] [PubMed] [Google Scholar]
- 28.Honerkamp-Smith A.R., Machta B.B., Keller S.L. Experimental observations of dynamic critical phenomena in a lipid membrane. Phys. Rev. Lett. 2012;108:265702. doi: 10.1103/PhysRevLett.108.265702. [DOI] [PMC free article] [PubMed] [Google Scholar]
- 29.Davis J.H., Jeffrey K.R., Higgs T.P. Quadrupolar echo deuteron magnetic resonance spectroscopy in ordered hydrocarbon chains. Chem. Phys. Lett. 1976;42:390–394. [Google Scholar]
- 30.van Gorkom L.C.M., Hook J.M., Wasylishen R.E. Solid state lead-207 NMR of lead(II) nitrate: localized heating effects at high magic angle spinning speeds. Magn. Reson. Chem. 1995;33:791–795. [Google Scholar]
- 31.Beckmann P.A., Dybowski C. A thermometer for nonspinning solid-state NMR spectroscopy. J. Magn. Reson. 2000;146:379–380. doi: 10.1006/jmre.2000.2171. [DOI] [PubMed] [Google Scholar]
- 32.Morrow M.R., Davis J.H. Differential scanning calorimetry and 2H NMR studies of the phase behavior of gramicidin-phosphatidylcholine mixtures. Biochemistry. 1988;27:2024–2032. doi: 10.1021/bi00406a032. [DOI] [PubMed] [Google Scholar]
- 33.Davis J.H. Deuterium magnetic resonance study of the gel and liquid crystalline phases of dipalmitoyl phosphatidylcholine. Biophys. J. 1979;27:339–358. doi: 10.1016/S0006-3495(79)85222-4. [DOI] [PMC free article] [PubMed] [Google Scholar]
- 34.Davis J.H. The description of membrane lipid conformation, order and dynamics by 2H-NMR. Biochim. Biophys. Acta. 1983;737:117–171. doi: 10.1016/0304-4157(83)90015-1. [DOI] [PubMed] [Google Scholar]
- 35.Prosser R.S., Davis J.H., Lindorfer M.A. 2H nuclear magnetic resonance of the gramicidin A backbone in a phospholipid bilayer. Biochemistry. 1991;30:4687–4696. doi: 10.1021/bi00233a008. [DOI] [PubMed] [Google Scholar]
- 36.Pott T., Dufourc E.J. Action of melittin on the DPPC-cholesterol liquid-ordered phase: a solid state 2H-and 31P-NMR study. Biophys. J. 1995;68:965–977. doi: 10.1016/S0006-3495(95)80272-9. [DOI] [PMC free article] [PubMed] [Google Scholar]
- 37.Juhasz J., Sharom F.J., Davis J.H. Quantitative characterization of coexisting phases in DOPC/DPPC/cholesterol mixtures: comparing confocal fluorescence microscopy and deuterium nuclear magnetic resonance. Biochim. Biophys. Acta. 2009;1788:2541–2552. doi: 10.1016/j.bbamem.2009.10.006. [DOI] [PubMed] [Google Scholar]
- 38.Schindler H.-G., Seelig J. Deuterium order parameters in relation to thermodynamic properties of a phospholipid bilayer. A statistical mechanical interpretation. Biochemistry. 1975;14:2283–2287. doi: 10.1021/bi00682a001. [DOI] [PubMed] [Google Scholar]
- 39.Morrow M.R., Whitehead J.P., Lu D. Chain-length dependence of lipid bilayer properties near the liquid crystal to gel phase transition. Biophys. J. 1992;63:18–27. doi: 10.1016/S0006-3495(92)81579-5. [DOI] [PMC free article] [PubMed] [Google Scholar]
- 40.Ipsen J.H., Mouritsen O.G., Bloom M. Relationships between lipid membrane area, hydrophobic thickness, and acyl-chain orientational order. The effects of cholesterol. Biophys. J. 1990;57:405–412. doi: 10.1016/S0006-3495(90)82557-1. [DOI] [PMC free article] [PubMed] [Google Scholar]
- 41.Petrache H.I., Dodd S.W., Brown M.F. Area per lipid and acyl length distributions in fluid phosphatidylcholines determined by 2H NMR spectroscopy. Biophys. J. 2000;79:3172–3192. doi: 10.1016/S0006-3495(00)76551-9. [DOI] [PMC free article] [PubMed] [Google Scholar]
- 42.Clarke J.A., Seddon J.M., Law R.V. Cholesterol containing model membranes studied by multinuclear solid state NMR spectroscopy. Soft Matter. 2009;5:369–378. [Google Scholar]
- 43.Davis J.H., Auger M. Static and magic angle spinning NMR of membrane peptides and proteins. Prog. Nucl. Magn. Reson. Spectrosc. 1999;35:1–84. [Google Scholar]