Abstract
Myocardial infarction is a leading cause of mortality and morbidity worldwide. Occlusion of a coronary artery produces ischemia and myocardial necrosis that leads to left ventricular (LV) remodeling, dysfunction, and heart failure. Stem cell therapy may decrease infarct size and improve LV function; the hypoxic environment, however, following a myocardial infarction may result in apoptosis, which in turn decreases survival of transplanted stem cells. Therefore, the effects of preconditioned mesenchymal stem cells (MSC) with hyperoxia (100% oxygen), Z-VAD-FMK pan-caspase inhibitor (CI), or both in a hypoxic environment in order to mimic conditions seen in cardiac tissue post-myocardial infarction were studied in vitro. MSCs preconditioned with hyperoxia or CI significantly decreased apoptosis as suggested by TUNEL assay and Annexin V analysis using fluorescence assisted cell sorting. These effects were more profound when both, hyperoxia and CI, were used. Additionally, gene and protein expression of caspases 1, 3, 6, 7, and 9 were down-regulated significantly in MSCs preconditioned with hyperoxia, CI, or both, while the survival markers Akt1, NF-κB, and Bcl-2 were significantly increased in preconditioned MSCs. These changes ultimately resulted in a significant increase in MSC proliferation in hypoxic environment as determined by BrdU assays compared to MSCs without preconditioning. These effects may prove to be of great clinical significance when transplanting stem cells into the hypoxic myocardium of post-myocardial infarction patients in order to attenuate LV remodeling and improve LV function.
Keywords: MESENCHYMAL STEM CELLS, PRECONDITIONING, CASPASE INHIBITOR, HYPEROXIA, HYPOXIA, APOPTOSIS
Myocardial infarction is a major cause of mortality and morbidity worldwide. Approximately 7.9 million patients in the United States in 2008 had sustained a myocardial infarction [Roger et al., 2012]. Myocardial infarction mostly results from an occlusion of a coronary artery due to acute atherosclerotic plaque rupture followed by platelet aggregation and thrombosis within the vessel. Ischemia downstream from an occluded artery results in cardiomyocyte ischemia, necrosis, and apoptosis. Myocardial damage may lead to left ventricular (LV) dysfunction, remodeling, and heart failure [Itoh et al., 1995; Schoen and Mitchell, 2005; Boudoulas and Hatzopoulos, 2009]. Currently, there is no effective therapy to reverse the course of this process. Thus, the possibility to restore or rejuvenate damaged myocardial tissue using cell therapy is an exciting concept [Miyahara et al., 2006; Strauer and Steinhoff, 2011].
Within the last decade, despite the progress that has been made related to cell therapy, evidence suggests that survival of stem cells transplanted in post-myocardial infarction tissue (i.e., hypoxic tissue) is low. Animal models demonstrated only a small number of integrated differentiated cardiac cells after transplantation into infarcted myocardium [Bel et al., 2003; Suzuki et al., 2004]. Clinical trials in patients with an acute myocardial infarction or chronic ischemic cardiomyopathy have also shown sub-optimal results [Chen et al., 2004; Hofmann et al., 2005; Assmus et al., 2006; Kang et al., 2006; Meluzin et al., 2006; Meyer et al., 2006; Abdel-Latif et al., 2007; Menasché et al., 2008]. Thus, the development of a method that will increase stem cell survival after transplantation into infarcted myocardium is of great clinical significance.
Apoptosis of transplanted stem cells, which result in low cell survival, is partially related to an increase in caspase activity. Caspases, in addition to producing apoptosis, have also been shown to down-regulate serine/threonine protein kinase Akt (Akt) in which is known to promote cell survival [Rokudai et al., 2000; Zhang et al., 2001; Robey et al., 2008]. Further, studies have shown that animals exposed to a high oxygen concentration prior to the induction of myocardial ischemia decreases myocardial cell injury and apoptosis [Choi et al., 2006; Foadoddini et al., 2011].
It was hypothesized therefore, that preconditioning mesenchymal stem cells (MSC) with 100% oxygen (hyperoxia) [Khan et al., 2009] and/or Z-VAD-FMK pan-caspase inhibitor (CI) [Yaoita et al., 1998; Mersmann et al., 2008] prior to placement into a hypoxic environment would attenuate apoptosis and promote MSC survival. The present study was undertaken to test this hypothesis. Indeed preconditioning MSCs in vitro with hyperoxia and/or CI provided a protective effect on hypoxia-induced apoptosis due to a down-regulation of apoptotic caspases and an increase in survival markers including Akt1, nuclear factor-kappa B (NF-κB) and B-cell CLL/lymphoma 2 (Bcl-2).
METHODS
MSC ISOLATION FROM RAT BONE MARROW
Rat MSCs were isolated from the bone marrow of adult male Fisher-344 rats weighing between 150 and 200 g. The bone marrow cells were placed into tissue culture plates with low glucose Dulbecco′s modified Eagle′s medium (DMEM)/GlutaMAX, 10% heat inactivated fetal bovine serum (FBS), 30 U/ml penicillin, and 30 μg/ml streptomycin (Life Technologies, Carlsbad, CA). The tissue culture plates were then kept in a humidified tissue culture chamber at 37°C, 5% carbon dioxide (CO2), and 21% oxygen (O2). After three passages, the cells were detached from the tissue culture plates using accutase (Millipore, Billerica, MA) and a sample of the cells were analyzed by fluorescence assisted cell sorting (FACS) confirming MSC lineage by the detection of CD 29 (Integrin-β1) and CD54 (ICAM-1). MSCs from passage three were used for the experiments.
PRECONDITIONING OF MSCs PRIOR TO HYPOXIA EXPOSURE: EXPERIMENTAL PROTOCOL
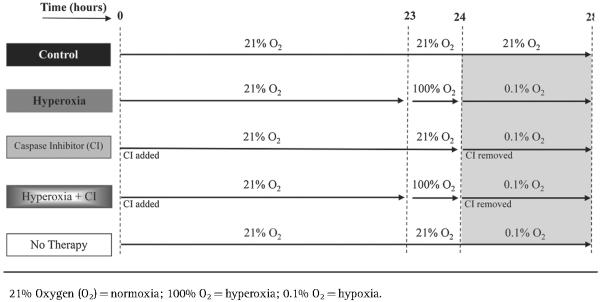
The in vitro experimental protocol is outlined in Table I. To simulate the hypoxic environment that MSCs face when transplanted into infarcted myocardium, a humidified tissue culture chamber infused with O2 and nitrogen oxide were used to achieve 0.1% O2 (hypoxia). The tissue culture chamber was set to 37°C with 5% CO2. MSCs were preconditioned with one of the following treatments prior to hypoxia exposure: 100% O2 (hyperoxia), 20 μM pan-caspase inhibitor Z-VAD-FMK (CI) (Promega, Madison, WI), or the combination of the two (hyperoxia plus CI). In addition, MSCs exposed to hypoxia without preconditioning were evaluated. All MSCs that were exposed to hypoxia were compared to MSCs exposed to only 21% O2 (normoxia) without treatment (control).
TABLE I.
Experimental Protocol
|
MSCs preconditioned with hyperoxia consisted of placing the cells in DMEM/GlutaMAX for 23 hours in normoxia followed by 1 h exposure with hyperoxia in which 100% O2 was infused into a sealed chamber; at the end of hyperoxia, the medium was removed and substituted for a low nutrient medium (DMEM with pyruvate, low glucose, no glutamine, no phenol red, and no FBS; Life Technologies) followed by 4 h of hypoxia. MSCs preconditioned with CI consisted of placing the cells in DMEM/GlutaMAX with CI for 24 h in normoxia; at the end of 24 h the medium along with CI were removed and substituted for a low nutrient medium followed by 4 h of hypoxia. MSCs were also preconditioned with the combination of hyperoxia plus CI prior to being exposed to hypoxia following protocol described above. In addition, MSCs exposed to hypoxia without preconditioning were evaluated by placing the cells in normoxia for 24 h in DMEM/GlutaMAX followed by 4 h of hypoxia in a low nutrient medium. Control MSCs were placed in normoxia for a total of 28 h in DMEM/GlutaMAX without treatment. Analysis of MSCs occurred at the end of 28 h for all groups.
TERMINAL DEOXYNUCLEOTIDYL TRANSFERASE dUTP NICK END LABELING (TUNEL)
TUNEL assays were performed to determine the extent of apoptosis in MSCs. MSCs were plated in 24-well plates at a density of 4.0 × 10⁴ cells per well. At the end of the experimental protocol, MSCs were fixed with 4% paraformaldehyde for 1 h followed by dehydration with 70% ethanol for 1 h both at room temperature. The MSCs were then blocked in 3% hydrogen peroxide in methanol for 20 minutes and permeabilized with 0.1% Triton-X in sodium citrate for 40 min both at room temperature. The cells were washed twice with phosphate-buffered saline (PBS) and then incubated with a labeling solution consisting of terminal deoxynucleotidyl transferase and nucleotide mixture in a ratio of 1:10 obtained from the In-Situ Cell Death Detection Kit-Fluorescein (Roche Applied Science, Indianapolis, IN) at 37°C for 2 h. MSCs were then washed three times with PBS and mounted using VECTASHIELD Hard Set Mounting Medium with 4,6-diamidino-2-phenylindole (DAPI) (Vector Laboratories, Burlingame, CA). A Nikon Eclipse TE 2000U fluorescence inverted microscope fitted with a high sensitivity CCD camera was used to capture images. The ultraviolet filter was used to detect DAPI (emitting a blue color). The blue (B) filter was used to detect fluorescein (emitting a green color) representing the apoptotic MSCs. An apoptotic score index (%) was calculated by randomly counting 50 DAPI positive cells per well and determining the number of these cells that had green fluorescence (apoptosis); this was repeated ten different times and the average determined.
FACS ANALYSIS
FACS analysis was conducted to determine the degree of apoptosis in MSCs by quantifying the degree of Annexin V labeling. MSCs were plated in six-well plates at a density of 3.2 × 10⁵ cells per well. At the end of the experimental protocol, 3 μg/ml Alexa Fluor 488 Annexin V (Life Technologies) was directly added to the culture medium and after 15 min the reaction was stopped by adding Annexin V binding buffer. In addition, 0.1 μg/ml propidium iodide (Life Technologies) was added to the culture medium to determine the degree of dead cells by FACS analysis. The cells were then harvested by mechanical scraping and analyzed using a BD FACS Calibur Flow Cytometry System (BD Biosciences, San Jose, CA). The fluorescence intensity was measured with excitation at 488 nm and emission at 530 nm. FlowJo computer software was used to analyze the data.
RIBONUCLEIC ACID (RNA) ISOLATION AND REVERSE TRANSCRIPTION POLYMERASE CHAIN REACTION (RT-PCR)
MSCs were plated in six-well plates at a density of 3.2 × 10⁵ cells per well. At the conclusion of the experimental protocol, total RNA was isolated using the RNeasy Mini Kit (Qiagen, Valencia, CA). RNA samples with an optical density A260/A280 ratio between 1.8 and 2.1 were used. RT-PCR was then performed using the Transcriptor First Strand Complementary DNA (cDNA) Synthesis Kit (Roche Applied Science) to synthesis cDNA. RT-PCR was performed with 1 μg of RNA template. The reaction was carried out using the Veriti Thermal Cycler (Applied Biosystems, Carlsbad, CA) and random hexamer primers.
WESTERN BLOT
MSC protein expression of cleaved caspases 1, 3, 6, 7, and 9, and phosphorylated Akt1, Bcl-2, and NF-κB were determined. MSCs were homogenized with non-denaturing lysis buffer (Abcam, Cambridge, MA); the lysates were then centrifuged at 10,000g for 20 min at 4°C and the supernatant was used for further studies. Using a Pierce BCA Protein Assay Kit (Thermo Scientific, Rockford, IL) the protein concentration of the lysates was determined; 30 μg of protein lysate was denatured in sample buffer (protein to sample buffer ratio 1:3) and subjected to sodium dodecyl sulfate–polyacrylamide gel electrophoresis (SDS–PAGE) on a 10–2% tris–glycine gel (Life Technologies). The proteins within the gel were then transferred to a polyvinylidene difluoride membrane (Thermo Scientific) and blocked with 5% non-fat milk powder in 10 mM Tris, 100 mM NaCl, and 0.1% Tween 20 for 1 h at room temperature. The blocked membranes were then incubated with rabbit-derived primary antibodies including cleaved caspases 1, 3, 6, 7, and 9, and phosphorylated Akt1 at position 473 serine, phosphorylated Bcl-2 at position 70 serine, and phosphorylated NF-κB–p65 at position 536 serine (Cell Signaling Technology, Inc., Boston, MA). GAPDH antibody was used as a control (Cell Signaling Technology, Inc.). Membrane bound antibodies were detected using appropriate horseradish peroxidase-labeled secondary antibodies by an enhanced chemiluminescence-detection system (ECL Advanced Kit; GE Healthcare Biosciences, Pittsburgh, PA). Protein expression was quantified by computer analysis using UN-SCAN-IT gel analysis software version 6.1 (Silk Scientific, Inc., Orem, UT).
QUANTITATIVE REAL-TIME REVERSE TRANSCRIPTION POLYMERASE CHAIN REACTION (QRT-PCR)
The MSC genetic expression of caspases 1, 3, 6, 7, and 9, and Akt1, NF-κB, and Bcl-2 were determined. Caspases play an important role in apoptosis, while Akt1, Bcl-2, and NF-κB increase cell survival [Thornberry and Lazebnik, 1998; Rokudai et al., 2000; Brazil and Hemmings, 2001; Valen et al., 2001; Cory and Adams, 2002]. At the end of the experimental protocol using LightCycler 480 SYBR Green I Master Mix (Roche Applied Science), 100 ng of cDNA from each experimental condition, and respective primers (Table II), qRT-PCR was performed using the Light Cycler 480 System (Roche Applied Science). Each sample was normalized to the control gene glyceraldehyde 3-phosphate dehydrogenase (GAPDH).
TABLE II.
Primers Used for Quantitative Real-Time Reverse Transcription Polymerase Chain Reaction
| Primer | Sequence |
|---|---|
| 5′ Caspase 1 | GACAGGTCCTGAGGGCAAAG |
| 3′ Caspase 1 | AAAAGTTCATCCAGCAATCCATTT |
| 5′ Caspase 3 | TGGTACCGATGTCGATGCAGC |
| 3′ Caspase 3 | GGTCCACAGGTCCGTTCGTT |
| 5′ Caspase 6 | CTGCTCAAGATTCACCAGGT |
| 3′ Caspase 6 | ACAGGCCTGGATGATGAATA |
| 5′ Caspase 7 | ACGCTAAGCCAGACCGCTCCA |
| 3′ Caspase 7 | CCGGACATCCATACCTGTCGCTT |
| 5′ Caspase 9 | CCTCATCATCAACAACGTGA |
| 3′ Caspase 9 | ATGAGAGAGGATGACCACCA |
| 5′ Aktl | AACGGACTTCGGGCTGTG |
| 3′ Aktl | TTGTCCTCCAGCACCTCAGG |
| 5′ Bcl-2 | TCCTCCCGACCTATGATACA |
| 3′ Bcl-2 | CGGTTGCTCTGAGACATTTT |
| 5′ NF-κB | CCCCACACTGTAAACCAAAG |
| 3′ NF-κB | GAAAAGCTCAAGCCACCATA |
| 5′ GAPDH | GCTCTCTGCTCCTCCCTGTTC |
| 3′ GAPDH | GCCGTTGAACTTGCCGTGGG |
BROMODEOXYURIDINE (BRDU) ASSAY
To quantify the degree of MSC proliferation, BrdU assays were performed using the Cell Proliferation ELISA BrdU Colorimetric Assay Kit (Roche Applied Science). MSCs were plated in 96-well plates at a density of 2.0 × 10⁴ cells per well. At the end of the experimental protocol, MSCs were labeled with BrdU for 2 h at 37°C. The MSCs were then fixed and denatured for 30 min followed by exposure to a peroxidase conjugated anti-BrdU antibody for 90 min all at room temperature. The MSCs were then washed with PBS three times followed by incubation with a peroxidase substrate solution at room temperature until the development of a noticeable color sufficient for photometric detection in which at that point the reaction was stopped using 1 M H2SO4. The degree of color change was quantified using the Beckman Coulter AD 340 Plate Reader (Beckman Coulter, Brea, CA) to determine the degree of cell proliferation. An absorbance wavelength of 450 nm and reference wavelength of 690 nm were used.
STATISTICAL ANALYSIS
Data are presented as mean ± 1 standard deviation. To determine statistical significance among groups analysis of variance (ANOVA) was first performed. If ANOVA was statistically significant, the Student′s t-test was then performed to compare sub-groups. A P-value <0.05 was considered as statistically significant.
RESULTS
TUNEL ASSAY OF PRECONDITIONED MSCs EXPOSED TO HYPOXIA
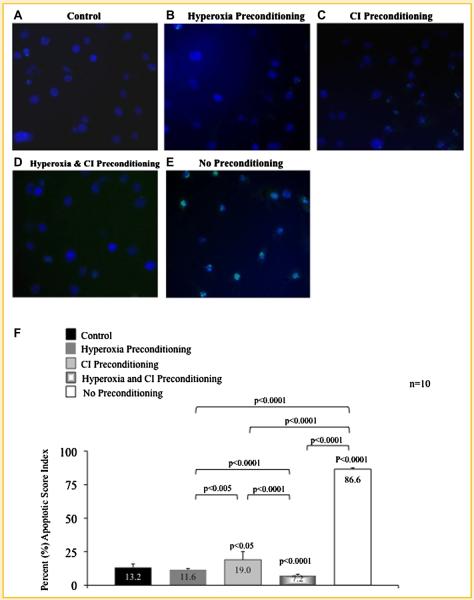
MSCs preconditioned with hyperoxia (Fig. 1B), CI (Fig. 1C), and particularly with the combination of hyperoxia plus CI (Fig. 1D) resulted in less apoptosis compared to MSCs exposed to hypoxia without preconditioning (Fig. 1E); this was demonstrated by a decrease in MSC green fluorescence seen on microscopy. The apoptotic score index (Fig. 1F) determined by TUNEL assays for MSCs preconditioned with hyperoxia, CI, or with the combination was 11.6%, 19.0%, and 7.2%, respectively, and were all significantly lower compared to MSCs exposed to hypoxia without preconditioning (86.6%). Control MSCs had an apoptotic score index of 13.2%. Apoptotic score index for the entire group was statistically significant (ANOVA, P < 0.0001); P-values between sub-groups are shown in Figure 1F.
Fig. 1.
TUNEL assay of preconditioned mesenchymal stem cells (MSC) following exposure to hypoxia. A: MSCs exposed only to normoxia without treatment (control). B: MSCs preconditioning with hyperoxia; (C) MSCs preconditioned with pan-caspase inhibitor (CI); and (D) MSCs preconditioned with the combination of hyperoxia and CI prior to hypoxia exposure. Preconditioning with hyperoxia, CI, or the combination resulted in a decrease in apoptosis as compared to (E) MSCs exposed to hypoxia without preconditioning. This is obvious by a decrease in green fluorescence which represents apoptotic MSCs. Nucleic DNA has been labeled by DAPI staining (blue fluorescence). F: The apoptotic score index determined by TUNEL assays for MSCs preconditioned with hyperoxia, CI or the combination are shown. P-values above columns represent comparison to control; NS, non- significant.
ANNEXIN V EXPRESSION OF PRECONDITIONED MSCs EXPOSED TO HYPOXIA
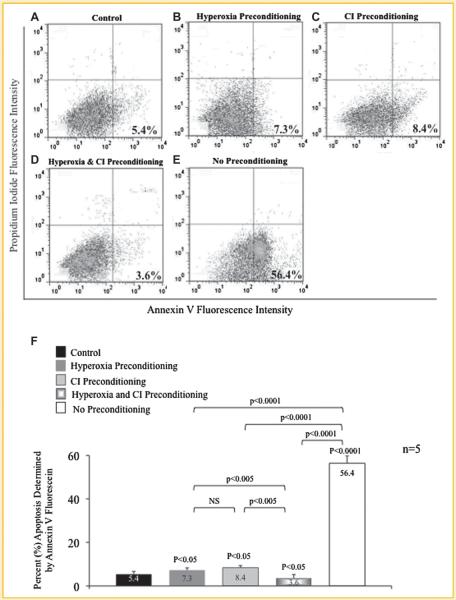
The extent apoptosis of MSCs preconditioned prior to hypoxia exposure with hyperoxia, CI, or the combination of hyperoxia plus CI was further analyzed using Annexin V fluorescein and FACS analysis (Fig. 2). MSCs preconditioned with hyperoxia (7.3%; Fig. 2B), CI (8.4%; Fig. 2C), or particularly with the combination (3.6%; Fig. 2D) significantly reduced Annexin V expression compared to MSCs exposed to hypoxia without preconditioning (56.4%; Fig. 2E). Control MSCs exposed to normoxia had an Annexin V expression of 5.4% (Fig. 2A). Annexin V expression for the entire group was statistically significant (ANOVA, P < 0.0001); P-values between sub-groups are shown in Figure 2F.
Fig. 2.
Annexin V expression of preconditioned mesenchymal stem cells (MSC) following exposure to hypoxia. A: MSCs exposed only to normoxia without treatment (control). B: MSCs preconditioned with hyperoxia; (C) MSCs preconditioned with pan-caspase inhibitor (CI); and (D) MSCs preconditioned with the combination of hyperoxia and CI prior to hypoxia exposure. Preconditioning with hyperoxia, CI, or the combination resulted in a decrease in apoptosis as compared to (E) MSCs exposed to hypoxia without preconditioning. This is evident by a decrease in Annexin V expression (percentage shown) quantified by fluorescence assisted cell sorting. Lower right quadrant represents Annexin V positive apoptotic cells; upper right quadrant represents propidium iodide (PI) positive dead cells; and lower left quadrant represents Annexin V and PI negative cells or alive cells (A–E). F: Percent apoptosis of MSCs with and without preconditioning treatment determined by Annexin V expression. P-values above columns represent comparison to control; NS, non-significant.
GENE AND PROTEIN EXPRESSION OF PRECONDITIONED MSCs EXPOSED TO HYPOXIA
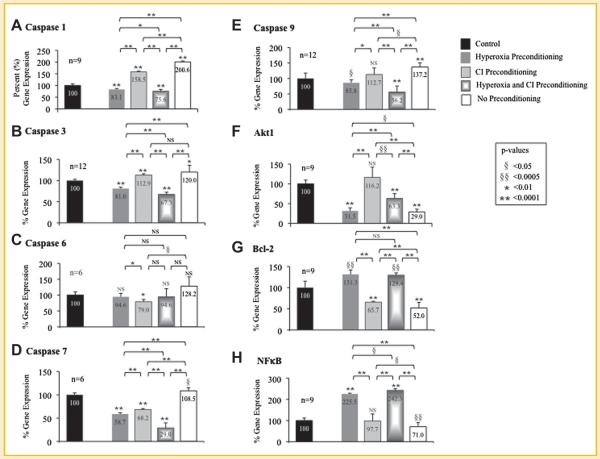
The genetic expression of caspases 1, 3, 6, 7, and 9, and Akt1, Bcl-2, and NF-κB were determined using qRT-PCR for MSCs exposed to hypoxia after preconditioning with hyperoxia, CI, or the combination of hyperoxia plus CI (Fig. 3; Table III). Gene expression for MSCs exposed to hypoxia is represented as a percent relative to MSCs exposed only to normoxia without treatment (control) set at 100%.
Fig. 3.
Gene expression of preconditioned mesenchymal stem cells (MSC) following exposure to hypoxia. Quantitative real-time reverse transcription polymerase chain reaction (qRT-PCR) was performed to determine gene expression of caspases (A) 1, (B) 3, (C) 6, (D) 7, and (E) 9, and survival markers (F) Akt1, (G) Bcl-2, and (H) NF-κB in MSCs that underwent preconditioning with hyperoxia, caspase inhibitor (CI), or the combination prior to hypoxia exposure. Gene expression of MSCs exposed to hypoxia is represented as a percent relative to MSCs exposed only to normoxia without treatment (control) set at 100%. MSCs that underwent preconditioning, particularly combination of hyperoxia plus CI, resulted in a decrease in caspases while MSCs that were exposed to hypoxia with no preconditioning had an increase in caspase expression. In addition, preconditioning with hyperoxia or CI resulted in an increase in Akt1, Bcl-2, and NF-κB gene expression while no preconditioning resulted in a decrease in these survival markers after hypoxia. P-values above columns represent comparison to control MSCs; NS, non-significant.
TABLE III.
Percent (%) Change in Gene Expression After Hypoxia Exposure in MSC Receiving Preconditioning Therapy as Compared to No Preconditioning Therapy
| Preconditioning Therapy |
|||
|---|---|---|---|
| Hyperoxia (%) | Caspase Inhibitor (CI, %) | Hyperoxia + CI (%) | |
| Caspase 1 | ↓117.5 | ↓42.0 | ↓124.9 |
| Caspase 3 | ↓39.0 | ↓7.1 | ↓52.7 |
| Caspase 6 | ↓33.5 | ↓49.1 | ↓33.5 |
| Caspase 7 | ↓49.8 | ↓40.2 | ↓79.5 |
| Caspase 9 | ↓51.4 | ↓24.5 | ↓81.0 |
| Aktl | →2.5 | →87.2 | →34.3 |
| Bcl-2 | →79.2 | →13.6 | →77.3 |
| NF-κB | →154.4 | →26.7 | →171.2 |
Caspase 1 gene expression
MSCs preconditioned with hyperoxia (83.1%), CI (158.5%), or the combination (75.6%) significantly reduced caspase 1 gene expression compared to MSCs without preconditioning (200.6%). Caspase 1 gene expression for the entire group was statistically significant (ANOVA, P < 0.0001); P-values between sub-groups are shown in Figure 3A.
Caspase 3 gene expression
MSCs preconditioned with hyperoxia (81.0%) or the combination of hyperoxia plus CI (67.3.%) significantly reduced caspase 3 gene expression compared to MSCs without preconditioning (120.0%). There was no significant difference in caspase 3 gene expression between MSCs preconditioned with CI (112.9%) compared to MSCs without preconditioning. Caspase 3 gene expression for the entire group was statistically significant (ANOVA, P < 0.0001); P-values between sub-groups are shown in Figure 3B.
Caspase 6 gene expression
MSCs preconditioned with CI (79.0%) significantly reduced caspase 6 gene expression compared to MSCs without preconditioning (128.2%); however, there was no statistical difference in MSCs that were preconditioned with hyperoxia (94.6%) or the combination of hyperoxia plus CI (94.6%) compared to no preconditioning. Caspase 6 gene expression for the entire group was statistically significant (ANOVA, P < 0.05); P-values between sub- groups are shown in Figure 3C.
Caspase 7 gene expression
MSCs preconditioned with hyperoxia (58.7%), CI (68.2%), or the combination (29.0%) significantly reduced caspase 7 gene expression compared to MSCs without preconditioning (108.5%). Caspase 7 gene expression for the entire group was statistically significant (ANOVA, P < 0.0001); P-values between sub- groups are shown in Figure 3D.
Caspase 9 gene expression
Preconditioning MSCs with hyperoxia (85.8%), CI (112.7%), or the combination (56.2%) significantly reduced caspase 9 gene expression compared to MSCs without preconditioning (137.2%). Caspase 9 gene expression for the group was statistically significant (ANOVA P < 0.0001); P-values between sub-groups are shown in Figure 3E.
Akt1 gene expression
MSCs preconditioned with hyperoxia (31.5%), CI (116.2%), or the combination (63.3%) significantly increased Akt1 gene expression compared to MSCs without preconditioning (29.0%). Akt1 gene expression for the entire group was statistically significant (ANOVA, P < 0.0001); P-values between sub-groups are shown in Figure 3F.
Bcl-2 gene expression
MSCs preconditioned with hyperoxia (131.3%), CI (65.7%), or the combination (129.4%) significantly increased Bcl-2 gene expression compared to MSCs without preconditioning (52.0%). Bcl-2 gene expression for the entire group was statistically significant (ANOVA, P < 0.0001); P-values between sub-groups are shown in Figure 3G.
NF-κB gene expression
MSCs preconditioned with hyperoxia (225.5%), CI (97.7%), or the combination (242.3%) significantly increased NF-κB gene expression compared to MSCs without preconditioning (71.0%). NF-κB gene expression for the entire group was statistically significant (ANOVA, P<0.0001); P-values between sub-groups are shown in Figure 3H.
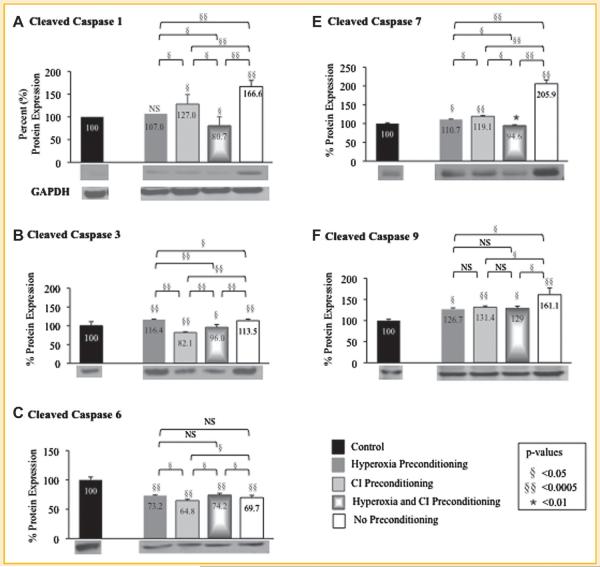
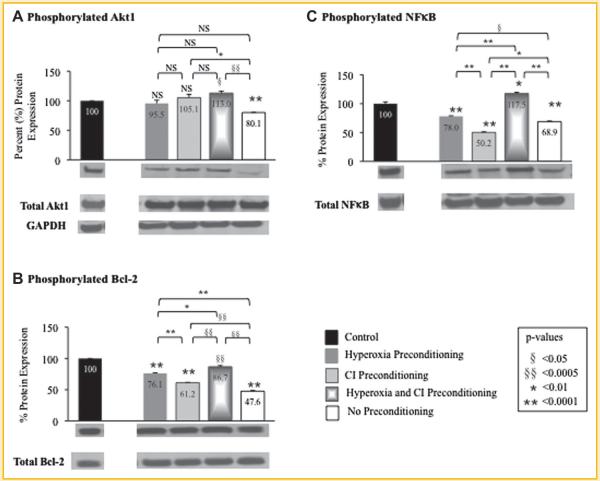
The protein expression of cleaved caspases 1, 3, 6, 7, and 9, and phosphorylated Akt1, Bcl-2, and NF-κB were determined using Western blot analysis for MSCs exposed to hypoxia after preconditioning with hyperoxia, CI, or the combination of hyperoxia plus CI (Fig. 4 and Fig. 5; Table IV). Protein expression for MSCs exposed to hypoxia is represented as a percent relative to MSCs exposed only to normoxia without treatment (control) set at 100%. The protein expression of cleaved caspases 1, 3, 6, 7, and 9, and phosphorylated Akt1, Bcl-2, and NF-κB in preconditioned MSCs compared to MSCs with no preconditioning exposed to hypoxia where similar to that of genetic expression.
Fig. 4.
Quantitative protein expression and representative Western blots (immediately beneath each graph) of preconditioned mesenchymal stem cells (MSC) following exposure to hypoxia. Western blots were performed to determine protein expression of cleaved caspases (A) 1, (B) 3, (C) 6, (D) 7, and (E) 9 in MSCs that underwent preconditioning with hyperoxia, caspase inhibitor (CI), or the combination prior to hypoxia exposure. Protein expression of MSCs exposed to hypoxia is represented as a percent relative to MSCs exposed only to normoxia without treatment (control) set at 100%. MSCs that underwent preconditioning resulted in a decrease in cleaved caspases compared to MSCs with no preconditioning that were exposed to hypoxia. GAPDH Western blot is also shown as the loading control for all experiments (quantification of protein expression confirmed by computer analysis). P-values above columns represent comparison to control MSCs; NS, non-significant.
Fig. 5.
Quantitative protein expression and representative Western blots (immediately beneath each graph) of preconditioned mesenchymal stem cells (MSC) following exposure to hypoxia. Western blots were performed to determine protein expression of (A) phosphorylated Akt1 at position 473 serine, (B) phosphorylated Bcl-2 at position 70 serine, and (C) phosphorylated NF-κB at position 536 serine in MSCs that underwent preconditioning with hyperoxia, caspase inhibitor (CI), or the combination prior to hypoxia exposure. Protein expression was determined as the ratio of phosphorylated to total protein expression. Phosphorylated protein expression of MSCs exposed to hypoxia is represented on the graphs as a percent relative to MSCs exposed only to normoxia without treatment (control) set at 100%. Preconditioning with hyperoxia and/or CI resulted in an increase in phosphorylated Akt1, Bcl-2, and NF-κB protein expression compared to MSCs with no preconditioning that were exposed to hypoxia. GAPDH Western blot is also shown as the loading control for all experiments (quantification of protein expression confirmed by computer analysis). P-values above columns represent comparison to control MSCs; NS, non-significant.
TABLE IV.
Percent (%) Change in Protein Expression After Hypoxia Exposure in MSC Receiving Preconditioning Therapy as Compared to No Preconditioning Therapy
| Preconditioning Therapy |
|||
|---|---|---|---|
| Hyperoxia (%) | Caspase Inhibitor (CI, %) | Hyperoxia + CI (%) | |
| Cleaved Caspase 1 | ↓59.6 | ↓39.6 | ↓85.9 |
| Cleaved Caspase 3 | →2.9 | ↓31.4 | ↓17.5 |
| Cleaved Caspase 6 | →3.5 | ↓4.9 | →4.5 |
| Cleaved Caspase 7 | ↓95.2 | ↓86.8 | ↓111.3 |
| Cleaved Caspase 9 | ↓34.4 | ↓29.7 | ↓32.1 |
| Phosphorylated Aktl | →15.4 | →25.0 | →32.9 |
| Phosphorylated Bcl-2 | →28.5 | →13.6 | →39.1 |
| Phosphorylated NF-κB | →9.1 | ↓18.7 | →48.6 |
CELL PROLIFERATION OF PRECONDITIONED MSCs EXPOSED TO HYPOXIA
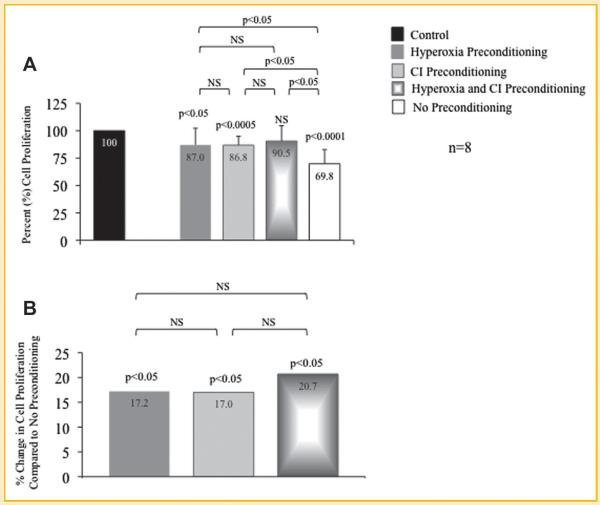
BrdU experiments were performed to determine the effects of hypoxia on cell proliferation of MSCs preconditioned with hyperoxia, CI, or the combination of hyperoxia plus CI; cell proliferation of MSCs exposed to hypoxia is represented as a percent relative to MSCs exposed only to normoxia without treatment (control) set at 100%. Cell proliferation was significantly greater in MSCs preconditioned with hyperoxia (87.0%), CI (86.8%), or the combination (90.5%) compared to MSCs without preconditioning (69.8%; Fig. 5A). MSC proliferation when preconditioned with hyperoxia, CI, or the combination was 17.2%, 17.0%, and 20.7%, respectively, greater compared to MSCs exposed to hypoxia without preconditioning (Fig. 5B). MSC proliferation for the entire group was statistically significant (ANOVA, P<0.0001); P-values between sub-groups are shown in Figure 6.
Fig. 6.
Cell proliferation of preconditioned mesenchymal stem cells (MSC) following exposure to hypoxia. Bromodeoxyuridine (BrdU) assays were performed to determine cell proliferation of MSCs that underwent preconditioning with hyperoxia, pan-caspase inhibitor (CI), or the combination prior to hypoxia exposure. A: Proliferation of MSCs exposed to hypoxia is represented as a percent relative to MSCs exposed only to normoxia without treatment (control) set at 100%. Preconditioned MSCs with the combination of hyperoxia plus CI prior to hypoxia exposure maintained a similar cell proliferation as compared to control MSCs; cell proliferation was the lowest in MSCs exposed to hypoxia without preconditioning. P-values above columns represent comparison to control MSCs. B: MSCs that underwent preconditioning with hyperoxia, CI, or the combination prior to hypoxia exposure resulted in significantly greater cell proliferation compared to MSCs that were exposed to hypoxia without preconditioning.P-values above columns represent comparison to MSCs exposed to hypoxia without preconditioning; NS, non-significant.
DISCUSSION
The present study demonstrated that MSCs preconditioned with hyperoxia, CI, or both resulted in an increased survival of cells after exposure to hypoxia. Increased survival of stem cells delivered to post-myocardial infarction patients potentially will improve LV function and decrease the incidence of heart failure; if these data are confirmed by in vitro studies this will be of great clinical significance.
Myocardial infarction in experimental animal models demonstrated that only a small number of stem cells survive after transplantation [Bel et al., 2003; Suzuki et al., 2004]. Survival of myoblasts directly administered into infarcted mouse hearts was approximately 7% after 72 h [Suzuki et al., 2004]. Further, in patients with myocardial infarction in whom bone marrow cells were delivered intra-coronary only approximately 1–3% of the cells were found within the myocardium [Hofmann et al., 2005]. These studies provide insight to the fact that stem cell therapy in myocardial infarction has showed only minimal improvement in left ventricular function [Miyahara et al., 2006; Strauer and Steinhoff, 2011]. In a recent meta-analysis involving 18 randomized and non-randomized trials with 999 patients with acute myocardial infarction or chronic ischemic cardiomyopathy, transplantation of stem cells increased left ventricular ejection fraction by 5.4% (P<0.001), decreased infarct size by 5.5% (P=0.003), and decreased left ventricular end-systolic volume by 4.8 ml (P=0.006) compared to control [Abdel-Latif et al., 2007]. A potential contributing factor for the sub-optimal results seen with stem cell transplantation post-myocardial infarction is the ischemic myocardium that is less than ideal for stem cell survival [Zhang et al., 2001; Robey et al., 2008].
It has been shown that in hypoxic myocardium apoptosis of transplanted stem cells occur [Zhang et al., 2001; Robey et al., 2008]. Thus, interventions that may decrease apoptosis of stem cells delivered into this hypoxic environment may have the potential to enhance cell survival. Studies have shown that genetically engineered stem cells that continuously inhibit apoptosis increased cell survival after transplantation [Li et al., 2007; Hodgkinson et al., 2010]; however, the long-term effects of the transplanted cells, which are continuously inhibiting apoptosis, may be harmful [Filip et al., 2008].
Caspases are cysteine proteases that mediate apoptosis through proteolytic activity [Thornberry and Lazebnik, 1998]. The present study demonstrates that brief preconditioning of stem cells with hyperoxia or CI prior to exposure to a hypoxic environment significantly down-regulates gene and protein expression of caspases compared to no preconditioning. This technique has the advantage of avoiding continuous exposure to apoptotic inhibitors post-transplantation. Myocardial infarct models have also demonstrated that pretreatment of animals with hyperoxia prior to myocardial infarction decreased caspases resulting in decreased apoptotic cell death and infarct size [Foadoddini et al., 2011]. Interestingly, MSCs preconditioned with the combination of hyperoxia and CI prior to hypoxia exposure in this study had a synergistic effect (i.e., greater down-regulation of caspases compared to each intervention alone).
In addition to caspase inhibition, preconditioning of MSCs with hyperoxia, CI, and/or the combination prior to hypoxia exposure up-regulates markers of survival such as Akt1, Bcl-2, and NF-κB. The kinase activity of Akt is known to have a protective effect against apoptosis and thus, increases cell survival [Brazil and Hemmings, 2001]. Studies have shown that caspases also promote apoptosis by down-regulating Akt; inhibition of caspases blocks the down-regulation of Akt and thus, promotes cell survival [Rokudai et al., 2000]. The data from the present study, which demonstrated that MSCs preconditioned with CI prior to hypoxia exposure significantly increased Akt1 gene and protein expression compared to no preconditioning, are in agreement with previous studies.
Bcl-2 family of proteins regulate the activation of caspases resulting in anti-apoptotic activity [Cory and Adams, 2002]. Caspase 3 has the ability to cleave Bcl-2 in which the cleaved sub-unit can further promote caspase activation [Kirsch et al., 1999]. In addition, small animal models have shown that preconditioning with hyperoxia prior to myocardial ischemia can increase cardiac levels of Bcl-2, decrease caspase activity, and ultimately decrease myocardial infarct size [Choi et al., 2006; Foadoddini et al., 2011]. This study also demonstrated that MSCs preconditioned with hyperoxia and/or CI prior to hypoxia exposure significantly increased Bcl-2 gene and protein expression compared to no preconditioning. Preconditioning with hyperoxia had the greatest effect on Bcl-2 gene and protein expression compared to no preconditioning.
NF-κB is a redox-sensitive transcription factor that regulates several cellular processes including inflammation, cellular growth, and apoptosis [Wang et al., 1996; Franek et al., 2001; Valen et al., 2001]. Hyperoxia has been shown to activate NF-κB resulting in a decrease in apoptosis [Franek et al., 2001]. Studies have demonstrated that preconditioning with hyperoxia prior to myocardial ischemia decreases myocardial infarct size partially due to an increase in NF-κB activity [Tähepõld et al., 2003; Choi et al., 2006; Foadoddini et al., 2011]. In this study, it was also found that MSCs preconditioned with hyperoxia prior to hypoxia exposure significantly increased NF-κB gene and protein expression compared to no preconditioning. Preconditioning with the combination of hyperoxia plus CI resulted in a synergistic effect in gene and protein expression compared to no preconditioning.
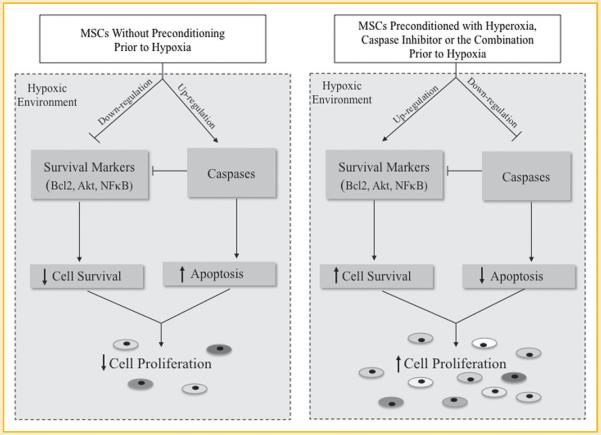
Preconditioning MSCs with hyperoxia, CI, or the combination prior to hypoxia exposure resulted in an approximately 20% increase in cell proliferation compared to MSCs that were exposed to hypoxia without preconditioning. The mechanism(s) responsible for this increase in MSC proliferation is at least partially due to the attenuation of apoptosis, as it is suggested by the down-regulation of caspases, and the up-regulation of cell survival markers like Akt1, Bcl-2, and NF-κB, all driven by the pretreatment of MSCs with hyperoxia and/or Z-VAD-FMK pan-caspase inhibitor (Fig. 7). Importantly, preconditioning of MSCs with hyperoxia, CI, or both does not have a continuous apoptotic effect after stem cell transplantation, the long-term effects of which may be harmful. These effects may prove to be of great clinical significance when transplanting stem cells into the hypoxic myocardium of post-myocardial infarction patients in order to attenuate LV remodeling and improve LV function.
Fig. 7.
Schematic diagram showing the effect of mesenchymal stem cells (MSC) preconditioned with hyperoxia, pan-caspase inhibitor, or the combination on apoptosis and cell survival in a hypoxic environment.
ACKNOWLEDGMENTS
This project was supported by Award Number UL1RR025755 from the National Center for Research Resources (K.D.B.) and National Institutes of Health Grants UL1RR025755 and EB006153 (P.K.). The authors would like to thank Dr Karuppaiyah Selvendiran for his assistance in the set-up of hypoxia and hyperoxia experiments.
Grant sponsor: National Center for Research Resources; Grant number: UL1RR025755; Grant sponsor: National Institutes of Health; Grant number: UL1RR025755.
REFERENCES
- Abdel-Latif A, Bolli R, Tleyjeh IM, Montori VM, Perin EC, Hornung CA, Zuba-Surma EK, Al-Mallah M, Dawn B. Adult bone marrow-derived cells for cardiac repair a systematic review and meta-analysis. Arch Intern Med. 2007;167:989–997. doi: 10.1001/archinte.167.10.989. [DOI] [PubMed] [Google Scholar]
- Assmus B, Honold J, Schachinger V, Britten MB, Fischer-Rasokat U, Lehmann R, Teupe C, Pistorius K, Martin H, Abolmaali ND, Tonn T, Dimmeler S, Zeiher AM. Transcoronary transplantation of progenitor cells after myocardial infarction. N Engl J Med. 2006;355:1222–1232. doi: 10.1056/NEJMoa051779. [DOI] [PubMed] [Google Scholar]
- Bel A, Messas E, Agbulut O, Richard P, Samuel JL, Bruneval P, Hagège AA, Menasché P. Transplantation of autologous fresh bone marrow into infarcted myocardium: A word of caution. Circulation. 2003;108(Suppl.I):II-247–II-252. doi: 10.1161/01.cir.0000089040.11131.d4. [DOI] [PubMed] [Google Scholar]
- Boudoulas KD, Hatzopoulos AK. Cardiac repair and regeneration: The Rubik's cube of cell therapy for heart disease. Dis Model Mech. 2009;2:344–358. doi: 10.1242/dmm.000240. [DOI] [PMC free article] [PubMed] [Google Scholar]
- Brazil DP, Hemmings BA. Ten years of protein kinase B signaling: A hard Akt to follow. Trends Biochem Sci. 2001;26:657–664. doi: 10.1016/s0968-0004(01)01958-2. [DOI] [PubMed] [Google Scholar]
- Chen SL, Fang WW, Ye F, Liu YH, Qian J, Shan SJ, Zhang JJ, Chunhua RZ, Liao LM, Lin S, Sun JP. Effect on left ventricular function of intracoronary transplantation of autologous bone marrow mesenchymal stem cell in patients with acute myocardial infarction. Am J Cardiol. 2004;94:92–95. doi: 10.1016/j.amjcard.2004.03.034. [DOI] [PubMed] [Google Scholar]
- Choi H, Kim SH, Chun YS, Cho YS, Park JW, Kim MS. In vivo hyperoxic preconditioning prevents myocardial infarction by expressing bcl-2. Exp Biol Med. 2006;231:463–472. doi: 10.1177/153537020623100412. [DOI] [PubMed] [Google Scholar]
- Cory S, Adams JM. The Bcl-2 family: Regulators of the cellular life-or- death switch. Nat Rev Cancer. 2002;2:647–656. doi: 10.1038/nrc883. [DOI] [PubMed] [Google Scholar]
- Filip S, Mokry J, Horacek J, English D. Stem cells and the phenomena of plasticity and diversity: A limiting property of carcinogenesis. Stem Cells Dev. 2008;17:1031–1038. doi: 10.1089/scd.2007.0234. [DOI] [PubMed] [Google Scholar]
- Foadoddini M, Esmailidehaj M, Mehrani H, Sadraei SH, Golmanesh L, Wahhabaghai H, Valen G, Khoshbaten A. Pretreatment with hyperoxia reduces in vivo infarct size and cell death by apoptosis with an early and delayed phase of protection. Eur J Cardiothorac Surg. 2011;39:233–240. doi: 10.1016/j.ejcts.2010.05.036. [DOI] [PubMed] [Google Scholar]
- Franek WR, Horowitz S, Stansberry L, Kazzaz JA, Koo HC, Li Y, Arita Y, Davis JM, Mantell AS, Scott W, Mantell LL. Hyperoxia inhibits oxidant- induced apoptosis in lung epithelial cells. J Biol Chem. 2001;276:569–575. doi: 10.1074/jbc.M004716200. [DOI] [PubMed] [Google Scholar]
- Hodgkinson CP, Gomez JA, Mirotsou M, Dzau VJ. Genetic engineering of mesenchymal stem cells and its application in human disease therapy. Hum Gene Ther. 2010;21:1513–1526. doi: 10.1089/hum.2010.165. [DOI] [PMC free article] [PubMed] [Google Scholar]
- Hofmann M, Wollert KC, Meyer GP, Menke A, Arseniev L, Hertenstein B, Ganser A, Knapp WH, Drexler H. Monitoring of bone marrow cell homing into the infarcted human myocardium. Circulation. 2005;111:2198–2202. doi: 10.1161/01.CIR.0000163546.27639.AA. [DOI] [PubMed] [Google Scholar]
- Itoh G, Tamura J, Suzuki M, Ikeda H, Koike M, Nomura M, Jie T, Ito K. DNA fragmentation of human infarcted myocardial cells demonstrated by the nick end labeling method and DNA agarose gel electrophoresis. Am J Pathol. 1995;146:1325–1331. [PMC free article] [PubMed] [Google Scholar]
- Kang H, Lee H, Na S, Chang S, Park K, Kim H, Kim S, Chang H, Lee W, Kang W, Koo B, Kim Y, Lee D, Sohn D, Han K, Oh B, Park Y, Kim H. Differential effect of intracoronary infusion of mobilized peripheral blood stem cells by granulocyte colony stimulating factor on left ventricular function and remodeling in patients with acute myocardial infarction versus old myocardial infarction: The MAGIC Cell-3-DES randomized, controlled trial. Circulation. 2006;114(1Suppl.):I145–I151. doi: 10.1161/CIRCULATIONAHA.105.001107. [DOI] [PubMed] [Google Scholar]
- Khan M, Meduru S, Mohan IK, Kuppusamy ML, Wisel S, Kulkarni A, Rivera BK, Hamlin HL, Kuppusamy P. Hyperbaric oxygenation enhances transplanted cell graft and functional recovery in the infarct heart. J Mol Cell Cardiol. 2009;47:275–287. doi: 10.1016/j.yjmcc.2009.04.005. [DOI] [PMC free article] [PubMed] [Google Scholar]
- Kirsch DG, Doseff A, Chau BN, Lim DS, de Souza-Pinto NC, Hansford R, Kastan MB, Lazebnik YA, Hardwick JM. Caspase-3-dependent cleavage of Bcl-2 promotes release of cytochrome c. J Biol Chem. 1999;274:21155–22161. doi: 10.1074/jbc.274.30.21155. [DOI] [PubMed] [Google Scholar]
- Li W, Ma N, Ong LL, Nesselmann C, Klopsch C, Ladilov Y, Furlani D, Piechaczek C, Moebius JM, Lützow K, Lendlein A, Stamm C, Li RK, Steinhoff G. Bcl-2 engineered MSCs inhibited apoptosis and improved heart function. Stem Cells. 2007;25:2118–2127. doi: 10.1634/stemcells.2006-0771. [DOI] [PubMed] [Google Scholar]
- Meluzin J, Mayer J, Groch J, Janousek S, Hornácek I, Hlinomaz O, Kala P, Panovský R, Prásek J, Kamínek M, Stanícek J, Klabusay M, Korístek Z, Navrátil M, Dusek L, Vinklárková J. Autologous transplantation of mononuclear bone marrow cells in patients with acute myocardial infarction: The effect of the dose of transplanted cells on myocardial function. Am Heart J. 2006;152:975–e9. 975–e15. doi: 10.1016/j.ahj.2006.08.004. [DOI] [PubMed] [Google Scholar]
- Menasché P, Alfieri O, Janssens S, McKenna W, Reichenspurner H, Trinquart L, Vilquin JT, Marolleau JP, Seymour B, Larghero J, Lake S, Chatellier G, Solomon S, Desnos M, Hagège AA. The myoblast autologous grafting in ischemic cardiomyopathy (MAGIC) trial: First randomized placebo-controlled study of myoblast transplantation. Circulation. 2008;117:1189–1200. doi: 10.1161/CIRCULATIONAHA.107.734103. [DOI] [PubMed] [Google Scholar]
- Mersmann J, Zacharowski PA, Schmitz I, Zacharowski K. Caspase inhibitor Z-VAD-FMK reduces infarct size after myocardial ischaemia and reperfusion in rats but not in mice. Resuscitation. 2008;79:468–474. doi: 10.1016/j.resuscitation.2008.07.008. [DOI] [PubMed] [Google Scholar]
- Meyer GP, Wollert KC, Lotz J, Steffens J, Lippolt P, Fichtner S, Hecker H, Schaefer A, Arseniev L, Hertenstein B, Ganser A, Drexler H. Intracoronary bone marrow cell transfer after myocardial infarction: Eighteen months' follow-up data from the randomized, controlled BOOST (bone marrow transfer to enhance ST-elevation infarct regeneration) trial. Circulation. 2006;113:1287–1294. doi: 10.1161/CIRCULATIONAHA.105.575118. [DOI] [PubMed] [Google Scholar]
- Miyahara Y, Nagaya N, Kataoka M, Yanagawa B, Tanaka K, Hao H, Ishino K, Ishida H, Shimizu T, Kangawa K, Sano S, Okano T, Kitamura S, Mori H. Monolayered mesenchymal stem cells repair scarred myocardium after myocardial infarction. Nat Med. 2006;12:459–465. doi: 10.1038/nm1391. [DOI] [PubMed] [Google Scholar]
- Robey TE, Saiget MK, Reinecke H, Murry CE. Systems approaches to preventing transplanted cell death in cardiac repair. J Mol Cell Cardiol. 2008;45:567–581. doi: 10.1016/j.yjmcc.2008.03.009. [DOI] [PMC free article] [PubMed] [Google Scholar]
- Roger VL, Go AS, Lloyd-Jones DM, Benjamin EJ, Berry JD, Borden WB, Bravata DM, Dai S, Ford ES, Fox CS, Fullerton HJ, Gillespie C, Hailpern SM, Heit JA, Howard VJ, Kissela BM, Kittner SJ, Lackland DT, Lichtman JH, Lisabeth LD, Makuc DM, Marcus GM, Marelli A, Matchar DB, Moy CS, Mozaffarian D, Mussolino ME, Nichol G, Paynter NP, Soliman EZ, Sorlie PD, Sotoodehnia N, Turan TN, Virani SS, Wong ND, Woo D, Turner MB, American Heart Association Statistics Committee and Stroke Statistics Subcommittee Executive summary: Heart disease and stroke statistics—2012 update: A report from the American Heart Association. Circulation. 125:188–197. doi: 10.1161/CIR.0b013e3182456d46. [DOI] [PubMed] [Google Scholar]
- Rokudai S, Fujita N, Hashimoto Y, Tsuruo T. Cleavage and inactivation of antiapoptotic Akt/PKB by caspases during apoptosis. J Cell Physiol. 2000;182:290–296. doi: 10.1002/(SICI)1097-4652(200002)182:2<290::AID-JCP18>3.0.CO;2-8. [DOI] [PubMed] [Google Scholar]
- Schoen FJ, Mitchell RN. The heart. In: Kumar V, Abbas AK, Fausto N, editors. Robbins and Cotran: Pathologic basis of disease. 7th edition Elsevier Saunders; Philadelphia: 2005. pp. 555–618. [Google Scholar]
- Strauer BE, Steinhoff G. 10 years of intracoronary and intramyocardial bone marrow stem cell therapy of the heart: From the methodological origin to clinical practice. J Am Coll Cardiol. 2011;58:1095–1104. doi: 10.1016/j.jacc.2011.06.016. [DOI] [PubMed] [Google Scholar]
- Suzuki K, Murtuza B, Beauchamp JR, Smolenski RT, Varela-Carver A, Fukushima S, Coppen SR, Partridge TA, Yacoub MH. Dynamics and mediators of acute graft attrition after myoblast transplantation to the heart. FASEB J. 2004;18:1153–1155. doi: 10.1096/fj.03-1308fje. [DOI] [PubMed] [Google Scholar]
- Tähepõld P, Vaage J, Starkopf J, Valen G. Hyperoxia elicits myocardial protection through a nuclear factor kappaB-dependent mechanism in the rat heart. J Thorac Cardiovasc Surg. 2003;1259:650–660. doi: 10.1067/mtc.2003.36. [DOI] [PubMed] [Google Scholar]
- Thornberry NA, Lazebnik Y. Caspases: Enemies within. Science. 1998;281:1312–1316. doi: 10.1126/science.281.5381.1312. [DOI] [PubMed] [Google Scholar]
- Valen G, Yan ZQ, Hansson GK. Nuclear factor kappa-B and the heart. J Am Coll Cardiol. 2001;38:307–314. doi: 10.1016/s0735-1097(01)01377-8. [DOI] [PubMed] [Google Scholar]
- Wang CY, Mayo MW, Baldwin AS., Jr TNF- and cancer therapy-induced apoptosis: Potentiation by inhibition of NF-κB. Science. 1996;274:784–787. doi: 10.1126/science.274.5288.784. [DOI] [PubMed] [Google Scholar]
- Yaoita H, Ogawa K, Maehara K, Maruyama Y. Attenuation of ischemia/reperfusion injury in rats by a caspase inhibitor. Circulation. 1998;97:276–281. doi: 10.1161/01.cir.97.3.276. [DOI] [PubMed] [Google Scholar]
- Zhang M, Methot D, Poppa V, Fujio Y, Walsh K, Murry CE. Cardiomyocyte grafting for cardiac repair: Graft cell death and anti-death strategies. J Mol Cell Cardiol. 2001;33:907–921. doi: 10.1006/jmcc.2001.1367. [DOI] [PubMed] [Google Scholar]


