

Abstract
In the mammalian cerebral cortex, the diversity of interneuronal subtypes underlies a division of labor subserving distinct modes of inhibitory control1–7. A unique mode of inhibitory control may be provided by inhibitory neurons that specifically suppress the firing of other inhibitory neurons. Such disinhibition could lead to the selective amplification of local processing and serve the important computational functions of gating and gain modulation8,9. Although several interneuron populations are known to target other interneurons to varying degrees10–15, little is known about interneurons specializing in disinhibition and their in vivo function. Here we show that a class of interneurons that express vasoactive intestinal polypeptide (VIP) mediates disinhibitory control in multiple areas of neocortex and is recruited by reinforcement signals. By combining optogenetic activation with single cell recordings, we examined the functional role of VIP interneurons in awake mice, and investigated the underlying circuit mechanisms in vitro in auditory and medial prefrontal cortices. We identified a basic disinhibitory circuit module in which activation of VIP interneurons transiently suppresses primarily somatostatin- and a fraction of parvalbumin-expressing inhibitory interneurons that specialize in the control of the input and output of principal cells, respectively3,6,16,17. During the performance of an auditory discrimination task, reinforcement signals (reward and punishment) strongly and uniformly activated VIP neurons in auditory cortex, and in turn VIP recruitment increased the gain of a functional subpopulation of principal neurons. These results reveal a specific cell-type and microcircuit underlying disinhibitory control in cortex and demonstrate that it is activated under specific behavioural conditions.
Cortical inhibitory interneurons display great diversity in their physiology, connectivity and synaptic dynamics, but it has long been debated whether and to what extent function of an interneuron type follows from a unique combination of these properties7. The possibility that different interneuron cell types perform distinct circuit operations holds great promise for unraveling the logic of cortical microcircuits. Nevertheless, little is known about the functional roles of different interneuron subtypes, especially in awake and behaving animals. Multiple populations of interneurons differentially target distinct subregions of pyramidal cells leading to different modes of inhibitory control. Disinhibition of principal neurons mediated by inhibition targeted onto other inhibitory neurons can provide an additional layer of control, generating a powerful computational mechanism for increasing the gain of principal neurons. Recent work identified a population of layer 1 interneurons that mediate disinhibitory control over cortical processing13,18 and thereby enable associative learning18. Previous studies proposed that VIP expressing interneurons are a candidate cell type specializing in disinhibition because they appear to mainly target other interneurons10–12,15. Indeed, VIP expression demarcates a small population of all interneurons (~10%), distinct from the two major interneuron populations defined by parvalbumin (Pv) and somatostatin (Som) expression19,20. However, whether and how VIP interneurons mediate disinhibition in vivo and when they are recruited during behaviour has remained elusive.
We examined the function of VIP interneurons in two functionally different cortical regions, auditory cortex (ACx) and medial prefrontal cortex (mPFC). Channelrhodopsin-2 (ChR2)4,5, a light-activated cation channel, was targeted to VIP neurons using a VIP-ires-Cre21 knock-in mouse line by either breeding with Ai3222 (ChR2 reporter line) or using viral delivery (Fig. 1a and Extended Data Fig. 1a–d). To explore the function of VIP interneurons in circuit operations, we acquired extracellular recordings in awake mice using miniature microdrives that house an optical fiber and six tetrodes for simultaneous light stimulation and recording (Fig. 1b and Extended Data Fig. 1e, f).
Figure 1. VIP interneurons generate disinhibition in ACx and mPFC of awake mice.

a, Expression of ChR2-YFP in a VIP-Cre mouse. Scale bar, 50μm. b, (left) VIP neurons were identified by optical stimulation in vivo. (right) Light-evoked spike waveforms (blue) were similar to spontaneous ones (black) (see Methods). c, d, e, Raster plot (top) and peri-stimulus time histogram (PSTH) (bottom) of representative neurons for directly activated (VIP neurons), inhibited, and delayed activated groups in ACx. f, Relative light-induced firing rate change (log scale) vs. latency of the maximal effect (peak/trough of PSTH). Three clearly separated groups of significantly modulated neurons are apparent: short-latency activated (VIP, green), inhibited (purple) and delayed activated (light brown). Solid lines indicate probability density functions of peak times (normalized separately to improve visibility). g, h, Average PSTH of the VIP, inhibited, and delayed activated neuron groups in ACx (g) and mPFC (h). The temporal differences between ACx and mPFC were due to the different ChR2 expression systems (Ai32 vs. viral expression, see Extended Data Fig. 9).
Extended Data Figure 1. Specificity and efficiency of ChR2 expression, recording locations, and layer 1 VIP neurons.

a, VIP-Cre:Ai32 (ACx). b, VIP-Cre::AAV-DIO-ChR2 (mPFC). Note that some green puncta were not somata and only somata were used for quantification. c, Quantification of the overlap of ChR2-YFP (green) with anti-VIP (red) in ACx. Overlap=88±6.6% (49/54 neurons), 6 slices from 4 mice (see Methods for a note on caveats). d, Quantification of the overlap of ChR2-YFP (green) with anti-VIP (red) in mPFC. Overlap=97±3.7% (35/36 neurons), 5 slices from 4 mice. Scale bar, 50 μm. e, f, Recording location in mPFC and ACx. Microdrives accommodating 6 tetrodes and 1 optical fiber were implanted in the ACx (e) or the mPFC (f). Recording sites were confirmed by histology using DiI (red) that was applied to the optical fiber before implantation. Histology results showed that the electrode locations were biased towards the middle layers. Green, VIP neurons expressing ChR2-YFP; red, DiI. Scale bar, 200μm. g, h, Most VIP neurons were located in layer 2/3, with a smaller fraction in layer 1. VIP comprised about 10% of layer 1 neurons. g, VIP neuron in layer 1 of the ACx (arrow; 6 VIP/60 layer 1 ACx neurons, n=6 slices from 2 mice). h, VIP neuron in layer 1 of the mPFC (5 VIP/56 layer 1 mPFC neurons, n=6 slices from 2 mice). Green, VIP; red, NeuN (neuronal marker) staining. Scale bar, 100 μm.
We first characterized the impact of VIP neurons on the cortical network by synchronously activating them using 1ms light-pulses in ACx and mPFC. Brief light stimulation of this sparse population of VIP-expressing interneurons (1–2% of cortical neurons19,20) resulted in a disproportionately broad effect, generating significant firing rate changes in ~20% of cortical cells (ACx: 130/495, mPFC: 26/155) for tens to hundreds of milliseconds following the pulse. Examination of the light-triggered activity profiles of neurons revealed three distinct groups (Fig. 1c–h). The first group of neurons was strongly activated at a very low latency (ACx: 2.5±0.22ms, mPFC: 1.3±0.40ms), with low jitter (ACx: 1.4±0.21, mPFC: 1.1±0.10ms), and high reliability across trials (ACx: 0.62±0.10 at 0.5Hz, mPFC: 0.64±0.17 at 10–20Hz), indicative of direct light-activation (Fig. 1c, g, h and Extended Data Fig. 2a, d). Because ChR2 is expressed under the control of the VIP promoter (Fig. 1a and Extended Data Fig. 1), we concluded that the directly activated group consists of VIP interneurons. A second group of neurons was inhibited by the photostimulation at short, reliable delays (inhibition trough: ACx 10ms, mPFC 7ms), consistent with monosynaptic inhibition generated by inhibitory VIP neurons (Fig. 1d, g, h and Extended Data Fig. 2b). Many, but not all neurons in this inhibited group had narrow spike widths (ACx: 237±7μs, mPFC: 225±7μs) and high firing rates (ACx: 7.4±0.7Hz, mPFC: 17.5±4.2Hz; see Extended Data Fig. 2f, g), hallmarks of fast-spiking interneurons, usually expressing parvalbumin (Pv)23. The inhibited group also contained a subgroup of neurons that was first suppressed by photoactivation of VIP and later activated (Extended Data Fig. 3). A third group of neurons was activated by photostimulation at longer delays and with more temporal spread (Fig. 1e, g, h and Extended Data Fig. 2c). Neurons in this group had wider spikes (ACx: 316±7μs, mPFC: 339±12μs) and lower firing rates (ACx: 3.2±0.5Hz, mPFC: 9.2±2.7Hz) compared to the inhibited group (Extended Data Fig. 2f, g), suggesting that many of these were pyramidal neurons. An analysis of the timing and extent of light-induced firing rate change revealed that neural responses indeed clustered into three distinguishable groups: short-latency activated followed by inhibited and finally delayed activated neurons (Fig. 1f, g, h and Extended Data Fig. 2e). This excitation-inhibition-excitation sequence, observed in two functionally different cortical regions, is the signature of a disinhibition process: activated VIP interneurons inhibit other interneurons, releasing some pyramidal neurons from inhibitory control. These data represent the first in vivo demonstration of cell-type-specific disinhibition, confirming previous suggestions based on connectivity10–12 that VIP interneurons provide disinhibitory control.
Extended Data Figure 2. Three distinct populations responsive to photostimulation in mPFC and spike width vs. firing rate.

a, b, c Raster plots and PSTHs aligned to photostimulation for three distinct populations in mPFC. Examples of a directly activated (VIP, a), an inhibited (b), and a delayed activated neuron (c). Stimulation frequency, 10–20Hz. d, Photostimulation-evoked spike probability of a VIP interneuron. (left) Raster plot. (right) Firing probability as a function of photostimulation frequency. When all light pulses were considered, spike probability decreased with stimulation frequency (blue). However, the first 5 light pulses reliably evoke action potentials up to 100Hz (spike probability=0.78 at 100Hz). e, Relative light-induced firing rate change (log scale) vs. latency of the maximal effect (peak/trough of PSTH). Three separate groups are apparent in mPFC: short-latency activated (VIP, green), inhibited (purple) and delayed activated (light brown). f, g, (top left) Baseline firing rate vs. spike width in ACx (f) and mPFC (g). (top right) Cumulative fraction of firing rate. (bottom) Cumulative fraction of spike width. Green, directly activated (VIP); purple, inhibited; light brown, delayed activated group; dark grey, unidentified neurons. Light grey depicts neurons for which inhibition could not reliably be assessed because of very low baseline firing rates (see Methods).
Extended Data Figure 3. Inhibited and activated (Inh-act) population is a subgroup of the inhibited neurons.
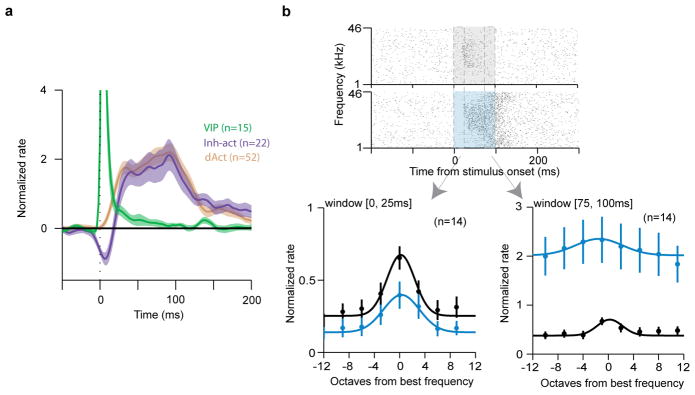
a, Average PSTH aligned to photostimulation (1ms pulses) for Inh-act cells (a subgroup of the inhibited neurons, Fig. 1 and 3). The color code of Fig. 1g, h applies. Inh-act neurons (purple) show initial inhibition followed by delayed activation after 1ms pulses. b, (top) Example raster plot aligned to auditory stimuli of a tone-responsive Inh-act neuron. Shading indicates the stimulation windows (grey, tone only; blue, tone- and photostimulation). Dashed boxes indicate time windows for frequency tuning analysis (early, 0–25ms; late, 75–100ms). (bottom) Frequency tuning curves of tone-responsive Inh-act neurons (population average, n=14). (bottom left) Tuning curve for the early time window (0–25ms). (bottom right) Tuning curve for the late time window (75–100ms). Simultaneous photostimulation (100ms) decreased the tone-evoked firing rates of Inh-act neurons in the early time window, whereas it increased the firing rates in the late time window. This pattern resembled the inhibition-activation sequence elicited by the 1ms light pulses (a).
To dissect the circuit mechanisms of disinhibition and identify the cell types that are monosynaptically inhibited by VIP neurons, we turned to the in vitro slice preparation. VIP interneurons likely target Som and/or Pv interneurons, the two largest non-overlapping populations (~65% of all interneurons)19,20. To examine which of these interneuron subtypes might mediate VIP-initiated disinhibition, we bred VIP-Cre mice with GIN-GFP mice, labeling a subpopulation of Som-expressing24 neurons, and separately with G42-GFP mice, labeling a subpopulation of Pv-expressing interneurons25. Viral delivery of ChR2 into the ACx or mPFC of these mice enabled us to selectivity photostimulate VIP interneurons and record the responses of either Som or Pv interneurons identified by epifluorescence in vitro (Fig. 2a, b).
Figure 2. VIP interneurons inhibit Som and Pv interneurons in ACx and mPFC in vitro.

a, b, c, (first column) Schematic of the in vitro experiments. A subpopulation of Som- (a) or Pv-expressing (b) neurons were identified under epifluorescence. Pyramidal (c) cells were identified by soma shape and were sampled from non-fluorescent neurons. (second column) Representative firing patterns of Som, Pv and pyramidal neurons during the injection of a depolarizing current (ACx). Scale bar, 40mV, 50pA, 200ms. (third and fourth columns) Photostimulation-induced (blue bars) IPSCs from Som neurons (a), Pv neurons (b) and pyramidal neurons (c) at 1Hz and 40Hz repetition rates. Scale bars, 1Hz stimulation: 50pA, 30ms (a), 40pA, 25ms (b), and 20pA, 25ms (c); 40Hz stimulation: 16pA, 125ms (a), 75pA, 50ms (b). d, Fraction of neurons responding to photostimulation in ACx and mPFC. e, Mean ± SEM of IPSCs for the significantly responsive neurons (paired t-test, p<0.01). Average IPSC amplitudes in ACx and mPFC were not significantly different (t-test, Som, p=0.125; Pv, p=0.83; Pyr, p=0.256; note the low sample sizes for pyramidal cells because of the low prevalence of evoked IPSCs. f, Short-term depression of IPSCs at 40Hz (ACx and mPFC combined).
Similar to the in vivo conditions, photostimulation in vitro reliably evoked action potentials in VIP neurons (Extended Data Fig. 4). Activation of VIP interneurons elicited IPSCs from a large fraction of Som interneurons (Fig 2a, d). Repeated stimulation of VIP neurons at 40Hz revealed that these inhibitory connections onto Som interneurons undergo short-term synaptic depression (Fig. 2a, f). VIP activation elicited IPSCs in a smaller fraction of Pv interneurons (Fig 2b, d). Inhibitory currents (IPSCs) recorded in Pv neurons decayed faster than those recorded from Som neurons (decay time constant; Som: 18±2ms, Pv: 6±1ms), and also displayed stronger short-term synaptic depression (Fig. 2b, f). In contrast to these inhibitory neurons only a small fraction of pyramidal neurons responded to VIP activation, suggesting that pyramidal neurons are a minor monosynaptic target of the VIP population (Fig. 2c, d). The amplitudes of IPSCs were not significantly different across groups (Fig. 2e). These in vitro results demonstrate that VIP interneurons specifically inhibit other interneurons, providing a circuit mechanism for a disinhibitory process that we observed in vivo.
Extended Data Figure 4. Light intensity-dependent changes in spike probability, delay and jitter in VIP interneuronsin vitro.

a, Example traces of action potentials evoked by different light intensities. Blue bar, light stimulation. Scale bar, 10ms, 10mV. b, c, d Quantification. Spike probability (b) increased while delay (c) and jitter (d) decreased with increasing light intensities. The highest two intensities were used in the in vitro experiments.
Since Som and Pv are known to inhibit pyramidal cells, which constitute the majority of cortical neurons, we suspected that the delayed activated neurons in vivo were mostly pyramids. To test this we used immunohistochemistry to map the neural activity marker c-Fos onto identified cell-types in vitro in mPFC (Extended Data Fig. 5). Photostimulation of VIP neurons increased c-Fos expression 5-fold compared to control animals (Extended Data Fig. 5b–h). Eight percent of c-Fos-immunopositive neurons expressed VIP, while the others expressed the pyramidal marker CaMKIIα (Extended Data Fig. 5f, g), revealing that the delayed activated population consists of pyramidal neurons.
Extended Data Figure 5. Photostimulation of VIP increases c-Fos in pyramidal neurons in mPFC.

a, Schematic of c-Fos experiment. Animals were anesthetized for 2 hours to reduce the background c-Fos levels and photostimulation was applied. The expression level of c-Fos was captured 1 hour after photostimulation. b, Representative images of different experimental conditions. CTRL1, no ChR2 expression with photostimulation; CTRL2, ChR2 expression without photostimulation; EXP, ChR2 expression with photostimulation. (left column) Green, expression of ChR2.YFP; (middle) white, c-Fos staining; (right) merged images. Scale bar, 200 μm. c. Quantification of c-Fos levels. CTRL1: n=64 c-Fos immunopositive neurons, n=4 mice, CTRL2: n=58 neurons, n=4 mice, EXP: n=252 neurons, n=4 mice. d, e, f Representative images from different experimental conditions. White, c-Fos staining; green, ChR2-expression; red, CaMKIIα-staining. The arrow indicates a c-Fos-immunopositive VIP neuron. Scale bar, 50 μm. Note that some overlapping signals (c-Fos and CaMKIIα) are hard to appreciate in this image due to low resolution and uneven immunostaining. Additionally, due to the different signal strength, CaMKIIα immunopositivity is hard to appreciate for neurons that are slightly above or below the focal plane, while the strong c-Fos immunoreactivity is still detectable. For this reason, additional high power images were presented in (i). g, Colocalization of markers with c-Fos. h, Fraction of c-Fos positive cells. Among CaMKIIα positive neurons, the proportion of c-Fos-immunopositive cells was significantly higher in the experimental group as compared with the controls. CTRL1: fraction=11/208 (c-Fos/CaMKIIα), 4 mice; CTRL2: fraction=3/107, 3 mice; EXP: fraction=66/257, 4 mice. Approximately 64% (7/11) of the ChR2-expressing neurons were c-Fos-immunopositive. i, High resolution images of the co-localization between c-Fos and CaMKIIα in (f). Due to low resolution and uneven staining of CaMKIIα, some c-Fos signals seemingly do not co-localized with CaMKIIα+ neurons. However, in high resolution images, the co-localization is clearer. (top) Example of a weakly stained CaMKIIα+ neuron (arrow). In the high resolution image, CaMKIIα-staining is apparent. (bottom) Attributed to differences in immunofluorescence strength between c-Fos and CaMKIIα, neurons slightly out of focus may appear c-Fos-positive and CaMKIIα-negative. However, when the focal plane was adjusted, the co-localization became apparent. Blue, c-Fos; green, ChR2-YFP; red, CaMKIIα.
To probe the function of this disinhibitory circuit during sensory processing, we investigated how auditory receptive fields are shaped by VIP activation. About a quarter of the single units recorded in head-restrained awake mice (VIP-Cre::Ai32) (98/343) could be classified as directly activated (n=4, VIP, Extended Data Fig. 6), inhibited (n=48), or delayed activated (n=46, Fig. 3a). Delayed activated neurons tended to be more tone-responsive (28/46, 61%, compared to 98/343, 29% in the entire population) and had stronger auditory responses (Fig. 3b, Extended Data Fig. 7a–f). Also, a large fraction of tone-responsive neurons was delayed activated (28/98, 29%, compared to 18/245, 7% in the tone-unresponsive population), and these showed stronger light effects (Fig. 3b, Extended Data Fig. 7a–f, and Extended Data Table. 1). These results reveal that in auditory cortex, the VIP circuit disinhibits a functionally specific subset of neurons that tend to be tone-responsive and frequency-tuned.
Extended Data Figure 6. Responses of VIP neurons in ACx during auditory stimulation, alone or combined with photostimulation.
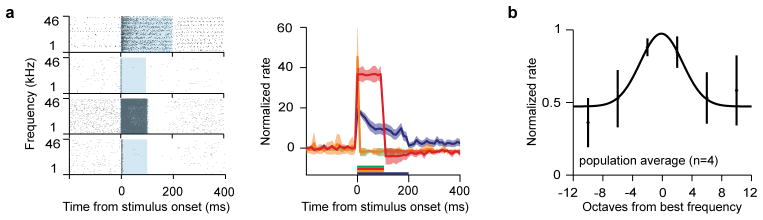
a, Raster plot (left) and PSTH (right) aligned to the onset of combined tone and photostimulation. Although all VIP neurons were responsive to photostimulation, individual VIP neurons showed heterogeneous response profiles. One VIP neuron (top) showed accommodation during the 200ms stimulation; two neurons (second and fourth) showed transient response; one neuron (third) fired persistently throughout the stimulation. Shaded boxes (left) or colored lines (right) indicate the stimulation duration. b, Average frequency tuning curve of VIP neurons (n=4). All 4 VIP neurons in the ACx for which tuning curves were recorded were responsive to pure tones; however, their tuning properties showed considerable heterogeneity.
Figure 3. Auditory responses of a functional subpopulation of principal neurons are modulated by disinhibition.

a, Venn diagram showing the number of single neurons in ACx classified based on tone and light-responsiveness. b, (left) PSTHs aligned to stimulus onset show that tone-response of delayed activated cells is stronger than that of those unaffected by light (only cells firing >1Hz included in the unaffected population). (middle, right) Light-response is stronger in tone-responsive than -unresponsive neurons. c, d, e, f Auditory tuning of tone-responsive inhibited (c, d) and delayed activated (e, f) neurons in awake mice. c, e (top) Raster plots of representative neurons sorted by the frequency of the auditory stimulus. Gray shade, tone delivery; blue shade, tone+light stimulation. (bottom) Frequency tuning curves of the same cells. d, f Average tuning curves. Mustard solid/dashed lines are predictions from additive/multiplicative models, respectively.
Extended Data Figure 7. Auditory response profiles of different neuronal groups.

a, b Single cell examples (top, raster plot; middle, PSTH) and population average (bottom, PSTH) of responses evoked by a brief 1ms light pulse. a, Delayed activated and tone-responsive neurons. b, Delayed activated and tone-unresponsive neurons. c, d Single cell examples (top, raster plot; middle, PSTH) and population average (bottom, PSTH) of responses evoked by combined auditory and light stimulation (100ms). c, Delayed activated and tone-responsive neurons. d, Delayed activated and tone-unresponsive neurons. Gray shaded box, tone stimulation; blue shaded box, tone+light stimulation. e, PSTH of tone-responsive (red) and tone-unresponsive (brown) delayed activated neurons for 100ms light pulses (without auditory stimulation). This experiment was performed in a subset of the frequency tuning experiments. f, Frequency tuning curve of tone-responsive neurons not modulated by 1ms light pulses. g, Fitting of one-parameter gain control models on tuning curve modulation of inhibited and delayed activated neurons. Tuning curves recorded during photostimulation were fitted with one-parameter models representing the scaled (multiplicative model) or shifted (additive model) versions of the baseline tuning curves (i.e., without photostimulation). The ratio of the least squared errors of the two model fits are plotted as a function of relative firing rate change after 1 ms light pulses on a logarithmic scale, for inhibited (purple) and delayed activated (brown) neurons (minus infinity corresponds to complete abolishment of firing). An error ratio >1 corresponds to a better fit of the additive model, whereas <1 means better fit of the multiplicative gain model. See also Methods.
Extended Data Table 1.
Contingency table.
Delayed light-activation and tone-responsiveness are not independent.
| a. all neurons | ||
|---|---|---|
| tone-responsive | tone-unresponsive | |
| delayed activated | 28 | 18 |
| not delayed activated | 69 | 227 |
| b. putative pyramidal neurons | ||
|---|---|---|
| tone-responsive | tone-unresponsive | |
| delayed activated | 28 | 18 |
| not delayed activated (spike width > 275μs) | 39 | 174 |
Fisher’s exact test: P = 0.000001
Fisher’s exact test: P = 0.00000002
Next, we examined how VIP-mediated disinhibition modulates auditory frequency tuning. The inhibited population (n=25 of 97 tone-responsive neurons) decreased while delayed activated neurons (n=28 of 97) increased their tone-evoked firing when VIP interneurons were also activated, consistent with the modulation expected from the disinhibitory circuit (Fig. 3c–f). We found that one-parameter gain modulation models (additive or multiplicative) fitted the light-induced changes in average tuning curves: the inhibited population showed divisive gain modulation9,26, whereas the change in delayed activated neurons was consistent with an additive shift of the baseline firing rate (Fig 3c–f and Extended Data Fig. 7g). These observations reveal that VIP stimulation modulates the gain of auditory cortical responses.
Having established how VIP activation modulates local circuit activity next we investigated under what behavioural conditions are VIP neurons recruited. We recorded the activity of VIP neurons during an auditory go/no-go discrimination task (Fig. 4a). VIP neurons were recorded early in training as these sessions had a large number of false alarm (FA) responses to the ‘no-go’ cue (Fig. 4b). We found that VIP neurons showed surprisingly homogeneous responses to reinforcement feedback signals (Fig. 4c–f and Extended Data Fig. 8). In all VIP neurons punishment (air puff, n=6 or foot shock, n=4) generated strong phasic activation at short latencies (peak at 50±12ms, p<0.01). The similar activation in response to two different types of punishment suggests that VIP neurons signal the aversive quality of the negative feedback. Water reward tended to generate somewhat weaker and more sustained firing rate increases (9/10 VIP neurons, half maximum duration 1.2s; Extended Data Fig. 8). In contrast, unidentified neurons showed heterogeneous responses around the time of reinforcement (Fig. 4e; FA activation: 23/130, Hit activation: 34/130, FA suppression: 25/130, Hit suppression: 30/130 or no change). A small subpopulation of unidentified neurons responded to both reward and punishment (17/130). However, these responses tended to precede the feedback, suggesting sustained auditory responses to the cue, unlike the abrupt firing rate increase of VIP interneurons after punishment delivery (Fig 4f and Extended Data Fig. 8c). These results reveal that VIP interneurons respond in unison to reinforcement feedback, distinct from the more diverse responses observed in the rest of the cortical population.
Figure 4. VIP neurons are recruited by reinforcement signals.

a, Schematic of behavioral setup and auditory discrimination task. b, Average performance and reaction time (mean ± SEM across sessions) c. Raster plots and peri-event time histograms (PETH) of example VIP neuron. Neural activity was aligned to reinforcement (reward/punishment; red). Blue, tone onset. d, Raster plots and average PETHs of VIP neurons (n=10). All VIP neurons showed strong increase of firing rate after punishment (VIP #1–4: foot shock; asterisk, #5–10: air puff). e, Cumulative fraction of tone-selectivity (left; Kolmogorov-Smirnov test, p=0.43) and firing rate change (right; Hit, p<0.01; False alarm, p<0.01; ΔResponse, see Methods). Response to reinforcement signals distinguishes VIP neurons from unidentified population. f, Normalized average PETH aligned to reinforcement of VIP and concurrently recorded unidentified neurons responsive to both positive and negative feedback (17/130; grey). (left) VIP neurons showed sustained activation after reward delivery. (right) VIP neurons increased firing rate abruptly after punishment, in contrast with unidentified cells. g, Schematic model of disinhibitory circuit. Feedback information (e.g. reinforcement signals) to VIP neurons disinhibits a functional subpopulation of pyramidal neurons.
Extended Data Figure 8. VIP neurons strongly respond to punishment in ACx.

a, Raster plots (top) and PETHs (bottom) aligned to reinforcement (reward, green or punishment, red) for all VIP neurons recorded in the auditory go-nogo task. All VIP neurons were strongly recruited by punishment (foot shock: 1–4, marked by asterisks; air puff: 5–10), whereas water reward induced somewhat weaker and more sustained activation (9/10 cells showed significant firing rate increase for reward, see Results and Methods). b, Raster plots and PETHs of example unidentified neurons. Type 1 neurons (left) tended to be activated by tone onset. Type 2 neurons (right) tended to be inhibited by tone onset. c, (top) Normalized average PETH of VIP (green) and concurrently recorded non-VIP neurons aligned to feedback (left) and tone onset (right) for hit (top) and false alarm trials (bottom). VIP neurons showed an abrupt increase of firing rate after punishment (bottom left). The oscillatory pattern of VIP activation around reward delivery is a consequence of rhythmic firing rate modulations following the highly stereotypic pattern of licking in 4/10 VIP neurons (1/130 in non-VIP neurons). Gray, feedback-activated unidentified neurons (type 1). Pink, feedback-inhibited unidentified neurons (type 2). Insets, zoomed-in plots of PETHs. Arrows indicate the difference in activation pattern between VIP and unidentified type 1 neurons.
Genetic targeting and optical activation enabled us to map a particular circuit function, disinhibitory control, onto a molecularly defined cell-type. Based on the strong disinhibitory impact and target selectivity observed in two cytoarchitectonically and functionally different cortical areas, we propose that the disinhibitory microcircuit mediated by VIP expressing interneurons represents a conserved motif in neocortex.
VIP interneurons function within a highly interconnected network, therefore their role can be understood as pre-synaptic drivers of (‘impact’) and post-synaptic responders to (‘recruitment’) other neurons. In terms of impact, we found that VIP neurons mediate disinhibitory control. In terms of recruitment, we identified a behaviourally relevant condition, reinforcement feedback, that uniformly activates VIP neurons. The homogeneous behavioural recruitment of VIPs suggests that the synchronous ChR2-mediated activation to probe their circuit function was physiologically plausible. VIP interneurons are ideally positioned to serve as a substrate for long-range inputs to increase the gain of local cortical processing (Fig. 4g). Elegant studies have recently demonstrated a similar disinhibitory process13,18, whereby foot-shock-induced cholinergic activation of layer 1 cortical neurons in ACx enabled auditory fear learning18. Interestingly, most VIP interneurons are located in superficial layers, including layer 119,20 (Extended Data Fig. 1g, h). However, the extent to which these two disinhibitory circuits overlap remains to be determined, as only a fraction of layer 1 interneurons express VIP. VIP interneurons express ionotropic receptors for cholinergic (nAChR) and serotonergic (5HT3a) modulation27–29, suggesting that they are also subject to rapid neuromodulation30. These neuromodulatory systems or other long-range pathways likely convey information about reinforcement events to VIP neurons. By rapidly relaying this signal primarily to tone-selective neurons locally, VIP interneurons might contribute to cortical learning mechanisms. Based on these observations we propose that disinhibitory control by VIP interneurons provides a powerful circuit mechanism that enables long-range cortical signals or subcortical neuromodulation to efficiently modulate specific pyramidal neuron ensembles.
METHODS
Animals
Adult (over 2 month old) male and female mice of VIP-Cre21 (C57BL/6 background) or VIP-Cre crossed with Ai3222 (ChR2 reporter line), GIN-GFP (Som), and G42-GFP (Pv) were used under the protocol approved by Cold Spring Harbor Laboratory Institutional Animal Care and Use Committee in accordance with National Institutes of Health regulations.
Virus injection
Animals were anesthetized with ketamine (100mg/kg) and xylazine (10mg/kg). AAV2/9.EF1α.DIO.ChETA.EYFP31 (UNC vector core) was injected in mPFC (1.75 mm anterior to bregma and 0.5 mm lateral to midline) or ACx (2.50 mm posterior to bregma and 4.00 mm lateral to midline) of VIP-Cre mice, VIP-Cre::GIN-GFP, and VIP-Cre::G42-GFP at the age of 4 weeks old. Approximately 1μl of AAV (8×10¹² virus particles per ml) was injected with a glass pipette using Picospritzer (Parker Hannifin Co.). Because VIP cells constitute only a small fraction (1–2%) of cortical neurons, the expression of ChR2 was maintained at least 4 weeks to increase the efficacy. The longer expression time (even after 6 month) did not affect animals’ health and behavior.
Neural data collection
After 4–6 weeks of ChR2 expression, a custom-built drive housing 6–8 tetrodes and 1–2 optical fibers (50 μm core diameter, numerical aperture 0.2, Polymicro Technologies) were implanted in the left mPFC (1.75 mm anterior to bregma and 0.5 mm lateral to midline) or the left ACx (2.50 mm posterior to bregma and 4.00 mm lateral to midline) using stereotaxis32. For frequency tuning and auditory go/no-go experiments, a titanium headbar was also attached to the skull. After 7–10 days of recovery after surgery, action potentials were recorded extracellularly (sampled at 32 kHz) with either a Cheetah32 or a DigiLynx system (Neuralynx, Inc.) from the ACx (n = 12 mice) or the mPFC (n = 4 mice). Brief laser pulses (473nm, 1ms duration, 1.5–3 mW of total output at the tip of optical fibers) were delivered through an optical fiber (50 μm core diameter, numerical aperture 0.2, CrystaLaser, UltraLasers or Lasermate Group Inc.). Electrodes were advanced 60–80 μm each recording day. Electrode locations were estimated based on the entry coordinates and the extent of cumulative descent and later confirmed by histology (Extended Data Fig. 1e, f). In most of the ACx experiments (50/53 sessions, n = 12 mice), frequency tuning experiments were performed after optogenetic tagging while neural signals were continuously recorded. Therefore, the number of neurons in Fig. 3 and 4 are a subset of Fig. 1. Conducting the experiments required monitoring the effect of VIP-photostimulation on multiunit activity; therefore, it was not possible to fully blind the experimenter. However, this information was only used to guide decisions about whether to move the electrodes or not. Once light effects were detected, all well-separated single units from the session were analyzed by automated software algorithms treating every neuron equally.
The difference in the relative proportion of recorded VIP neurons in ACx and mPFC is likely due to technical reasons. First, ChR2 was delivered virally into mPFC, whereas we used a reporter line (Ai32) for ACx. Therefore, ChR2 expression in mPFC was spatially limited and the level of expression could vary. Second, superficial layers in mPFC were more difficult to target because they are located underneath midline blood vessels. There was no significant difference in VIP cell density in ACx and mPFC. Cell densities; ACx: 2.1±0.17 (115 cells, 4 slices from 2 mice), mPFC: 2.1±0.09 cells/104 μm2 (124 cells, 4 slices 2 mice); p=0.78, t-test. Cell density was estimated from VIP.Ai32 mice.
Data analysis
All data analysis was carried out using built-in and custom-built software in Matlab (Mathworks). All recording sessions with light effects were included. Spikes were manually sorted into clusters (presumptive neurons) off-line based on peak amplitude and waveform energy using the MClust software (A.D. Redish). Cluster quality was quantified using isolation distance and L-ratio33. Putative cells with isolation distance < 20 or L-ratio > 0.1 were excluded. Autocorrelation functions were inspected for all putative cells and in cases with absolute refractory period violations, an additional effort was made to improve cluster separation. If refractory violations persisted, the cluster was excluded. Some of the VIP neurons did not reach the threshold of isolation distance and L-ratio. For these neurons, we exploited the waveform information carried by light-evoked action potentials, which aided the isolation of these units. We calculated waveform correlation between spontaneous action potentials of VIP neurons and average light-evoked waveform. We restricted the clusters to the upper 5 percentile of the bootstrapped distribution of correlation coefficients.
Next, we estimated peri-stimulus (stimulus-aligned) firing rates by using an adaptive spike density function (SDF) approach (termed peri-stimulus time histogram and abbreviated PSTH hereinafter). Briefly, spike rasters were convolved with a variable kernel Gaussian window to provide a SDF estimate. The kernel width of the Gaussian was adapted to the local estimate of spiking probability to implement stronger smoothing when information was sparse. Variance was mapped onto spiking probability between 0 (moving average, corresponding to probability of 0) and infinity (Dirac-delta, corresponding to probability of 1). To detect light-induced changes of firing rate we first determined the putative activation/suppression period and then evaluated the statistical significance of the firing rate change compared to a stimulus-free baseline, as follows. Adaptive SDF was calculated aligned to light stimulus onset. For the mPFC, minimal and maximal firing was determined as the minimum and maximum of the SDF within 100 ms from the light pulses. The baseline firing rate was calculated from mean firing probability within a 100 ms window before the start of a pulse train. For ACx longer windows were used according to the observed differences in response latencies (200 ms after light flashes for response and 400 ms before light pulses for baseline). We determined the putative activation period as the epoch between the half-peak crossings (relative to baseline) before and after the positive peak. Putative suppression period was defined in a similar way based on the negative peak. The statistical significance of the activation and suppression was determined by comparing the spike count distribution within these periods with an equivalent baseline epoch using two-tailed Mann-Whitney U-test. A P value cutoff of 0.05 was used for significance testing. In the mPFC experiments, light pulse trains of different frequencies were used as stimuli. To allow a long enough window for testing possible firing rate changes, single pulses of the slowest stimulus bursts (5 Hz) were chosen as reference events for this analysis. Since slow light-induced firing rate changes could potentially mask fast light-evoked activation or suppression, the analysis was restricted to first stimuli of light pulse trains; a neuron was considered activated or inhibited if either of the two tests showed a significant effect. In ACx experiments, single pulses of 0.5 Hz frequency were applied; this slow stimulation protocol allowed us to include all pulses as reference events, enhancing statistical power. To reduce the probability of misclassification of ACx neurons based on light-induced firing rate changes to a minimum, we exploited tone+light stimulation trials for those cells showing any effects for 1 ms laser light stimulation. If any of these cells showed additional effects when including the tone+light stimuli without confounding effects of tone only stimulation, then these effects were also taken into account. Significance of suppression could not reliably be determined for cells with a baseline firing rate < 2 Hz (<1 Hz in ACx; relaxing the spike rate threshold was enabled by the improved statistical power, see above). In a few cases we detected late secondary effects after a significant short latency inhibition or activation. These cells were classified based on the primary effects. In the ACx experiments, a significant portion of the neurons that were inhibited also showed a later activation. These cells were also included in the inhibited group in the main figures based on their significant short-latency inhibition after light stimulation. In addition, they are also displayed separately in Extended Data Figure 3.
The timing of firing rate suppression in neurons significantly inhibited after photostimulation was compared for narrow spiking (<275 μs, NS, n = 17) and wide spiking (>275 μs, WS, n = 46) neurons. WS neurons showed significantly later offset (mean±SEM, NS, 39.0±10.0 ms; WS, 86.5±7.6 ms; P = 0.0007, Mann-Whitney U-test for all comparisons in this paragraph) and correspondingly longer duration (NS, 27.3±5.8 ms; WS, 54.3±5.8 ms, P = 0.0019) of suppression. Similar results were obtained when comparing slow firing (<5 Hz, SF, n = 32) and fast spiking (>5 Hz, FS, n = 31) neurons: slow firing neurons showed significantly later inhibition offset (FS, 58.6±9.2 ms; SF, 88.4±9.1 ms; P = 0.016) and longer durations (FS, 34.6±4.8 ms; SF, 59.0±7.6 ms; P = 0.0051).
In vitro electrophysiology
For in vitro electrophysiology experiments, ChR2 expression time was kept constant and comparable (4 – 6 weeks) between VIP-Cre::GIN-GFP and VIP-Cre::G42-GFP. Mice were anesthetized and decapitated. The brain was transferred to an ice-cold cutting solution containing (in mM) 110 choline chloride, 25 NaHCO3, 25 D-glucose, 11.6 sodium ascorbate, 3.1 sodium pyruvate, 2.5 KCl, 1.25 NaH2PO4, 7 MgCl2 and 0.5 CaCl2. Coronal sections (300 μm) of mPFC or ACx were prepared using vibratome (MICROM) and all slices were transferred to artificial cerebrospinal fluid (ACSF) containing (in mM) 127 NaCl, 25 NaHCO3, 25 D-glucose, 2.5 KCl, 1.25 NaH2PO4, 2CaCl2 and 1MgCl2, balanced with 95% O2 and 5% CO2. Slices were incubated at 34 °C for 30–60 min and kept at room temperature (22–24 °C) during the experiments. Target neurons were identified by fluorescence and patched with glass electrodes (pulled from borosilicate glass capillaries, Warner Instruments, resistance, 5–7 MΩ). To augment IPSCs in inward direction, a high Cl− intracellular solution containing (in mM) 30 potassium-methlysulfate, 118 KCl, 4 MgCl2, 10 HEPES, 1 EGTA, 4 Na2-ATP, 0.4 Na2-GTP, 10 sodium phosphocreatine, pH 7.25; 290–300 mOsm was used. To block excitatory postsynaptic currents 20μM CNQX (Tocris) and 50μM APV (Tocris) were added to the ACSF. Whole-cell recordings were conducted and signals were amplified using Multiclamp 700A amplifier (Axon Instruments, Molecular Devices). IPSCs were measured in voltage clamp mode at a holding potential of −70 mV, and action potentials were recorded in current clamp mode. All recording sessions with light effects were included and analyzed using a custom-built Matlab program (Mathworks). Neurons that were significantly responsive to photostimulation (peak amplitude vs. baseline, paired t-test, P < 0.01) were further analyzed to calculate the IPSC amplitude. The normality of amplitude distribution was tested on a subset of data with Lilliefors-test. Decay time constants were calculated by fitting the decaying phase of the IPSCs (10%–90% of the peak amplitude) with a single exponential function. There was no significant differences in IPSC amplitude and fraction of responded neurons in different cortical layers and the results were combined. Som and Pv showed similar short-term plasticity in ACx and mPFC. Hence, the two data sets were combined. All central tendencies were reported as mean ± SEM.
Frequency tuning experiment and data analysis
Experiments were performed in a sound attenuated chamber (Industrial Acoustics Co.). Animals were head-restrained using headbars and monitored during recording sessions using a USB camera. Before starting recording, the mice were accommodated to the head-fixing setup. Untrained awake mice sometimes moved in bouts in head-restrained condition. To examine whether these movement bouts modulate neural activity in ACx, a 3.8×3.8cm force sensitive resistor (Interlink electronics) placed under the paws was used to monitor movement while neural activity was recorded simultaneously. Neural activity was sorted according to epochs of movement and quiescence and the average firing rates between the two conditions were compared statistically (unpaired t-test; P < 0.01). The analysis revealed that the majority of neurons (40/43) did not show a statistically significant difference, suggesting that the movement in head-restrained condition was not reflected in substantial changes of neural activity in the ACx. Pure tones (1–46 kHz, 100 ms, 50–70 dB) were delivered in a pseudo-random sequence to the right ear by a calibrated speaker (TDT) with or without concurrent photostimulation (100ms duration (except one session with 200 ms), 473 nm, 1.5–3 mW of total output at the tip of the optical fibers; 50 μm core diameter, numerical aperture 0.2, Polymicro Technologies, Ultralasers) in awake state. Single neuron activity was recorded with Cheetah system (Neuralynx). Sound presentation and neural data were synchronized by acquiring timestamps from the sound-delivery system along with the electrophysiological signals.
Data were analyzed using Matlab (Mathworks). All central tendencies were reported as mean ± SEM. To classify tone-responsive neurons, adaptive spike density function (SDF) was calculated by convolving the raster plots of tone responses with a variable Gaussian window (see above). Minimal/maximal firing was assessed as minimum/maximum SDF within 200 ms from tone onset. Baseline firing was determined by mean pre-event firing probability. The increase/decrease in time course was assessed by crossings of the half-distance between the extreme and the baseline before and after the minimum/maximum. This temporal window of increase/decrease was then used to bin the baseline raster. Spike counts for baseline and spike counts in the previously determined temporal window were evaluated using Mann-Whitney U-test and the cells with P value <0.01 were classified as tone-responsive neurons. Firing rates during pure tone or tone+light stimuli (100 ms) were calculated to obtain auditory tuning curves. A subgroup of inhibited cells showed secondary, delayed activation by VIP photostimulation after the inhibition ceased (Extended Data Fig. 3). For these cells, only the first 25 ms of the stimuli were used for the tuning curves to avoid any confounding effects resulting from the delayed activation. These cells were also analyzed separately in more detail using two different stimulus-induced firing rate windows (0–25 ms for inhibition and 75–100 ms for delayed activation; see Extended Data Fig. 3). For the tone-responsive neurons not modulated by 1ms light pulses, only those cells with a baseline firing rate >1 Hz (15/40) were analyzed to ensure reliable exclusion of potential inhibition after photostimulation (see above). Tuning curves of tone-responsive neurons were fit by Gaussian curves (robust fit with non-linear least squares method) and aligned for averaging based on the mean of the Gaussians. The underlying raw firing rates for both tone only and tone+light stimulation protocols were normalized to the maximum firing rate in the tone only stimulation condition and averaged over cells for different groups. The averages were also fit by Gaussian curves.
We quantified the effects of VIP stimulation on auditory tuning curves by fitting simple models. First, we considered two one-parameter models: pure divisive gain (activity gain)26 and a mere shift in baseline firing rate. Although the individual data showed considerable heterogeneity, on average the decrease in firing rate in the inhibited neurons was consistent with an activity gain model, whereas the increased rates in the delayed activated cells were best fit with a baseline shift (Fig. 3, Extended Data Fig 7g). However, non-linear transformations such as a threshold operation in combination with a baseline shift can in theory yield similar or better results compared to the activity gain model26. We tested this combined model for inhibited cells and compared it with the results of the activity gain model. The activity gain model resulted in better fits (smaller least square errors) than the baseline shift combined with a threshold operation at 0 Hz in the case of 22 out of 25 neurons; the combined model resulted in smaller errors in 2 neurons and the fits were indistinguishable for 1 cell. This suggests that the activity gain model is superior to the additive model for inhibited cells even when allowing an additional non-linear modulation (p = 2.7×10⁻⁵, Wilcoxon signed rank test, two-tailed).
Next, we turned to two-parameter models. Since the best frequency and the tuning width did not show substantial changes (inhibited group, change in best frequency, 0.86 kHz; tuning width quantified by the s.d. of the Gaussian fit, 3.12 (95% confidence intervals, 2.68, 3.56) without and 3.51 (95% confidence intervals, 2.62, 4.41) with VIP stimulation; activated group, change in best frequency, 2.64 kHz; tuning width quantified by the s.d. of the Gaussian fit, 6.95 (95% confidence intervals, 6.25, 7.65) without and 5.37 (95% confidence intervals, 4.31, 6.42) with VIP stimulation), we tested two-parameter models combining the baseline shift and the activity gain model. This model resulted in only marginal improvement relative to the divisive model for the inhibited group (Bayesian information criterion34 for the combined, divisive gain and baseline shift models: −399.6, −398.3 and −354.7) and the baseline shift model for the delayed activated group (Bayesian information criterion for the combined, multiplicative gain and baseline shift models: −274.7, −146.7 and −270.2). Thus, the effect of VIP stimulation on auditory tuning curves is explained by the divisive gain modulation of inhibited cells and the additive firing rate change of the delayed activated neurons.
Auditory go/no-go task
Mice were trained on a head restrained auditory discrimination task. The animals were placed in a head restrained setup inside a sound-attenuated chamber (Industrial Acoustics Co.) monitored by a USB video camera (LE). Mice were trained to lick for water reward (3–5 μl per trial) after hearing a go tone (5 or 20 kHz frequency, 0.5s duration) while withholding response to a no-go tone (10 or 4 kHz frequency, 0.5s duration) associated with punishment (gentle air puff, 100 ms duration, n = 5 mice or mild foot shock, 100ms duration, 0.6 mA, n = 1 mouse). Licks were detected by an infrared lickometer (Island Motion Co.). Laser pulse sequences and tones were generated using Pulse Pal, a custom 4-channel stimulator we developed based on an open source ARM microcontroller platform (Maple, LeafLabs). All behavioral events were acquired using Bpod, a custom-designed behavioural system that provides a real-time virtual state machine framework for precise control of stimulus delivery and environmental measurements. Events were synchronized with neural signals by digital inputs from Bpod to the recording system (Neuralynx). Each trial was concluded with one of the four following possible outcomes: two types of correct trials, hit (response to go tone) or correct rejection (no response to no-go tone) and two types of incorrect trials, miss (no response to go tone) or false alarm (response to no-go tone) (Fig. 4a). Tones were delivered in a pseudo random sequence. Once mice stopped licking, the next trial started with a pseudo-random delay (average 5 s or 1.75 s). The animals were trained to perform 200–300 trials to allow firing rate comparisons in >100 ms windows. However, individual sessions varied between 96–600 trials.
Peri-event time histograms (PETH) aligned to task events (cue tone onset, reinforcement signals) were calculated using the adaptive SDF algorithm described above. Assessment of significant firing rate changes after task events was performed similarly to the analysis of photostimulation- or tone-evoked enhancement or suppression of activity (see above). Neurons were grouped according to their firing rate responses around reinforcement signals (baseline window, −1 to −0.6 s before cue tone onset; test window, 0 to 0.4 s after cue tone onset). PETHs were z-scored, averaged and baseline-subtracted within groups. Tone-selectivity and ΔResponses of hit and false alarm were calculated from maximum/minimun values of normalized PETHs during go/no-go tone periods. Tone-selectivity was defined as |go tone response – no-go tone response|/go tone response + no-go tone response|. ΔResponse was defined as maximum/minimum rate – baseline rate.
c-Fos experiments and quantification
A single optical fiber (50 μm core diameter, numerical aperture 0.2, Polymicro Technologies) was implanted in the left mPFC of VIP-Cre mice with or without ChR2 expression (4–6 weeks). After 7–10 days of recovery post surgery, animals were anesthetized with ketamine (100 mg/kg) and xylazine (10 mg/kg) and left in their home cages in a dark, sound attenuated chamber for 2–3 hours to reduce background c-Fos levels. The photostimulation protocol was as follows: stimulation was composed of a train of 20 brief (1 ms) laser pulses for 1s followed by no stimulation for 3s. This was repeated 25 times (total stimulation time = 100 s). Animals were put back to their home cages in the sound attenuated chamber for 1 hour. Animals were then perfused transcardially with a fixative containing 4% paraformaldehyde in 0.1 M phosphate buffer and the brains were postfixed overnight in the same solution at 4°C. After sectioning and confocal imaging (see below), the z-stacked images were analyzed for quantification of c-Fos and overlap with other markers (CaMKIIα, ChR2-YFP). The quantification was performed by manual counting of nuclear staining.
Immunofluorescence and imaging
Animals were perfused according to the same protocol used for c-Fos experiments (see above). Brain sections (80–120 μm thickness) were prepared using vibratome (Leika), and permeabilized and blocked with 1% Triton-X and 5% normal goat serum for 2 hours. Immunostaining was performed with primary antibodies of rabbit anti-VIP (ImmunoStar, 1:400 dilution); rabbit anti-c-Fos (Santa Cruz Biotechnology, 1:1000); mouse anti-CaMKIIα (Thermo Scientific, 1:200); mouse anti-NeuN (Chemicon International Inc, 1:500) in 0.1% Triton-X and 5% normal goat serum in PBS overnight at 4°C. After three washes of 5 minutes in PBS, sections were incubated with secondary antibodies (Alexa-596/Alexa-405 conjugated goat anti-rabbit/anti-mouse, Invitrogen/Molecular Probes) diluted 1:500 in 0.1% Triton-X and 5% normal goat serum in PBS. Z-stack images were taken using confocal microscope (Zeiss 710 LSM).
Immunostaining was used to estimate specificity and efficiency of VIP expression in the VIP-Cre:Ai32 line. However, we would like to note that this approach has some limitations, as immunohistochemistry is not considered a gold standard method for assessing gene expression, since both its specificity and sensitivity depends on external factors21,35. These factors include but are not restricted to (i) celltype-specific availability of the epitope36, (ii) varying expression levels and subcellular patterns of the antigens35,37, (iii) details of the experimental procedure35.
Extended Data Figure 9. Accounting for the temporal difference between VIP-Cre::Ai32 (ACx) and VIP-Cre::AAV.ChR2 (mPFC).
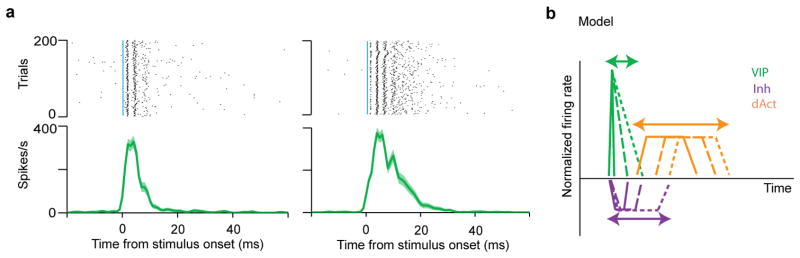
We observed a temporal difference in the firing pattern of VIP neurons between the ChR2 reporter line (Ai32) and the virus injected (AAV.ChR2) mice. We speculated that this difference could stem from the mutation in ChR2. The mutation in ChR2(H134R) of Ai32 mice produces larger currents and slower kinetics than ChR2(ChETA; AAV.ChR2). As a consequence, VIP neurons in VIP-Cre::Ai32 can fire bursts in response to single 1ms pulses and the activation can last more than 20ms (a). This sustained activity of VIP neurons prolonged the temporal dynamics of downstream neurons. a, Examples of VIP neurons that burst to 1ms photostimulation in the ACx of VIP-Cre::Ai32 mice. b, Model explaining the temporal difference between VIP-Cre::Ai32 and VIP-Cre::AAV-DIO-ChR2(ChETA). In VIP-Cre::Ai32 mice, almost all VIP neurons express ChR2 and exert stronger inhibition on the inhibited neuron group. Because the duration of VIP (green) activation varies, individual inhibited neurons (Inh, purple) receive different degrees of inhibition (strength and duration) from VIP neurons, therefore their firing rates recover to baseline at different time points. This variation propagates to the delayed activated group (dAct, orange), of which activation can start at different time instances.
Acknowledgments
We are grateful to B. Mensh, S. Ranade, N. Spruston and A.M. Zador for comments and discussions; S. Ranade and R. Eifert for invaluable assistance for microdrive design; S.G. Koh, A. Reid, H. Li and Y. Kim for help with experimental setup; A.M. Zador for use of in vitro electrophysiology equipment; B. Burbach for technical assistance. This research was supported by grants from NIH NINDS, the Klingenstein, John Merck, and Sloan Foundations to A.K and NIMH to Z.J.H. B.H. received support from the Swartz Foundation and Marie Curie International Outgoing Fellowship within the EU Seventh Framework Programme for Research and Technological Development. D.K. received support from The Robert Lee and Clara Guthrie Patterson Trust Postdoctoral Fellowship and Human Frontier Science Program (2008–2011).
Footnotes
Author Contributions
H.P. B.H. and A.K. designed the experiments. H.P. and B.H. performed the experiments and analysed data. D.K. set up in vivo optogenetics-assisted recordings. J.S. designed custom behaviour and stimulation systems for the behavioural task. Z.J.H. provided the VIP-ires-Cre mouse line. H.P, B.H, and A.K wrote the manuscript with comments from Z.J.H., J.S. and D.K.
Reprints and permissions information is available at www.nature.com/reprints.
The authors declare no competing financial interests.
Readers are welcome to comment on the online version of the paper.
References
- 1.Silberberg G, Markram H. Disynaptic inhibition between neocortical pyramidal cells mediated by Martinotti cells. Neuron. 2007;53:735–746. doi: 10.1016/j.neuron.2007.02.012. [DOI] [PubMed] [Google Scholar]
- 2.Kapfer C, Glickfeld LL, Atallah BV, Scanziani M. Supralinear increase of recurrent inhibition during sparse activity in the somatosensory cortex. Nat Neurosci. 2007;10:743–753. doi: 10.1038/nn1909. [DOI] [PMC free article] [PubMed] [Google Scholar]
- 3.Gentet LJ, et al. Unique functional properties of somatostatin-expressing GABAergic neurons in mouse barrel cortex. Nat Neurosci. 2012;15:607–612. doi: 10.1038/nn.3051. [DOI] [PubMed] [Google Scholar]
- 4.Cardin JA, et al. Driving fast-spiking cells induces gamma rhythm and controls sensory responses. Nature. 2009;459:663–667. doi: 10.1038/nature08002. [DOI] [PMC free article] [PubMed] [Google Scholar]
- 5.Sohal VS, Zhang F, Yizhar O, Deisseroth K. Parvalbumin neurons and gamma rhythms enhance cortical circuit performance. Nature. 2009;459:698–702. doi: 10.1038/nature07991. [DOI] [PMC free article] [PubMed] [Google Scholar]
- 6.Isaacson JS, Scanziani M. How inhibition shapes cortical activity. Neuron. 2011;72:231–243. doi: 10.1016/j.neuron.2011.09.027. [DOI] [PMC free article] [PubMed] [Google Scholar]
- 7.Ascoli GA, et al. Petilla terminology: nomenclature of features of GABAergic interneurons of the cerebral cortex. Nat Rev Neurosci. 2008;9:557–568. doi: 10.1038/nrn2402. [DOI] [PMC free article] [PubMed] [Google Scholar]
- 8.Carandini M, Heeger DJ, Movshon JA. Linearity and normalization in simple cells of the macaque primary visual cortex. J Neurosci. 1997;17:8621–8644. doi: 10.1523/JNEUROSCI.17-21-08621.1997. [DOI] [PMC free article] [PubMed] [Google Scholar]
- 9.Salinas E, Thier P. Gain modulation: a major computational principle of the central nervous system. Neuron. 2000;27:15–21. doi: 10.1016/s0896-6273(00)00004-0. [DOI] [PubMed] [Google Scholar]
- 10.Acsady L, Gorcs TJ, Freund TF. Different populations of vasoactive intestinal polypeptide-immunoreactive interneurons are specialized to control pyramidal cells or interneurons in the hippocampus. Neuroscience. 1996;73:317–334. doi: 10.1016/0306-4522(95)00609-5. [DOI] [PubMed] [Google Scholar]
- 11.David C, Schleicher A, Zuschratter W, Staiger JF. The innervation of parvalbumin-containing interneurons by VIP-immunopositive interneurons in the primary somatosensory cortex of the adult rat. Eur J Neurosci. 2007;25:2329–2340. doi: 10.1111/j.1460-9568.2007.05496.x. [DOI] [PubMed] [Google Scholar]
- 12.Hajos N, Acsady L, Freund TF. Target selectivity and neurochemical characteristics of VIP-immunoreactive interneurons in the rat dentate gyrus. Eur J Neurosci. 1996;8:1415–1431. doi: 10.1111/j.1460-9568.1996.tb01604.x. [DOI] [PubMed] [Google Scholar]
- 13.Jiang X, Wang G, Lee AJ, Stornetta RL, Zhu JJ. The organization of two new cortical interneuronal circuits. Nat Neurosci. 2013;16:210–218. doi: 10.1038/nn.3305. [DOI] [PMC free article] [PubMed] [Google Scholar]
- 14.Xu H, Jeong HY, Tremblay R, Rudy B. Neocortical somatostatin-expressing GABAergic interneurons disinhibit the thalamorecipient layer 4. Neuron. 2013;77:155–167. doi: 10.1016/j.neuron.2012.11.004. [DOI] [PMC free article] [PubMed] [Google Scholar]
- 15.Pfeffer CK, Xue M, He M, Huang ZJ, Scanziani M. Inhibition of inhibition in visual cortex: the logic of connections between molecularly distinct interneurons. Nat Neurosci. 2013 doi: 10.1038/nn.3446. [DOI] [PMC free article] [PubMed] [Google Scholar]
- 16.Lovett-Barron M, et al. Regulation of neuronal input transformations by tunable dendritic inhibition. Nat Neurosci. 2012;15:423–430. S421–423. doi: 10.1038/nn.3024. [DOI] [PubMed] [Google Scholar]
- 17.Lee SH, et al. Activation of specific interneurons improves V1 feature selectivity and visual perception. Nature. 2012;488:379–383. doi: 10.1038/nature11312. [DOI] [PMC free article] [PubMed] [Google Scholar]
- 18.Letzkus JJ, et al. A disinhibitory microcircuit for associative fear learning in the auditory cortex. Nature. 2011;480:331–335. doi: 10.1038/nature10674. [DOI] [PubMed] [Google Scholar]
- 19.Xu X, Roby KD, Callaway EM. Immunochemical characterization of inhibitory mouse cortical neurons: three chemically distinct classes of inhibitory cells. J Comp Neurol. 2010;518:389–404. doi: 10.1002/cne.22229. [DOI] [PMC free article] [PubMed] [Google Scholar]
- 20.Rudy B, Fishell G, Lee S, Hjerling-Leffler J. Three groups of interneurons account for nearly 100% of neocortical GABAergic neurons. Dev Neurobiol. 2011;71:45–61. doi: 10.1002/dneu.20853. [DOI] [PMC free article] [PubMed] [Google Scholar]
- 21.Taniguchi H, et al. A resource of Cre driver lines for genetic targeting of GABAergic neurons in cerebral cortex. Neuron. 2011;71:995–1013. doi: 10.1016/j.neuron.2011.07.026. [DOI] [PMC free article] [PubMed] [Google Scholar]
- 22.Madisen L, et al. A toolbox of Cre-dependent optogenetic transgenic mice for light-induced activation and silencing. Nat Neurosci. 2012;15:793–802. doi: 10.1038/nn.3078. [DOI] [PMC free article] [PubMed] [Google Scholar]
- 23.Csicsvari J, Hirase H, Czurko A, Buzsaki G. Reliability and state dependence of pyramidal cell-interneuron synapses in the hippocampus: an ensemble approach in the behaving rat. Neuron. 1998;21:179–189. doi: 10.1016/s0896-6273(00)80525-5. [DOI] [PubMed] [Google Scholar]
- 24.Oliva AA, Jr, Jiang M, Lam T, Smith KL, Swann JW. Novel hippocampal interneuronal subtypes identified using transgenic mice that express green fluorescent protein in GABAergic interneurons. J Neurosci. 2000;20:3354–3368. doi: 10.1523/JNEUROSCI.20-09-03354.2000. [DOI] [PMC free article] [PubMed] [Google Scholar]
- 25.Chattopadhyaya B, et al. Experience and activity-dependent maturation of perisomatic GABAergic innervation in primary visual cortex during a postnatal critical period. J Neurosci. 2004;24:9598–9611. doi: 10.1523/JNEUROSCI.1851-04.2004. [DOI] [PMC free article] [PubMed] [Google Scholar]
- 26.Williford T, Maunsell JH. Effects of spatial attention on contrast response functions in macaque area V4. J Neurophysiol. 2006;96:40–54. doi: 10.1152/jn.01207.2005. [DOI] [PubMed] [Google Scholar]
- 27.Paspalas CD, Papadopoulos GC. Serotoninergic afferents preferentially innervate distinct subclasses of peptidergic interneurons in the rat visual cortex. Brain Res. 2001;891:158–167. doi: 10.1016/s0006-8993(00)03193-0. [DOI] [PubMed] [Google Scholar]
- 28.Kawaguchi Y. Selective cholinergic modulation of cortical GABAergic cell subtypes. J Neurophysiol. 1997;78:1743–1747. doi: 10.1152/jn.1997.78.3.1743. [DOI] [PubMed] [Google Scholar]
- 29.Arroyo S, Bennett C, Aziz D, Brown SP, Hestrin S. Prolonged disynaptic inhibition in the cortex mediated by slow, non-alpha7 nicotinic excitation of a specific subset of cortical interneurons. J Neurosci. 2012;32:3859–3864. doi: 10.1523/JNEUROSCI.0115-12.2012. [DOI] [PMC free article] [PubMed] [Google Scholar]
- 30.Alitto HJ, Dan Y. Cell-type-specific modulation of neocortical activity by basal forebrain input. Front Syst Neurosci. 2013;6:79. doi: 10.3389/fnsys.2012.00079. [DOI] [PMC free article] [PubMed] [Google Scholar]
- 31.Zhang F, et al. The microbial opsin family of optogenetic tools. Cell. 2011;147:1446–1457. doi: 10.1016/j.cell.2011.12.004. [DOI] [PMC free article] [PubMed] [Google Scholar]
- 32.Kvitsiani D, et al. Distinct behavioural and network correlates of two interneuron types in prefrontal cortex. Nature. 2013;498:363–366. doi: 10.1038/nature12176. [DOI] [PMC free article] [PubMed] [Google Scholar]
- 33.Schmitzer-Torbert N, Jackson J, Henze D, Harris K, Redish AD. Quantitative measures of cluster quality for use in extracellular recordings. Neuroscience. 2005;131:1–11. doi: 10.1016/j.neuroscience.2004.09.066. [DOI] [PubMed] [Google Scholar]
- 34.Schwarz GE. Estimating the Dimension of a Model. Ann Statist. 1978;6:461–464. [Google Scholar]
- 35.Lorincz A, Nusser Z. Cell-type-dependent molecular composition of the axon initial segment. J Neurosci. 2008;28:14329–14340. doi: 10.1523/JNEUROSCI.4833-08.2008. [DOI] [PMC free article] [PubMed] [Google Scholar]
- 36.Katona I, et al. Molecular composition of the endocannabinoid system at glutamatergic synapses. J Neurosci. 2006;26:5628–5637. doi: 10.1523/JNEUROSCI.0309-06.2006. [DOI] [PMC free article] [PubMed] [Google Scholar]
- 37.Varga V, et al. The presence of pacemaker HCN channels identifies theta rhythmic GABAergic neurons in the medial septum. J Physiol. 2008;586:3893–3915. doi: 10.1113/jphysiol.2008.155242. [DOI] [PMC free article] [PubMed] [Google Scholar]