Abstract
We present the first correction of refraction in three-dimensional (3D) ultrasound imaging using an iterative approach that traces propagation paths through a two-layer planar tissue model, applying Snell’s law in 3D. This approach is applied to real-time 3D transcranial ultrasound imaging by precomputing delays offline for several skull thicknesses, allowing the user to switch between three sets of delays for phased array imaging at the push of a button. Simulations indicate that refraction correction may be expected to increase sensitivity, reduce beam steering errors, and partially restore lost spatial resolution, with the greatest improvements occurring at the largest steering angles. Distorted images of cylindrical lesions were created by imaging through an acrylic plate in a tissue-mimicking phantom. As a result of correcting for refraction, lesions were restored to 93.6% of their original diameter in the lateral direction and 98.1% of their original shape along the long axis of the cylinders. In imaging two healthy volunteers, the mean brightness increased by 8.3% and showed no spatial dependency.
Keywords: transcranial, refraction, 3D ultrasound, matrix array
Introduction
Transcranial ultrasound imaging is an emerging diagnostic technique garnering increasing interest due to demonstrated applications in stroke and cerebrovascular disease,1–7 as well as in new applications including Alzheimer’s disease, dementia,8,9 and Parkinson’s disease.10,11 Given the prevalence of these diseases and the aging population in the United States, transcranial ultrasound imaging is an attractive health care solution due to its low cost and high portability compared with other imaging modalities. Relative to nonimaging transcranial Doppler, acquiring diagnostically useful information with an imaging approach requires less experience and is less operator-dependent.
Image quality in transcranial ultrasound remains limited by the deleterious effects of the skull, including attenuation, aberration, refraction, and mode conversion.12–14 Effects of attenuation may be reduced by positioning the probe within an acoustic window in the temporal bone15; however, this window is absent in 8% to 29% of individuals.16–22 Transmitting with large, lower frequency (~1 MHz) array probes may help reduce the dependence on acoustic window quality.23 The effects of aberration induced by spatially inhomogeneous layers having a different longitudinal wave velocity from that typically assumed by the ultrasound scanner (c = 1540 m/s) may be addressed by one of the many techniques for phase aberration correction.24–29 Some of these aberration correction techniques include inherent correction for refraction using either ultrasound-based measurements in two-dimensional (2D) imaging30,31 or computed-tomography-based measurements in three-dimensional (3D) therapy,26 though refraction correction in 3D imaging has not been demonstrated in vivo. Other techniques have modeled aberration as a distributed phenomenon rather than as a single spatially varying layer.30,32–35 Previously addressed anatomical sources of aberration include layers of bone in the skull (c ≈ 2600)31,36–38 or layers of fat (c ≈ 1450) in the abdomen33,39,40 or breast.41–46
As an alternative to correcting high spatial frequency aberrators, other researchers have estimated and corrected for gross sound speed errors in tissue.47–50 Several manufacturers of clinical ultrasound systems offer a form of sound speed correction: Zonare, which estimates the mean propagation velocity and applies the estimated speed to software beamforming of a 2D image51; Siemens’ “Fatty Tissue Imaging,”52 which corrects fat-induced aberrations in the breast; and Philips, which uses a priori clinical information to assume a fat layer of a constant thickness for all patients in performing “non-adaptive tissue aberration correction.”53
However, to our knowledge, the refraction of ultrasound beams due to planar tissue layers of differing sound speeds (i.e., longitudinal wave propagation velocities) has not been addressed in 3D ultrasound imaging. A 3D approach is essential because refraction, as described by Snell’s law, occurs in three dimensions: an ultrasound beam incident at angle ξ1 on a 2D interface between two 3D volumes of tissue having speeds of sound c1 and c2 enters the second layers at an angle ξ2 (Figure 1):
| (1) |
Figure 1.
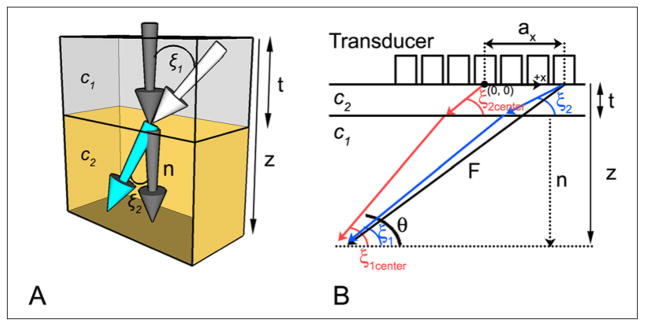
(A) Snell’s law is depicted in three dimensions at the interface between medium 1 (top), having propagation velocity c1, and medium 2 (bottom), having propagation velocity c2. The white arrow indicates the direction of a wavefront incident on the interface at angle ξ1 with respect to the normal (dark gray arrow). Upon entering the second medium, the wavefront travels at an angle ξ2 with respect to the normal. (B) Propagation paths for the proposed two layer model (shown in two dimensions only). Steering vector F is depicted for an outer element (black arrow); red and blue arrows indicate the actual propagation paths used to compute corrected delays for center and outer elements, respectively. F is the steering vector, n is the normal to the bone–tissue interface, ax is the element coordinate in the x direction, c1 and c2 are the propagation velocities in tissue and bone, respectively, z is the focal distance, and t is the thickness of the planar layer (skull or Lucite plate).
Note that ξ1 is the single angle between the normal to the interface and the incident beam and ξ2 is the single angle formed between the normal and the transmitted beam.
In conventional delay-and-sum beamforming, an image is formed by computing the geometric path lengths between foci inside the body and elements of the transducer array. Pulse-echo signals received by the array are delayed according to these geometric path lengths and summed, providing the ability to form an image with diffraction-limited resolution. This delay set is given by the following equation54:
| (2) |
where k is element number, z is range, θ and φ are steering angles in azimuth and elevation, respectively, ax and ay are the x and y coordinates of element k, c is longitudinal wave propagation velocity, and fx, fy, and fz are components of the focusing vector f in x, y, and z, defined as:
| (3a) |
| (3b) |
| (3c) |
Equation 2 computes coherent beamforming delays for a medium having a spatially constant speed of sound, c, usually equal to 1540 m/s in soft tissue. However, in many in vivo imaging scenarios, the presence of tissues such as fat (c ≈ 1470 m/s)55 and bone (c ≈ 2327–2650 m/s)56–58 having propagation velocities different from the assumed value causes Equation 2 to incorrectly compute steering delays. Consequently, echoes from coherent sources are summed out of phase, yielding images with diminished contrast and poorer spatial resolution.
In a previous 2D model of phased array ultrasound imaging through planar tissue layers, Smith et al. attempted to correct this error in phased array imaging by tracing the ray traveled for each element, focal depth, and steering angle in azimuth in the image.55 In that article, the authors assumed the presence of a thin layer of fat or bone with a known propagation velocity overlying a thicker region having c = 1540 m/s. By computing focusing delays for rays traveling through this planar layer and refracted according to Snell’s law, the authors computed a new set of focusing delays and reported improved image quality in imaging through the top of the skull in a healthy adult. In pulse-echo experiments, the corrected delay set restored a 4 dB loss in sensitivity and a 2° steering error in the presence of 12.7 mm Lucite (acrylic) plate.
In tracing rays through the tissue layers and computing the refracted delays using Snell’s law, a 2D tissue layer model contains an inherent assumption that the probe is positioned at an angle of 90° relative to the interface between the two tissue types. In the course of performing 2D clinical ultrasound examinations, the angle between the linear array probe and the skin surface—assumed to be parallel to the interface between two tissue types—is not maintained at 90°. However, when imaging with a matrix array probe, the probe must be maintained very close to 90° relative to the skin surface to ensure contact between the planar surface of the array and the skin. Thus, for clinical imaging, a 3D correction for a refractive layer may be expected to reduce the error in delay computation relative to a 2D correction because out-of-plane transducer motion is expected to be reduced with a matrix array as compared with a linear array.
In addition, addressing refraction in three dimensions allows for correction of out-of-plane beam refraction. In addition to reduced coherence due to focusing errors, refraction also results in image distortion, as indicated by refraction-induced steering errors reported by previous investigators.55,59
In this article, we present the first attempt to correct for refraction in real-time 3D ultrasound imaging. This approach uses a model of two planar tissue layers and is tested in phantom experiments and in vivo imaging through the adult human skull. Simulated beams before and after correction for refraction are also presented. While previous techniques use CT-based measurements,26 in this work, a priori information is used instead of external measurements.
It should also be noted that in this work, the incident and reflected waves are assumed to be planar, which ignores spatial variations in the particle velocity vector and assumes an angle of incidence equal to the net particle velocity vector, as in the plane wave case.
Materials and Method
Scanning System
The scanning system used in this work is the Volumetrics Model 1 (VMI; Durham, North Carolina).54,60 This system uses 16:1 parallel receive beamforming to attain frame rates of up to 30 volumes/s. The transducer used in this work has 256 elements that both transmit and receive and 184 elements that only transmit (Figure 2A). This probe has a center frequency of 2.5 MHz and 30% bandwidth.61 When used in 3D transcranial ultrasound imaging, a pyramidal volume is acquired, from which a coronal slice, a transverse (axial) slice, and two para-sagittal slices are displayed simultaneously in real time (Figure 2B). The user adjusts a trackball control to select any slice in these planes for real-time display. Real-time 3D features also include rendering, spectral Doppler, and color Doppler.
Figure 2.
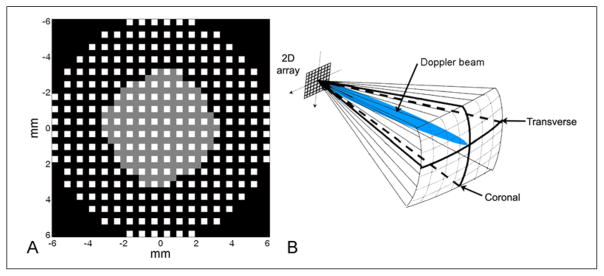
(A) The aperture used in this work consists of 256 elements that both transmit and receive, shown in white, and 184 elements that only transmit, shown in gray. (B) A volume acquired during a typical transtemporal ultrasound examination includes real-time display of both transverse and coronal planes and a steerable Doppler beam.
Path Length Computation
In computing the path length in the presence of a refractive layer, it is necessary to compute the total distance in three dimensions by tracing a ray from the focus to the element for each steering line and focal depth. Given steering angles θ and φ in aziumuth and elevation, respectively, the angle in three dimensions between the steering vector and the normal to the tissue interface is given by:
| (4) |
where n is the normal to the interface and f is the steering vector of Equation 3 (Figure 1). In computing path lengths, the total range z is known, and if the thickness of the refractive layer t and the propagation velocities in the tissue and refractive layers are assumed to be known, then the path length in the direction perpendicular to the surface is already known. The path length in the direction parallel to the tissue interface remains to be computed. The total path length in the direction parallel to the interface has contributions from the steering vector, the element coordinates, and refraction:
| (5) |
where ξ1 is the angle of incidence in the first medium (tissue during receive beamforming) and ξ1 is the angle of exit in the second medium (bone during receive beamforming). Because ξ1 and ξ2 are both unknown (neither the angle of entry or exit at the soft tissue-bone interface is known), g cannot be directly computed. Snell’s law (Equation 1) allows Equation 5 to be rewritten in terms of a single angle:
| (6) |
ξ1 can then be determined numerically using Newton’s method, an iterative technique for finding the roots of continuously differentiable functions. The initial estimate for ξ1 is the steering angle adjusted for the element coordinates of each element, given by:
| (7) |
where ξ is the steering angle (Equation 4) in the absence of refraction.
Successive iterations are given by:
| (8) |
Substituting Equation 6 into Equation 8 gives:
| (9) |
This iterative process yields ξ1 and subsequently ξ2 when Equation 1 is applied. Once ξ1 and ξ2 are known, the delays may be computed as follows:
| (10) |
where ξ1center and ξ2center are the angles of entry and exit for an element at the center of the array, that is, as a result of setting ax(k) = ay(k) = 0.
Delay Computation
Newton’s method was implemented in Matlab (The Mathworks, Natick, Massachusetts) to compute the delays using the described method. Around 10.5 million total receive mode delays must be computed (256 elements × 256 lines × 16:1 parallel processing lines × 10 focal zones), requiring approximately 15 minutes. Refracted transmit delays were also computed by interchanging c1 and c2 in the preceding equations. In this work, five iterations were suitable given delay quantization resulting from a scanning system clock speed of 40 MHz. Tissue speed of sound (c1) was set to 1540 m/s; skull speed of sound (c2) was set to 2500 m/s. Computed delay tables were loaded into the scanner’s memory for imaging. As will be described, data sets were computed for skull thicknesses of t = 2.5 mm, t = 3.75 mm, and t = 5.0 mm.
Simulations
Field II was used to approximately simulate the spatial pressure distributions resulting from refraction due to the skull for a plate thickness of t = 2.5 mm and a propagation velocity of 2500 m/s.62 While Field II is nonpropagative and thus does not physically simulate refraction in the manner of a full wave model,63 the effects on the pulse-echo beams due to refraction may be simulated by beamforming the data with delay errors equal to the errors induced by refraction. This was accomplished using the described iterative approach to compute delays in the presence of refraction (Equations 6–10). The delay error due to refraction is given by:
| (11) |
To simulate the refracted case, transmit and receive signals were delayed by an additional derror when calculating the pulse-echo field. That is, the error induced was such that it could be exactly removed by adding −derror.
For both control and refracted cases, pulse-echo beams were calculated at a depth of z = 3.5 cm (approximately halfway to the midline in an in vivo transcranial scan) for three sets of steering angles (θ, φ): (0°, 0°), (16°, 0°), and (32°, 32°). The final angle (32°, 32°) corresponds to the outermost corner in a pyramidal 3D imaging volume. The case to be tested in phantom experiments was also simulated, in which z = 5.5 cm and t = 5.0 mm, and beams were steered laterally to 0.5 cm, the outer lateral extent of the lesion.
Critical Angles in Transcranial Ultrasound
The origin and effects of the problem of critical angles in transcranial ultrasound has been well described in previous studies.64,65 The critical angle is defined as:
| (12) |
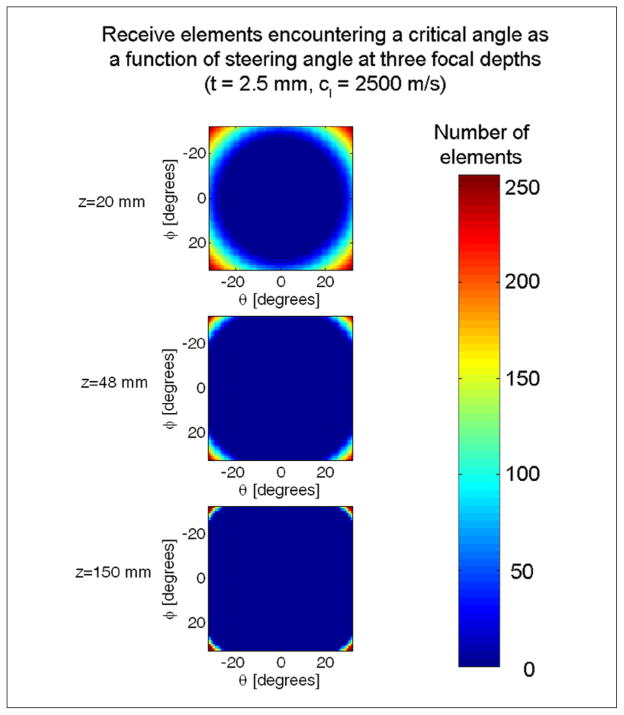
where in the case of echo reception in transcranial ultrasound, c1 = 1540 m/s and c2 = 2500 m/s, yielding ξcrit = 38°. Waves propagate for ξ < ξcrit but are totally internally reflected when ξ = ξcrit. The total internal reflection of longitudinal waves manifests itself as a dark line or “stripe” artifact at these angles in phased array scans. Beyond this angle, waves may propagate through the skull after experiencing multiple mode conversions.65 Other researchers have intentionally induced shear mode conversions as a means of overcoming poor acoustic impedance matching in traditional longitudinal wave ultrasound imaging.13,66,67 In the present work, any element having an angle ξ1 that exceeds the critical angle after the final iteration is simply disabled. Elements are only disabled for the image lines and focal zones at which they exceed a critical angle. In Figure 3, the total number of elements disabled are displayed for three C-scan slice through a 3D pyramidal volume at three focal depths. This figure illustrates that at most angles and focal depths, only a few elements need be eliminated from the beamsum.
Figure 3.
This figure shows the total number of receive elements encountering critical angles in 3D phase array imaging in C-scan slices through the pyramidal volume for three focal zones: z = 20 mm, z = 48 mm, and z = 150 mm. Axes denote steering angles in θ and φ. Elements at depth and steering angle combinations such that they encounter rays that exceed critical angles are turned off for that particular image line and focal zone.
Phantom Experiments
Refracted delay sets were first tested on a tissue-mimicking phantom (ATS Laboratories Model 539, Bridgeport, CT) with a 1 cm diameter, +6 dB contrast cylindrical lesion centered within the 3D volume. Lucite (acrylic) plates will be used to induce refraction, as recent work indicates that steered ultrasound propagation through an acrylic plate and through a degassed temporal bone sample yield critical angles located in nearly identical angular positions.65 While the temporal bone differs from planar Lucite in that its curved geometry and varying density lead to the introduction of an asymmetric response, the planar Lucite model will be used in this work as a first order approximation given the similar angular dependence of transmitted amplitude within the critical angles.65 Four acquisitions were made using different delay sets: (1) as a control, a conventional delay set (Equation 2) using all transmit and receive elements with no refractive layer; (2) as a second control condition, receive elements expected to encounter a critical angle were disabled only for the imaging lines and focal depths in which a critical angle would be exceeded in the presence of a Lucite plate; (3) a 5 mm Lucite (c = 2500 m/s) plate was placed between the transducer and the phantom; and (4) delays corrected for refraction (Equations 6–10) for t = 5 mm were loaded. After the Lucite plate was added, the system gain was adjusted to maintain constant background brightness, as effects of attenuation or reverberation are beyond the scope of this study.
Imaging through a planar layer of bone is expected to distort the image by causing (1) a lateral narrowing of targets in the image (Figure 4) and (2) a downward distortion of these targets as steering angle increases due to underestimation of the propagation velocity. The effect of correction on these two distortion effects was evaluated in tissue-mimicking phantom experiments with a Lucite plate and a cylindrical lesion having a long axis parallel to the transducer. Volumes were acquired for both positive and negative contrast lesions before and after correction in three slices through the center of the lesion for each volume (six measurements per volume for lateral and axial). Lateral narrowing was evaluated by measuring the cross-sectional diameter of the lesion before and after correction. Axial image distortion was evaluated by measuring and the angle formed between the lesion edge and the vertical in the acquired volumes at both left and right edges. For an undistorted image, this angle is 90°.
Figure 4.
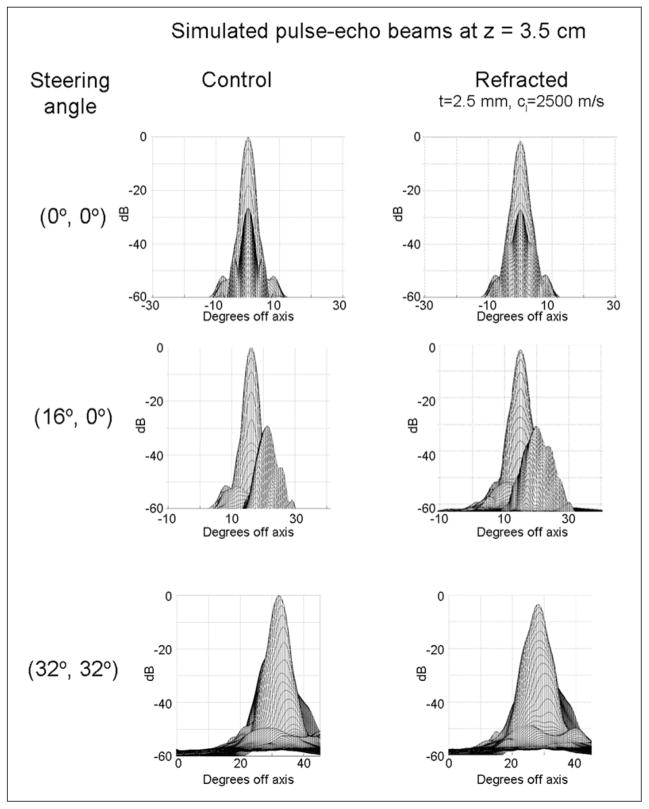
Results of Field II simulations of pulse-echo beams beamformed with geometric delays (first column) and with delays computed based on ray tracing for signals having traversed a 2.5 mm refractive layer (second column).
In vivo Imaging
Prior to in vivo scanning, three sets of delays were loaded onto the scanner: (1) the conventional (control) delay set with critical angle elements disabled (Equation 2), (2) a refraction-corrected delay set with t = 2.5 mm, and (3) a refraction corrected delay set with t = 3.75 mm. These thicknesses were chosen based on published temporal bone thicknesses of 2 to 4 mm.68 Speed of sound in the skull was assumed to equal 2500 m/s. Once preloaded, the user was able to immediately switch between delay sets for real-time scanning at the push of a button. The authors scanned themselves via the temporal acoustic window, using imaging to locate the window. The probe remained stationary during acquisitions with the three delay sets.
Results
Simulations
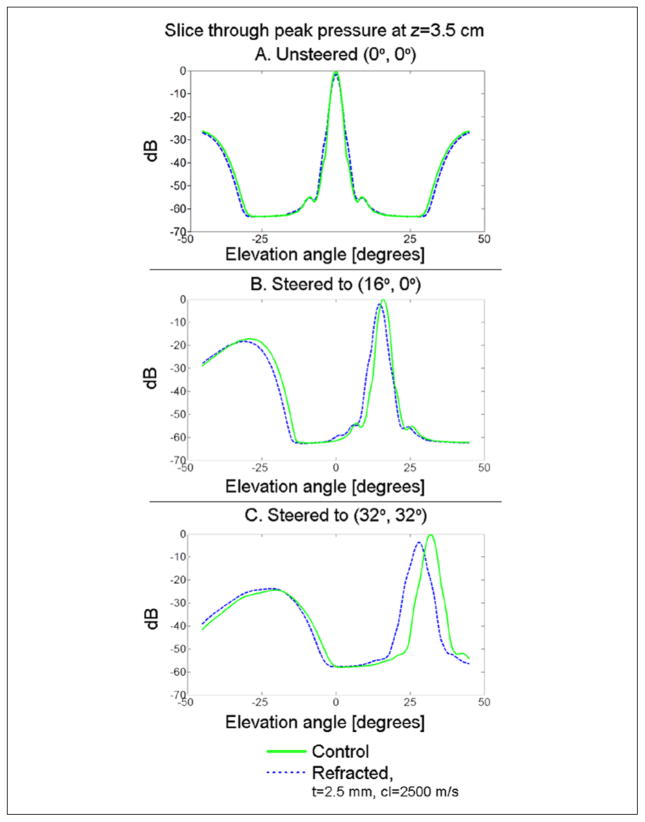
The 3D pulse-echo pressure distributions at a depth of 3.5 cm and three different steering angles are presented in Figure 4 for both control and refracted (t = 2.5 mm) beams. Changes in shape of the main lobe may be seen. To allow direct comparison of the peak pressure and steering error, in Figure 5, the slices through the pressure maximum are presented for all three sets of steering angles. For unsteered beams (Figure 4A), there is no net steering error, although the refracted beam decreases at its peak by 1.45 dB and increases in −6 dB area by 21%. For transmit and receive beams steered to (16°, 0°) (Figure 4B), there is a net steering error of 1.2°, a decrease in the pressure field maximum of 1.98 dB, and an increase in −6 dB area of 24.55%. For transmit and receive beams steered to (32°, 32°) (Figure 4C), there is a net steering error of 3.6° in each direction, a decrease in the pressure field maximum of 3.53 dB, and an increase in the −6 dB area of the beam of 48.70%. For the case tested in phantom experiments (z = 5.5, t = 5.0 mm), the simulated beam shift due to refraction at 0.5 cm (lesion edge) was 0.5 mm.
Figure 5.
Simulated pulse-echo beams for the control and refracted cases are compared by examining slices through the location of maximum pressure in the azimuth direction. In the case of unsteered beams (A), there is net no steering error, although the refracted beam decreases at its peak by 1.45 dB and increases in −6 dB area by 21%. For transmit and receive beams steered to (16°, 0°) (B), there is a net steering error of 1.2°, a decrease in the pressure field maximum of 1.98 dB and an increase in −6 dB area of 24.55%. For transmit and receive beams steered to (32°, 32°) (C), there is a net steering error of 3.6° in each direction, a decrease in the pressure field maximum of 3.53 dB, and in increase in the −6 dB area of the beam of 48.70%.
Tissue-Mimicking Phantom
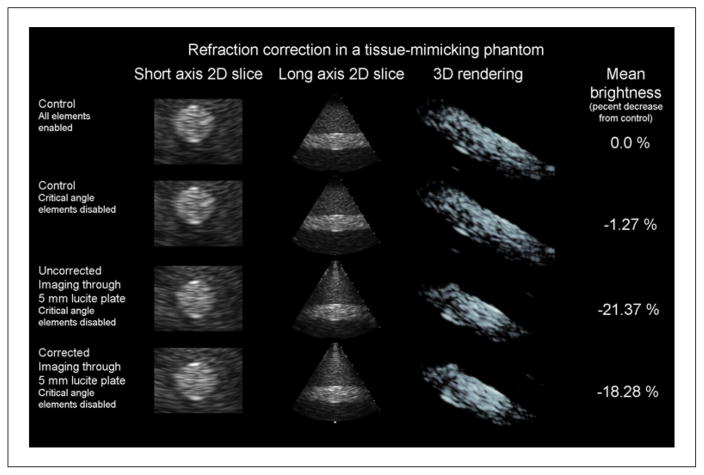
The results of imaging the tissue-mimicking phantom are presented in Figure 6. In the first two rows, orthogonal B-mode slices through the short and long axes of the cylinder are shown. Oblique view volume renderings are shown in the third column. Finally, in the fourth column, the mean brightness of the entire volume is shown. Mean brightness is expected to decrease from the control case. In imaging this phantom, the image with elements disabled for expected critical angles looks identical to that acquired with all elements (Figure 6, top two rows), making this an acceptable control delay set to compare with the refracted delay set since the images in rows 2 to 4 of Figure 6 all use the same number of channels.
Figure 6.
Results of a single refraction correction experiment in a tissue-mimicking phantom are presented. Results shown for each column are the control case (top row), the control case with receive elements that will encounter critical angles in the presence of a 5 mm Lucite plate disabled (second row), uncorrected imaging through a 5 mm Lucite plate (third row), and refraction-corrected imaging through a 5 mm Lucite plate (bottom row). In the first column, magnified short-axis 2D slices through the center of a 1 cm diameter, +6 dB contrast cylindrical lesion are presented. In the second column, a long axis slice through the cylindrical lesion is presented. When the plate is added between the second and third row of images, downward bowing distortion at the outer edges of the cylinder is visible in these long-axis slices. When refraction is corrected between the third and fourth row of images, this distortion is partially corrected. In the third column, an oblique view of a 3D rendering of the lesion is shown. In the fourth column, the mean speckle brightness throughout the entire 3D volume is given relative to the control brightness. Correcting for refraction restored approximately 3% of lost brightness, visible in the increase in the number of voxels at the same rendering threshold between the 3D renderings of the third and fourth rows.
Approximately 3% of the lost brightness is restored as a result of refraction correction between the third and fourth rows. This can be seen by comparing the volume renderings in the third and fourth rows, as more voxels exceed the display threshold in the fourth row. Correcting refraction also has the effect of reducing a distortion artifact. Specifically, the downward bowing that is visible in the long axis 2D slice of the third row is reduced in the fourth row. The same effect is visible in the short axis slices, as the circular cross section of the cylinder appears to be elliptical in shape in row 3 before being restored to a circular shape in row 4.
As a result of correcting for refraction, mean cross-sectional diameter of the lesion increased from 11.9 ± 0.2% to 93.6 ± 3.0% of the lesion diameter measured in the absence of the refracting plate. Lesion diameter in the refracted case was 0.82 cm, a decrease of 0.09 cm in each direction from the control case. Simulated beam shift for the refracted case was only 0.05 cm. In measuring the angular distortion of the horizontal lesion, the mean angle formed by the cylindrical lesion in the presence of the Lucite plate was 85.0 ± 0.6° and the mean angle after correction was 88.3 ± 0.5°.
In Vivo Imaging
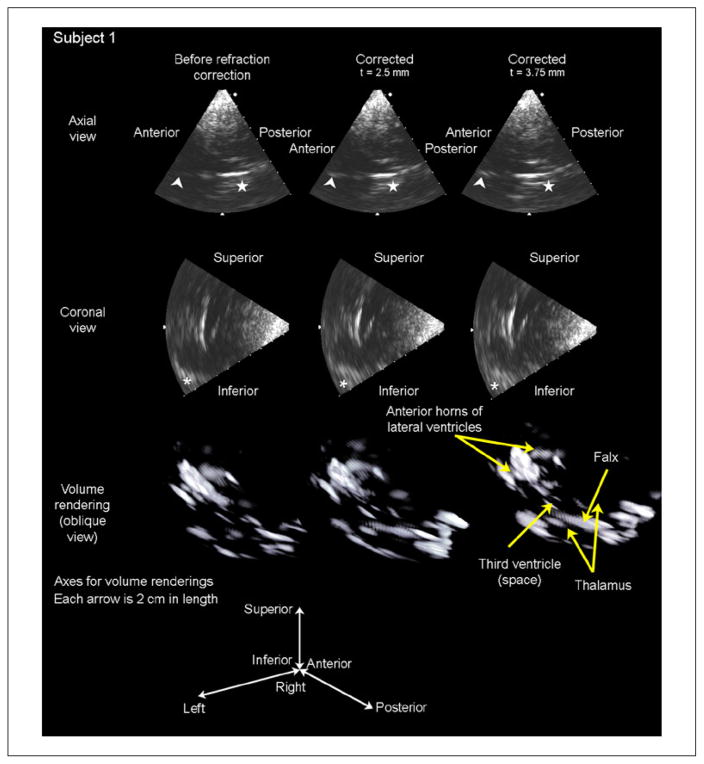
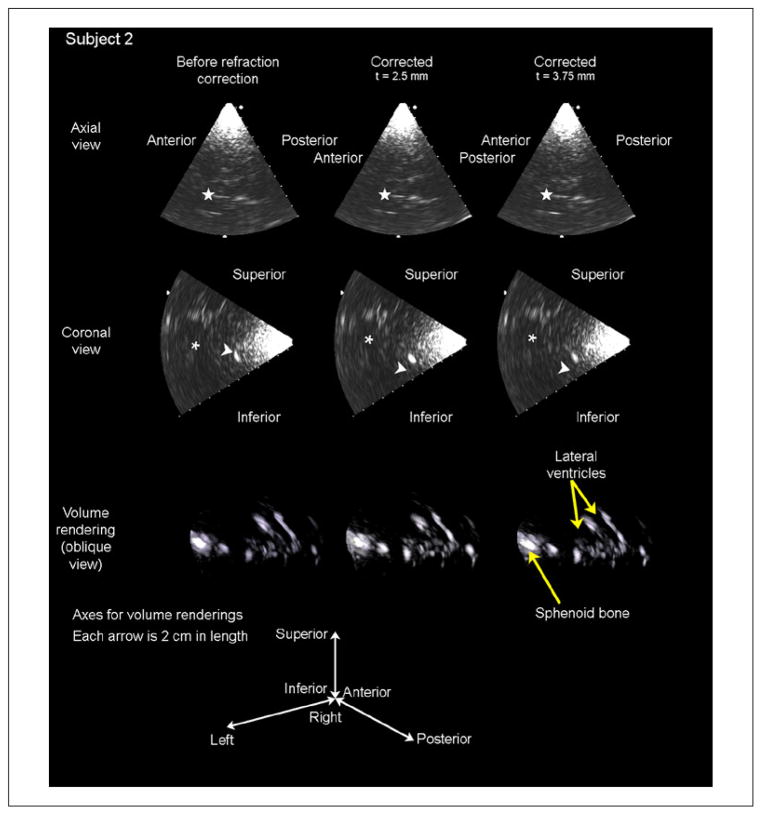
Results of in vivo imaging are presented in Figures 7 and 8. For each subject, two orthogonal B-mode slices and a volume rendering are presented for each of three cases: before refraction correction (first column), after refraction correction assuming a skull thickness of t = 2.5 mm, (second column), and after refraction correction assuming a skull thickness of t = 3.75 mm (third column).
Figure 7.
Results of in vivo imaging in subject 1 are displayed as an axial slice (top row), a coronal slice (second row), and a volume rendering (third row) for each of three cases: before refraction correction, after refraction correction with an assumed skull thickness of 2.5 mm, and after refraction correction with an assumed skull thickness of 3.75 mm. The arrowhead in the axial slices indicates the falx cerebri separating the anterior horns of the lateral ventricles, which increases in brightness after both t = 2.5 and t = 3.75 mm corrections. The star in the axial slices indicates the boundary of the third ventricle, which becomes visible with both corrections. The asterisk in the coronal slices indicates the contralateral sphenoid bone, which is shifted into the field of view as a result of refraction correction. These brightness increases are visible in the volume renderings, as the number of voxels above the threshold for display increases after correcting for refraction.
Figure 8.
Results of in vivo imaging in subject 2 are displayed as an axial slice (top row), a coronal slice (second row), and a volume rendering (third row) for each of three cases: before refraction correction, after refraction correction with an assumed skull thickness of 2.5 mm, and after refraction correction with an assumed skull thickness of 3.75 mm. The star in the axial slices indicates the falx cerebri separating the anterior horns of the lateral ventricles, which increases in brightness after the t = 2.5 mm correction only. These same structures are seen in the coronal slices, indicated by the asterisk. The arrowhead in the coronal slices indicates the sphenoid bone, which increases in brightness with the 2.5 mm correction but decreases in brightness with the 3.75 mm correction. These brightness increases can be seen in the volume renderings, as the number of voxels above the threshold for display increases after correcting for refraction.
In Figure 7, the falx cerebri (denoted by an arrowhead) and the boundary of the third ventricle (denoted by a star) increase in brightness in going from the refracted to the 2.5 mm corrected case, and again from the 2.5 mm to the 3.75 mm corrected case. In subject 1, the mean brightness throughout the volume increased by 3.75% relative to the control in the t = 2.5 mm case and by 5.95% relative to the control in the t = 3.75 mm case, suggesting that this subject’s skull thickness is closer to 3.75 mm than to 2.5 mm for this probe position.
In the lower right portion of the coronal views of Figure 7, an asterisk indicates the lesser wing of the sphenoid bone. After refraction correction, the hyperechoic sphenoid bone can be seen to shift into the image, while central structures in the image (borders of lateral ventricles) increase in brightness but remain stationary due to refraction correction. This shifting of structures at the largest steering angle indicates that steering errors—expected to be greatest at the largest steering angles as seen in the simulations of Figures 4 and 5—are being corrected. Given the changing the scan geometry due to reduction of the distortion artifact, the volume renderings of Figures 7 and 8 show that hyperechoic structures are, in fact, becoming brighter—evidenced by the presence of more voxels after correction in these renderings—rather than that bright structures are moving into the plane in the B-mode slices.
In Figure 8, image contrast in the lateral ventricles improved in the axial slice in the t = 2.5 mm corrected case relative to the control case (indicated by a star). In the coronal slices, brightness of the sphenoid bone (arrowhead) and the ventricular borders (asterisk) also increased in the t = 2.5 mm case but decreased in the 3.75 mm case. In subject 2, mean brightness throughout the volume increased by 10.66% in the t = 2.5 mm case and decreased by 0.81% in the t = 3.75 mm case. These results suggest that this subject’s skull thickness is closer to 2.5 mm than to 3.75 mm for this probe position.
Discussion
Spatial Dependence of Refraction Correction
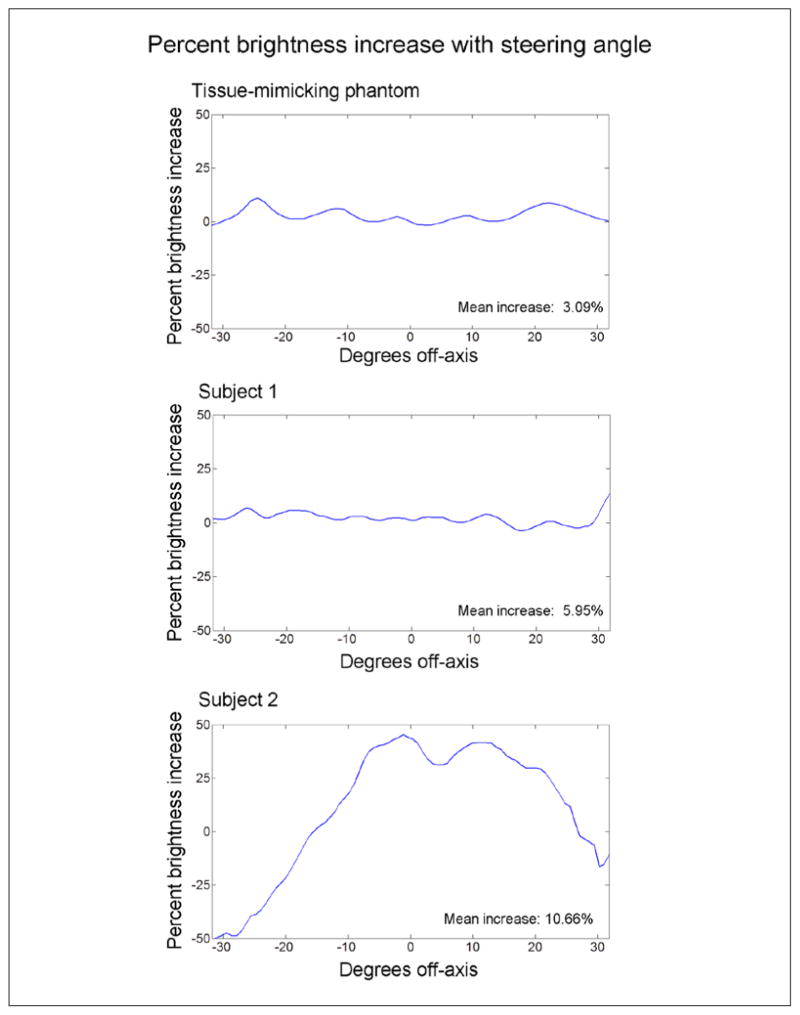
For the two subjects and the phantom, further investigation was made into spatial dependence of the mean increase in speckle brightness. Because a unique delay was calculated for each element, focal zone, and image line, this technique was not expected to suffer from any of the spatial stability (i.e., isoplanatic patch) concerns present in aberration correction techniques and, in fact, has much in common with recent aberration correction techniques, which account for propagation path dependencies.27,38 In Figure 9, the percent brightness increase with steering angle is plotted for the phantom and the two subjects using the entire pyramidal volume. For the human subjects, the cases giving the greatest improvement were compared with the control case. Steering angle changes across both azimuth and elevation were averaged in creating these plots. There was little spatial dependence in the tissue-mimicking phantom case. The same was true for subject 1, except at the rightmost edge, which corresponds to where the sphenoid bone shifted into the image in the coronal view (Figure 7). Subject 2, however, showed a large spatial variation in brightness change. Upon further examination, this seems to be tied to the location of the bright sphenoid target (Figure 8), which sees a large increase in brightness after correction, while the hypoechoic lateral ventricles dominate the superior and left regions of this volume. Thus, spatial dependence of brightness change seems to be weighted only by the presence of bright targets and not by any spatial dependency of the correction technique itself.
Figure 9.
Percent brightness increase is displayed as a function of steering angle for the tissue mimicking phantom and each of the two human subjects. The tissue phantom data do not indicate that the ability to increase speckle brightness by correcting refraction is spatially dependent. In the human data, subject 1 shows little spatial dependency except near +30°, which corresponds to the position of the contralateral sphenoid bone moving into the field of view, visible in the lower right portions of the coronal slices of Figure 7. The data of subject 2 shows a drastic decrease in brightness near −30° (corresponding to the location hypoechoic ventricles in Figure 8) and a large increase in brightness between 0 and +15°, corresponding to the location of the sphenoid bone indicated by the arrowhead in Figure 8.
Assumptions and Implications of This Work
In this work, the probe was assumed to be orthogonal to the tissue surface. Even if this assumption is true, the surface of the skin must be parallel to the interface between the thin layer of bone or fat and the underlying soft tissue layer to compute and correct for refraction in the manner proposed in this article. While this assumption seems to have been valid given the results presented, it will need to be considered more carefully for imaging through multiple layers or in other anatomical regions.
In addition, while the surface of the skull beneath the 12 mm aperture was assumed to be planar in this study, accounting for the curved surface of the temporal bone would be expected to more accurately model the in vivo imaging situation. As the presented phantom experiments only address the planar case, the further studies could investigate the effect of correcting for refraction in planar versus curved layers in the presence of known targets in either phantom experiments or simulations.
Given the presence of extracranial tissues between the skull and the transducer, a model using three layers may provide more accurate computation of imaging delays, though the contribution of a third unknown angle would increase computational complexity. Improvements due to this model would be greatest at the largest steering angles, while at the center of the image, the three-layer model would converge to the two-layer model. To quantify the difference between two and three layer models, for a central element and a steering angle (0°, 0°), transitioning from a one-layer model (i.e., delay-and-sum, c = 1540) to a two-layer model produces a 4.29 μs change in delay value, while transitioning from a two-layer to a three-layer model produces no change in delay value. For a central element steered to the edge of the volume (32°, 0°), transitioning from a one-layer to a two-layer model produces a 7.15 μs change in delay value, while going from a two-layer to a three-layer model produces a 3.60 μs change in delay value. Thus, implementing a three-layer model would likely provide additional benefits at larger steering angles while introducing a sin(ξ3) term in Equation 5 and requiring assumptions of the thickness and speed of sound in a layer of extracranial tissue, t2.
Another potential secondary improvement to the presented algorithm may be found in the spatial quantization of propagation paths, limited by the number of beams that can be formed in real time. While a finer beam sampling would be expected to produce a small improvement in image quality at volume edges due to propagation path variation over the width of a single beam, it is not possible to image in real time with a finer beam sampling than presented in this paper for the system described.
While this work only considered refraction due to imaging through bone, which has a higher speed of sound than tissue, this approach would also be applicable when imaging through a thin layer of fat, as in cardiac or abdominal imaging. Clinicians have often observed the effects of refraction in echocardiography; in extreme cases, duplication artifacts attributed to abdominal fat layers such as the appearance of two aortas have been reported.69,70 In cases such as these, it might be helpful to have the option to either load a precomputed, alternative set of delays, or to adaptively compute a new set based on either measurements or user inputs of layer thicknesses and properties.
In the transcranial imaging case, we have demonstrated the first refraction correction in 3D ultrasound imaging. In two human subjects, we report mean brightness increases of 5.95% and 10.66%. The primary effect of refraction correction on image quality is the reduction of distortion artifacts, which are restored by 11.9% to 93.6% of the original value in the lateral direction and 3.67% to 98.1% of the original value in the axial direction. The mean brightness increase of 8.3% is secondary to the distortion correction and less than the 24% brightness increase observed in vivo due to phase correction.38 As an addition to many recent developments in transcranial ultrasound imaging technology including new techniques for aberration correction, new probes, and contrast agent-specific techniques, it is our hope that transcranial ultrasound will continue to improve in diagnostic utility and clinical acceptance for assessing stroke and other neurological disorders.
Acknowledgments
Funding
The author(s) disclosed receipt of the following financial support for the research, authorship, and/or publication of this article: This work was supported by National Institutes of Health Grants R01 HL089507 and T32EB001040.
Footnotes
Reprints and permissions: sagepub.com/journalsPermissions.nav
Declaration of Conflicting Interests
The author(s) declared no potential conflicts of interest with respect to the research, authorship, and/or publication of this article.
References
- 1.Holscher T, Schlachetzki F, Zimmermann M, Jakob W, Ittner KP, Haslberger J, et al. Transcranial ultrasound from diagnosis to early stroke treatment. 1. Feasibility of prehospital cerebrovascular assessment. Cerebrovasc Dis. 2008;26:659–63. doi: 10.1159/000166844. [DOI] [PubMed] [Google Scholar]
- 2.Schlachetzki F, Herzberg M, Holscher T, Ertl M, Zimmermann M, Ittner KP, et al. Transcranial ultrasound from diagnosis to early stroke treatment: Part 2: Prehospital neurosonography in patients with acute stroke: The Regensburg stroke mobile project. Cerebrovasc Dis. 2012;33:262–71. doi: 10.1159/000334667. [DOI] [PubMed] [Google Scholar]
- 3.Holscher T. Prehospital use of portable ultrasound for stroke diagnosis and treatment initiation. Air Rescue. 2012;2:48–50. [Google Scholar]
- 4.Holscher T, Wilkening W, Draganski B, Meves SH, Eyding J, Voit H, et al. Transcranial ultrasound brain perfusion assessment with a contrast agent-specific imaging mode: Results of a two-center trial. Stroke. 2005;36:2283–85. doi: 10.1161/01.STR.0000179038.63109.b0. [DOI] [PubMed] [Google Scholar]
- 5.Kern R, Kablau M, Sallustio F, Fatar M, Stroick M, Hennerici MG, et al. Improved detection of intracerebral hemorrhage with transcranial ultrasound perfusion imaging. Cerebrovasc Dis. 2008;26:277–83. doi: 10.1159/000147456. [DOI] [PubMed] [Google Scholar]
- 6.Kern R, Diels A, Pettenpohl J, Kablau M, Brade J, Hennerici MG, et al. Real-time ultrasound brain perfusion imaging with analysis of microbubble replenishment in acute MCA stroke. J Cereb Blood Flow Metab. 2011;31:1716–24. doi: 10.1038/jcbfm.2011.14. [DOI] [PMC free article] [PubMed] [Google Scholar]
- 7.Wessels T, Bozzato A, Mull M, Klotzsch C. Intracranial collateral pathways assessed by contrast-enhanced three-dimensional transcranial color-coded sonography. Ultrasound Med Biol. 2004;30:1435–40. doi: 10.1016/j.ultrasmedbio.2004.05.011. [DOI] [PubMed] [Google Scholar]
- 8.Doepp F, Valdueza JM, Schreiber SJ. Transcranial and extracranial ultrasound assessment of cerebral hemodynamics in vascular and Alzheimer’s dementia. Neurol Res. 2006;28:645–49. doi: 10.1179/016164106X130380. [DOI] [PubMed] [Google Scholar]
- 9.Roher AE, Garami Z, Tyas SL, Maarouf CL, Kokjohn TA, Belohlavek M, et al. Transcranial doppler ultrasound blood flow velocity and pulsatility index as systemic indicators for Alzheimer’s disease. Alzheimers Dement. 2011;7:445–55. doi: 10.1016/j.jalz.2010.09.002. [DOI] [PMC free article] [PubMed] [Google Scholar]
- 10.Behnke S, Berg D, Naumann M, Becker G. Differentiation of Parkinson’s disease and atypical Parkinsonian syndromes by transcranial ultrasound. J Neurol Neurosurg Psychiatry. 2005;76:423–25. doi: 10.1136/jnnp.2004.049221. [DOI] [PMC free article] [PubMed] [Google Scholar]
- 11.Gaenslen A, Unmuth B, Godau J, Liepelt I, Di Santo A, Schweitzer KJ, et al. The specificity and sensitivity of transcranial ultrasound in the differential diagnosis of Parkinson’s disease: A prospective blinded study. Lancet Neurol. 2008;7:417–24. doi: 10.1016/S1474-4422(08)70067-X. [DOI] [PubMed] [Google Scholar]
- 12.Pinton G, Aubry JF, Bossy E, Muller M, Pernot M, Tanter M. Attenuation, scattering, and absorption of ultrasound in the skull bone. Med Phys. 2012;39:299–307. doi: 10.1118/1.3668316. [DOI] [PubMed] [Google Scholar]
- 13.White PJ, Clement GT, Hynynen K. Longitudinal and shear mode ultrasound propagation in human skull bone. Ultrasound Med Biol. 2006;32:1085–96. doi: 10.1016/j.ultrasmedbio.2006.03.015. [DOI] [PMC free article] [PubMed] [Google Scholar]
- 14.Pinton G, Aubry JF, Fink M, Tanter M. Effects of nonlinear ultrasound propagation on high intensity brain therapy. Med Phys. 2011;38:1207–16. doi: 10.1118/1.3531553. [DOI] [PubMed] [Google Scholar]
- 15.Aaslid R, Markwalder TM, Nornes H. Noninvasive transcranial Doppler ultrasound recording of flow velocity in basal cerebral arteries. J Neurosurg. 1982;57:769–74. doi: 10.3171/jns.1982.57.6.0769. [DOI] [PubMed] [Google Scholar]
- 16.Hashimoto H, Etani H, Naka M, Kinoshita N, Nukada T. Assessment of the rate of successful transcranial Doppler recording through the temporal windows in Japanese with special reference to aging and sex. Nippon Ronen Igakkai Zasshi. 1992;29:119–22. doi: 10.3143/geriatrics.29.119. [DOI] [PubMed] [Google Scholar]
- 17.Marinoni M, Ginanneschi A, Forleo P, Amaducci L. Technical limits in transcranial Doppler recording: inadequate acoustic windows. Ultrasound Med Biol. 1997;23:1275–77. doi: 10.1016/s0301-5629(97)00077-x. [DOI] [PubMed] [Google Scholar]
- 18.Baumgartner RW, Arnold M, Gonner F, Staikow I, Herrmann C, Rivoir A, et al. Contrast-enhanced transcranial color-coded duplex sonography in ischemic cerebrovascular disease. Stroke. 1997;28:2473–78. doi: 10.1161/01.str.28.12.2473. [DOI] [PubMed] [Google Scholar]
- 19.Gahn G, Gerber J, Hallmeyer S, Hahn G, Ackerman RH, Reichmann H, et al. Contrast-enhanced transcranial color-coded duplexsonography in stroke patients with limited bone windows. Am J Neuroradiol. 2000;21:509–14. [PMC free article] [PubMed] [Google Scholar]
- 20.Seidel G, Kaps M, Gerriets T. Potential and limitations of transcranial color-coded sonography in stroke patients. Stroke. 1995;26:2061–66. doi: 10.1161/01.str.26.11.2061. [DOI] [PubMed] [Google Scholar]
- 21.Postert T, Federlein J, Przuntek H, Buttner T. Insufficient and absent acoustic temporal bone window: potential and limitations of transcranial contrast-enhanced color-coded sonography and contrast-enhanced power-based sonography. Ultrasound Med Biol. 1997;23:857–62. doi: 10.1016/s0301-5629(97)00047-1. [DOI] [PubMed] [Google Scholar]
- 22.Krejza J, Swiat M, Pawlak MA, Oszkinis G, Weigele J, Hurst RW, et al. Suitability of temporal bone acoustic window: conventional TCD versus transcranial color-coded duplex sonography. J Neuroimaging. 2007;17:311–14. doi: 10.1111/j.1552-6569.2007.00117.x. [DOI] [PubMed] [Google Scholar]
- 23.Lindsey BD, Nicoletto HA, Bennett E, Laskowitz DT, Smith SW. Simultaneous bilateral real-time 3D transcranial ultrasound imaging at 1 MHz through poor acoustic windows. Ultrasound Med Biol. 2013;39:721–34. doi: 10.1016/j.ultrasmedbio.2012.11.019. [DOI] [PMC free article] [PubMed] [Google Scholar]
- 24.Flax SW, O’Donnell M. Phase-aberration correction using signals from point reflectors and diffuse scatterers: Basic principles. IEEE Trans Ultrason Ferroelectr Freq Control. 1988;35:758–67. doi: 10.1109/58.9333. [DOI] [PubMed] [Google Scholar]
- 25.Liu DL, Waag RC. Time-shift compensation of ultrasonic pulse focus degradation using least-mean-square error estimates of arrival time. J Acoust Soc Am. 1994;95:542–55. doi: 10.1121/1.408348. [DOI] [PubMed] [Google Scholar]
- 26.Clement GT, Hynynen K. A non-invasive method for focusing ultrasound through the human skull. Phys Med Biol. 2002;47:1219–36. doi: 10.1088/0031-9155/47/8/301. [DOI] [PubMed] [Google Scholar]
- 27.Waag RC, Astheimer JP. Statistical estimation of ultrasonic propagation path parameters for aberration correction. IEEE Trans Ultrason Ferroelectr Freq Control. 2005;52:851–69. doi: 10.1109/tuffc.2005.1503972. [DOI] [PubMed] [Google Scholar]
- 28.Astheimer JP, Pilkington WC, Waag RC. Reduction of variance in spectral estimates for correction of ultrasonic aberration. IEEE Trans Ultrason Ferroelectr Freq Control. 2006;53:79–89. doi: 10.1109/tuffc.2006.1588393. [DOI] [PubMed] [Google Scholar]
- 29.Haworth KJ, Fowlkes JB, Carson PL, Kripfgans OD. Towards aberration correction of transcranial ultrasound using acoustic droplet vaporization. Ultrasound Med Biol. 2008;34:435–45. doi: 10.1016/j.ultrasmedbio.2007.08.004. [DOI] [PMC free article] [PubMed] [Google Scholar]
- 30.Tanter M, Thomas JL, Fink M. Focusing and steering through absorbing and aberrating layers: application to ultrasonic propagation through the skull. J Acoust Soc Am. 1998;103(5 Pt 1):2403–10. doi: 10.1121/1.422759. [DOI] [PubMed] [Google Scholar]
- 31.Vignon F, Aubry JF, Tanter M, Margoum A, Fink M. Adaptive focusing for transcranial ultrasound imaging using dual arrays. J Acoust Soc Am. 2006;120:2737–45. doi: 10.1121/1.2354073. [DOI] [PubMed] [Google Scholar]
- 32.Wu F, Fink M. Optimal focusing through aberrating media: A comparison between time reversal mirror and time delay correction techniques. IEEE Ultrasonics Symposium; Orlando. 8–11 December 1991; pp. 1195–99. [Google Scholar]
- 33.Ng GC, Freiburger PD, Walker WF, Trahey GE. A speckle target adaptive imaging technique in the presence of distributed aberrations. IEEE Trans Ultrason Ferroelectr Freq Control. 1997;44:140–51. doi: 10.1109/58.585209. [DOI] [PubMed] [Google Scholar]
- 34.Lacefield JC, Pilkington WC, Waag RC. Distributed aberrators for emulation of ultrasonic pulse distortion by abdominal wall. Acoust Res Lett Online. 2001;3:47–52. [Google Scholar]
- 35.Tillett JC, Astheimer JP, Waag RC. A model of distributed phase aberration for deblurring phase estimated from scattering. IEEE Trans Ultrason Ferroelectr Freq Control. 2010;57:214–28. doi: 10.1109/TUFFC.2010.1400. [DOI] [PMC free article] [PubMed] [Google Scholar]
- 36.Ivancevich NM, Pinton GF, Nicoletto HA, Bennett E, Laskowitz DT, Smith SW. Real-time 3D contrast-enhanced transcranial ultrasound and aberration correction. Ultrasound Med Biol. 2008;34:1387–95. doi: 10.1016/j.ultrasmedbio.2008.01.015. [DOI] [PMC free article] [PubMed] [Google Scholar]
- 37.Ivancevich NM, Dahl JJ, Smith SW. Comparison of 3-D multi-lag cross- correlation and speckle brightness aberration correction algorithms on static and moving targets. IEEE Trans Ultrason Ferroelectr Freq Control. 2009;56:2157–66. doi: 10.1109/TUFFC.2009.1298. [DOI] [PMC free article] [PubMed] [Google Scholar]
- 38.Lindsey BD, Smith SW. Pitch-catch phase aberration correction of multiple isoplanatic patches for 3D transcranial ultrasound imaging. IEEE Trans Ultrason Ferroelectr Freq Control. 2013;60:463–80. doi: 10.1109/TUFFC.2013.2590. [DOI] [PMC free article] [PubMed] [Google Scholar]
- 39.Liu DD, Waag RC. Estimation and correction of ultrasonic wavefront distortion using pulse-echo data received in a two-dimensional aperture. IEEE Trans Ultrason Ferroelectr Freq Control. 1998;45:473–90. doi: 10.1109/58.660157. [DOI] [PubMed] [Google Scholar]
- 40.Rigby KW, Chalek CL, Haider BH, Lewandowski RS, O’Donnell M, Smith LS, Wildes DG. Improved in vivo abdominal image quality using real-time estimation and correction of wavefront arrival time errors. IEEE Ultrasonics Symposium; San Juan. 22–25 October 2000; pp. 1645–53. [Google Scholar]
- 41.Trahey GE, Freiburger PD, Nock LF, Sullivan DC. In vivo measurements of ultrasonic beam distortion in the breast. Ultrason Imaging. 1991;13:71–90. doi: 10.1177/016173469101300104. [DOI] [PubMed] [Google Scholar]
- 42.Zhu Q, Steinberg BD. Large-transducer measurements of wavefront distortion in the female breast. Ultrason Imaging. 1992;14:276–99. doi: 10.1177/016173469201400304. [DOI] [PubMed] [Google Scholar]
- 43.Freiburger PD, Sullivan DC, LeBlanc BH, Smith SW, Trahey GE. Two dimensional ultrasonic beam distortion in the breast: In vivo measurements and effects. Ultrason Imaging. 1992;14:398–414. doi: 10.1177/016173469201400406. [DOI] [PubMed] [Google Scholar]
- 44.Gauss R, Trahey GE, Soo MS. Wavefront estimation in the human breast. Proc SPIE. 2001:172–81. [Google Scholar]
- 45.Fernandez AT, Trahey GE. Two-dimensional phase aberration correction using an ultrasonic 1. 75D array: Case study on breast microcalcifications. IEEE Ultrasonics Symposium; Honolulu. 5–8 October; 2003. pp. 348–53. [Google Scholar]
- 46.Wang SL, Chang CH, Yang HC, Chou YH, Li PC. Performance evaluation of coherence-based adaptive imaging using clinical breast data. IEEE Trans Ultrason Ferroelectr Freq Control. 2007;54:1669–79. doi: 10.1109/tuffc.2007.438. [DOI] [PubMed] [Google Scholar]
- 47.Anderson ME, Trahey GE. The direct estimation of sound speed using pulse-echo ultrasound. J Acoust Soc Am. 1998;104:3099–106. doi: 10.1121/1.423889. [DOI] [PubMed] [Google Scholar]
- 48.Anderson ME, McKeag MS, Trahey GE. The impact of sound speed errors on medical ultrasound imaging. J Acoust Soc Am. 2000;107:3540–48. doi: 10.1121/1.429422. [DOI] [PubMed] [Google Scholar]
- 49.Krucker JF, Fowlkes JB, Carson PL. Sound speed estimation using automatic ultrasound image registration. IEEE Trans Ultrason Ferroelectr Freq Control. 2004;51:1095–106. doi: 10.1109/tuffc.2004.1334842. [DOI] [PubMed] [Google Scholar]
- 50.Byram BC, Trahey GE, Jensen JA. A method for direct localized sound speed estimates using registered virtual detectors. Ultrason Imaging. 2012;34:159–80. doi: 10.1177/0161734612455576. [DOI] [PMC free article] [PubMed] [Google Scholar]
- 51.Napolitano D, Chou CH, McLaughlin G, Ji TL, Mo L, DeBusschere D, et al. Sound speed correction in ultrasound imaging. Ultrasonics. 2006;44 (Suppl 1):e43–46. doi: 10.1016/j.ultras.2006.06.061. [DOI] [PubMed] [Google Scholar]
- 52. [accessed March 27, 2013];USA SMS Breast Imaging. [Google Scholar]
- 53.Gauthier TP, Maxwell DR. Tissue aberration correction [white paper] [accessed March 26, 2013]; [Google Scholar]
- 54.Smith SW, Pavy HG, von Ramm OT. High speed ultrasound volumetric imaging system part I: transducer design and beam steering. IEEE Trans Ultrason Ferroelectr Freq Control. 1991;38:100–108. doi: 10.1109/58.68466. [DOI] [PubMed] [Google Scholar]
- 55.Smith SW, Trahey GE, von Ramm OT. Phased array ultrasound imaging through planar tissue layers. Ultrasound Med Biol. 1986;12:229–43. doi: 10.1016/0301-5629(86)90314-5. [DOI] [PubMed] [Google Scholar]
- 56.Pichardo S, Sin VW, Hynynen K. Multi-frequency characterization of the speed of sound and attenuation coefficient for longitudinal transmission of freshly excised human skulls. Phys Med Biol. 2011;56:219–50. doi: 10.1088/0031-9155/56/1/014. [DOI] [PMC free article] [PubMed] [Google Scholar]
- 57.Fry FJ, Barger JE. Acoustic properties of the human skull. J Acoust Soc Am. 1978;63:1576–90. doi: 10.1121/1.381852. [DOI] [PubMed] [Google Scholar]
- 58.White DN, Stevenson RJ. The acoustic characteristics of the skull. Ultrasound Med Biol. 1978;4:225–52. doi: 10.1016/0301-5629(78)90054-6. [DOI] [PubMed] [Google Scholar]
- 59.Fan X, Hynynen K. The effect of wave reflection and refraction at soft tissue interfaces during ultrasound hyperthermia treatments. J Acoust Soc Am. 1992;91:1727–36. doi: 10.1121/1.402452. [DOI] [PubMed] [Google Scholar]
- 60.von Ramm OT, Smith SW, Pavy HG. High speed ultrasound volumetric imaging system part II: parallel processing and display. IEEE Trans Ultrason Ferroelectr Freq Control. 1991;38:109–15. doi: 10.1109/58.68467. [DOI] [PubMed] [Google Scholar]
- 61.Ivancevich NM, Dahl JJ, Trahey GE, Smith SW. Phase-aberration correction with a 3-D ultrasound scanner: feasibility study. IEEE Trans Ultrason Ferroelectr Freq Control. 2006;53:1432–39. doi: 10.1109/tuffc.2006.1665100. [DOI] [PubMed] [Google Scholar]
- 62.Jensen JA, Svendsen NB. Calculation of pressure fields from arbitrarily shaped, apodized, and excited ultrasound transducers. IEEE Trans Ultrason Ferroelectr Freq Control. 1992;39:262–67. doi: 10.1109/58.139123. [DOI] [PubMed] [Google Scholar]
- 63.Pinton GF, Dahl J, Rosenzweig S, Trahey GE. A heterogeneous nonlinear attenuating full-wave model of ultrasound. IEEE Trans Ultrason Ferroelectr Freq Control. 2009;56:474–88. doi: 10.1109/TUFFC.2009.1066. [DOI] [PMC free article] [PubMed] [Google Scholar]
- 64.Maciak A, Kier C, Seidel G, Meyer-Wiethe K, Hofmann UG. Detecting stripe artifacts in ultrasound images. J Digit Imaging. 2009;22:548–57. doi: 10.1007/s10278-007-9049-0. [DOI] [PMC free article] [PubMed] [Google Scholar]
- 65.Vignon F, Shi WT, Yin X, Hoelscher T, Powers JE. The stripe artifact in transcranial ultrasound imaging. J Ultrasound Med. 2010;29:1779–86. doi: 10.7863/jum.2010.29.12.1779. [DOI] [PubMed] [Google Scholar]
- 66.Clement GT, White PJ, Hynynen K. Enhanced ultrasound transmission through the human skull using shear mode conversion. J Acoust Soc Am. 2004;115:1356–64. doi: 10.1121/1.1645610. [DOI] [PubMed] [Google Scholar]
- 67.Yousefi A, Goertz DE, Hynynen K. Transcranial shear-mode ultrasound: assessment of imaging performance and excitation techniques. IEEE Trans Med Imaging. 2009;28:763–74. doi: 10.1109/TMI.2008.2012017. [DOI] [PubMed] [Google Scholar]
- 68.Furuhata H. Historical development of transcranial-color tomography. In: Bogdahn U, Becker G, Schlachetzki F, editors. Echoenhancers and Transcranial Color Duplex Sonography. Berlin: Blackwell Science; 1998. pp. 3–15. [Google Scholar]
- 69.Spieker LE, Hufschmid U, Oechslin E, Jenni R. Double aortic and pulmonary valves: an artifact generated by ultrasound refraction. J Am Soc Echocardiogr. 2004;17:786–87. doi: 10.1016/j.echo.2004.04.003. [DOI] [PubMed] [Google Scholar]
- 70.Mandelstam SA, Brockley C. Aortic duplication artefact in a 14-year-old girl. Pediatr Radiol. 2004;34:508–12. doi: 10.1007/s00247-004-1143-6. [DOI] [PubMed] [Google Scholar]


