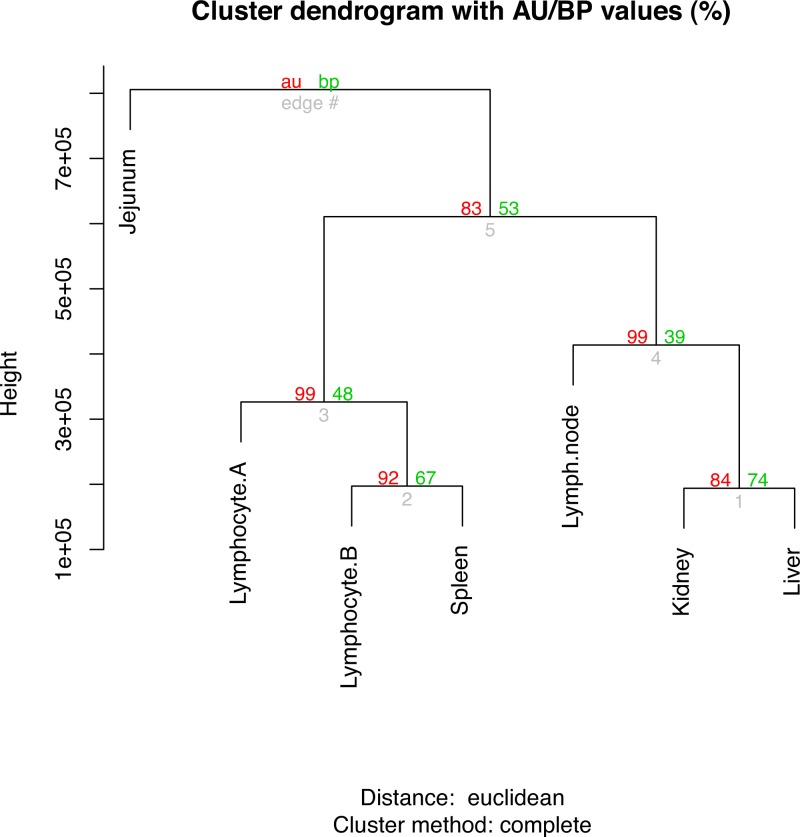
Figure 1. Hierarchical clustering of gene expression profiles in seven tissues.
The R command “hclust” was used for the hierarchical clustering analysis. The branch values are the pvclust approximately unbiased (AU) p-values (left) and bootstrap (BP) probability values (right) where the p-values are expressed as percentages.

