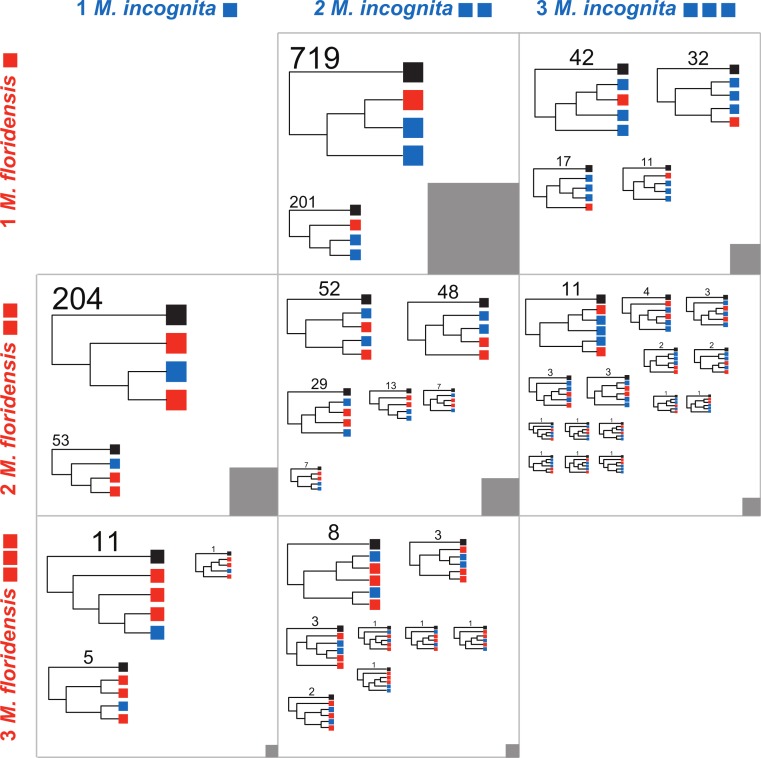
Figure 4. Phylogenomic analyses of clustered gene sets.
For cluster sets represented in Table 2 that had representation of both M. floridensis and M. incognita, more than three members (i.e., where there was more than one possible topology), and fewer than five total members (i.e., where the number of possible topologies was still reasonably low and close to the number of clusters to be analyzed), we generated an estimate of the relationships between the sequences using RAxML. The resultant trees were bootstrapped, and rooted using the M. hapla representative. For each cluster set, the topologies were summarized by the different unique patterns possible. Within each figure cell, each cladogram in the figure is scaled by the number of clusters that returned that topology, with terminal nodes coloured by the origin of the sequences (black representing M. hapla, blue M. incognita, and red M. floridensis). The number of clusters congruent with each cladogram is given above the trees. The numbers of clusters contributing to each cell in the figure is represented by the grey box, which is scaled by the number of clusters summarized (e.g., the box in the central cell represents 902 trees, while the box in the bottom left cell represents 17 trees).

