Abstract
Objective
To determine the predictors of incidence of metabolic syndrome (MetS) (Adult Treatment Panel III criteria) and to determine if longitudinal changes in specific MetS components differ by age or gender in participants who developed versus those who did not develop MetS.
Methods
A total of 506 men and 461 women (baseline age 52.4 ± 17.5 years) from the Baltimore Longitudinal Study on Aging (BLSA) were followed longitudinally (at least two study visits), and censored when they developed the MetS or reported use of antihypertensive or lipid-lowering medications.
Results
After a follow-up period of 6 years, the incidence of the MetS was 25.5% in men and 14.8% in women. As many as 66% of men and 73% of women with one or two altered MetS components at baseline did not develop the MetS. Predictors of developing MetS were higher baseline abdominal obesity or triglycerides and lower high-density lipoprotein cholesterol (area under receiver-operated curve [AUC] = 0.84 in men, 0.88 in women). Addition of the rate of changes in MetS components over time slightly improved predictive accuracy (AUC = 0.94 in men, 0.92 in women). Men were more likely than women to have the MetS without obesity, whereas women were more likely than men to have the MetS without an altered glucose metabolism.
Conclusions
The patterns of MetS components and the longitudinal changes that lead to the MetS are different in men and women. Interestingly, components with the highest prevalence prior to MetS development, such as elevated blood pressure, are not necessarily the stronger risk factors.
Keywords: Metabolic syndrome, Incidence, Longitudinal studies, Abdominal obesity
THE term “metabolic syndrome” (MetS) refers to the clustering of visceral adiposity, hyperglycemia, high blood pressure (BP), and dyslipidemia (1,2) associated with increased risk of cardiovascular (CV) disease. Paralleling the alarming increase in obesity (3), the prevalence of the MetS has reached epidemic proportions (4), and it is feared that it will translate into an excess of diabetes, CV morbidity, and mortality (3,5,6). Few studies, however, have prospectively examined the process that leads to MetS development in a given cohort. In particular, whether changes in specific MetS components over time are factors for the syndrome development and whether these factors or changes in factors have a similar effect in men and women is unknown.
In this study we (a) describe the incidence of MetS and the longitudinal changes of MetS components in men and women prior to the development of MetS, (b) evaluate the hypothesis that MetS components differ by gender or age, and (c) determine whether baseline levels or change over time in specific MetS components are significant predictors of incidence of MetS.
METHODS
Study Population
The Baltimore Longitudinal Study of Aging (BLSA) is a prospective study of community-dwelling, healthy volunteers conducted by the National Institute on Aging since 1958. Participants returned to the National Institute on Aging Clinical Unit in Baltimore, Maryland, at regular intervals for 2–3 days of medical, physiological, and psychological examinations (7).
Variables Measured
Blood pressure.—
BP determinations were performed in the morning, after a light breakfast, with participants in the seated position, and following a 5-minute resting, according to a standard protocol (8). BP was measured three times in both arms with a mercury sphygmomanometer, and the average of the second and third measurements on both the right and the left arms is used in the analysis.
Anthropometry.—
Height and weight were objectively measured, and body mass index was calculated as body weight (kg)/height (m)2. Waist circumference was measured at each visit with an inelastic tape at the narrowest part of the torso at the end of expiration.
Fasting plasma lipids and glucose.—
Blood samples were drawn from the antecubital vein between 7 and 8 am after an overnight fast. Plasma triglycerides and total cholesterol levels were determined by an enzymatic method (ABA-200 ATC Biochromatic Analyzer; Abott Laboratories, Irving, TX). High-density lipoprotein (HDL) cholesterol was measured by a dextran sulfate–magnesium precipitation procedure. Low-density lipoprotein (LDL) cholesterol was estimated by the Friedewald formula for those participants with triglycerides not greater than 400 mg/dL. Fasting plasma glucose was measured by the glucose oxidase method (Beckman Instruments Inc., Fullerton, CA).
Definition of MetS
The Third Report of the National Cholesterol Education Program (NCEP) Expert Panel on Detection, Evaluation, and Treatment of High Blood Cholesterol in Adults (Adult Treatment Panel [ATP] III) (1) defined MetS in men and women as an alteration in three or more of the following five components: abdominal obesity (waist circumference >102 cm for men or >88 cm for women), BP (systolic BP [SBP] ≥130 mmHg or diastolic BP [DBP] ≥80 mmHg), fasting glucose (≥110 mg/dL), triglycerides (≥150 mg/dL), and HDL-cholesterol (<40 mg/dL for men or <50 mg/dL for women). Participants who developed three or more alterations at some visit were classified as having MetS and all following visits were censored. Participants who maintained no alterations at all visits were classified in the Met0 group. The remaining participants, who had at least one visit with one or two alterations, were classified into the Met12 group. The rate of change of each component of MetS was calculated as the difference between the values at last and first visits, divided by the follow-up time.
Of the 911 male and 794 female participants with complete data on all MetS components, 153 (101 men and 52 women) were excluded because they had prevalent MetS at baseline; 314 (131 men and 183 women) participants were excluded because they had a single visit with no follow-up. Thus, 506 men (853 visits) and 461 women (1,638 visits) were followed longitudinally, and censored when they developed MetS or reported use of antihypertensive or lipid-lowering medications.
Hypertension was a common condition and elevated BP was the most commonly altered component. By censoring hypertensives at the time of reported use of antihypertensive medications, we did not alter the “natural history” of BP changes over time in a design using repeated measurements, nor did we bias the estimate of the predictive role of BP for MetS development. Similarly, statins are known to reduce LDL-cholesterol—not a component of the MetS. However, as remarked by recent literature, statins also have an effect on HDL-cholesterol levels—although to a lesser extent than on LDL-cholesterol (8). With respect to diabetes mellitus (DM), two analyses were performed: one censoring individuals at the time of diagnosis of DM or use of DM medications and the other not censoring for DM or DM medications.
Statistical analysis
All analyses were performed using the SAS package (8.1 version; SAS Institute, Cary, NC). Data are presented as mean ± SD unless otherwise specified. Mean values among the three groups were compared by analysis of variance, followed by Bonferroni's test for multiple comparisons.
Linear mixed-effects (9,10) regression models were used to analyze the change over time in each component of MetS across the three classification groups. Linear mixed models are particularly appropriate for handling complex longitudinal data with unequally spaced follow-ups and multiple missing data (11) and have been used extensively to analyze BLSA data. Estimates are obtained of both the cross-sectional differences between various ages and the longitudinal changes over time.
Multiple logistic regression analyses with backward elimination were used to estimate the odds ratio for developing MetS. The models included age, baseline levels, and observed rates of change (calculated as the difference between first and last visits divided by follow-up time) in the levels of each component of MetS as independent variables. Receiver-operating characteristic (ROC) curves were calculated for each model. The area under the ROC curve (AUC) is a measure of how well a model is able to predict the outcome of interest, with an AUC value equal to 0.50 indicating no accuracy and an AUC value equal to 1.00 indicating maximal accuracy.
RESULTS
Incidence of MetS
The study population consisted of 967 participants (506 men and 461 women, aged 52.4 ± 17.5 years, range 17.6–91.2 years) without MetS at baseline. At study entry, 194 (38.3%) men and 195 (42.3%) women had no alteration in any of the components of MetS; 312 (61.7%) men and 266 (57.7%) women had one or two altered MetS components (see Table 1). Each participant had at least two study visits. Only 31.0% of the participants had two observations, and the average number of study visits was similar in men and women.
Table 1.
Demographics and MetS Components of Participants at Study Entry by Their Status at Last Visit
| Met0 (1) | Met12 (2) | MetMS (3) | p Value | Post-hoc | |
| Men | n = 39 | n = 338 | n = 129 | ||
| Age (years) | 46.4 ± 19.2 | 54.2 ± 18.5 | 53.9 ± 14.6 | .0331 | 1 < 2 |
| Follow-up time (years) | 6.2 ± 3.4 | 7.2 ± 3.5 | 4.9 ± 2.8 | <.0001 | 3 < 2 |
| Number of study visits | 3.4 ± 1.6 | 3.9 ± 1.6 | 3.0 ± 1.1 | <.0001 | 3 < 2 |
| BMI (kg/m2) | 23.1 ± 2.2 | 24.4 ± 2.6 | 26.9 ± 2.8 | <.0001 | 1 < 2 < 3 |
| Waist circumference (cm) | 82.8 ± 6.7 | 87.1 ± 8.1 | 94.6 ± 8.0 | <.0001 | 1 < 2 < 3 |
| Fasting glucose (mg/dL) | 94.3 ± 6.5 | 97.3 ± 18.3 | 102.8 ± 23.2 | .0074 | 1, 2 < 3 |
| HDL-cholesterol (mg/dL) | 52.9 ± 8.5 | 45.2 ± 10.9 | 38.0 ± 8.9 | <.0001 | 3 < 2 < 1 |
| Triglycerides (mg/dL) | 69.7 ± 29.5 | 93.4 ± 48.9 | 138.2 ± 91.9 | <.0001 | 1, 2 < 3 |
| Systolic BP (mmHg) | 113.3 ± 10.6 | 122.0 ± 16.9 | 124.3 ± 14.4 | .0009 | 1 < 2, 3 |
| Diastolic BP (mmHg) | 72.7 ± 8.8 | 77.5 ± 9.2 | 79.3 ± 8.3 | .0003 | 1 < 2, 3 |
| LDL-cholesterol (mg/dL) | 110.9 ± 26.8 | 119.8 ± 31.5 | 121.0 ± 33.0 | .2109 | |
| Women | n = 63 | n = 330 | n = 68 | ||
| Age (years) | 48.7 ± 16.7 | 50.9 ± 17.6 | 55.5 ± 14.2 | .0552 | |
| Follow-up time (years) | 5.1 ± 3.1 | 6.5 ± 3.5 | 5.4 ± 3.0 | .0023 | 2 < 1, 3 |
| Number of study visits | 3.0 ± 1.2 | 3.7 ± 1.6 | 3.2 ± 1.2 | .0004 | 1, 3 < 2 |
| BMI (kg/m2) | 21.9 ± 2.4 | 23.4 ± 3.4 | 26.8 ± 3.8 | <.0001 | 1 < 2 < 3 |
| Waist circumference (cm) | 69.4 ± 5.6 | 74.0 ± 8.1 | 82.3 ± 7.1 | <.0001 | 1 < 2 < 3 |
| Fasting glucose (mg/dL) | 91.2 ± 7.5 | 93.0 ± 16.1 | 94.2 ± 6.6 | .4640 | |
| HDL-cholesterol (mg/dL) | 63.4 ± 9.3 | 54.4 ± 13.3 | 46.1 ± 9.8 | <.0001 | 3 < 2 < 1 |
| Triglycerides (mg/dL) | 60.4 ± 25.4 | 76.7 ± 38.0 | 113.2 ± 51.3 | <.0001 | 1 < 2 < 3 |
| Systolic BP (mmHg) | 110.2 ± 10.6 | 118.2 ± 16.9 | 121.9 ± 18.8 | .0002 | 1 < 2, 3 |
| Diastolic BP (mmHg) | 71.3 ± 6.8 | 74.5 ± 10.2 | 75.6 ± 9.4 | .0226 | 1 < 2, 3 |
| LDL-cholesterol (mg/dL) | 105.0 ± 36.7 | 111.6 ± 35.1 | 125.6 ± 33.1 | .0020 | 1, 2 < 3 |
Note: BP = blood pressure; BMI = body mass index; HDL = high-density lipoprotein; LDL = low-density lipoprotein; MetS = metabolic syndrome.
After an average follow-up time of 6.5 ± 3.5 years (maximum 14.0 years), the prevalence of elevated BP rose from 27% to 55.7%, low HDL-cholesterol from 35% to 46%, abdominal obesity from 6.1% to 18.4%, elevated triglycerides from 13% to 19.1%, and elevated fasting glucose levels from 6.6% to 16.6% in male participants. In parallel, the prevalence of elevated BP rose from 21% to 41.9%, low HDL-cholesterol from 20.2% to 40.1%, abdominal obesity from 7.7% to 23.0%, elevated triglycerides from 6.2% to 12.1%, and elevated fasting glucose levels from 1.3% to 5.0% in female participants.
During the follow-up considered in this study, 39 men (7.7%) and 63 women (13.7%) remained free of any alteration in any of the components of MetS (Met0), 338 men (66.8%) and 330 women (71.6%) presented alterations in one or two components of MetS (Met12), and 129 men (25.5%) and 68 women (14.8%) developed alterations in three or more components of MetS (MetMS) (i.e., met the NCEP ATP III criteria for MetS). Of note, 207 (66.3%) of men and 211 (79.3%) of women who had one or two altered components of MetS at study entry did not develop MetS.
Longitudinal Changes in the Components of MetS in Participants With or Without Incident MetS
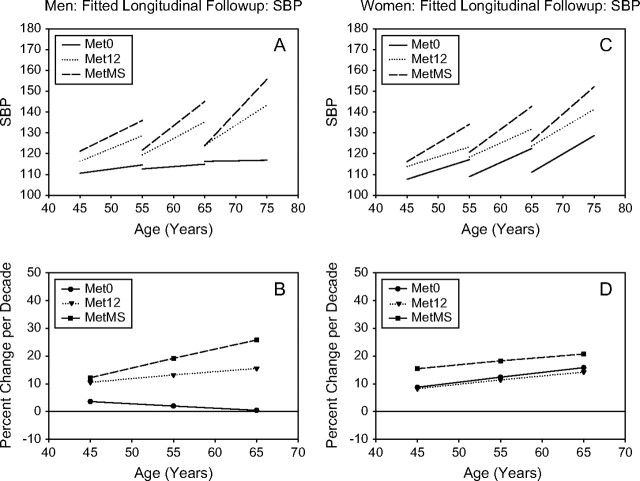
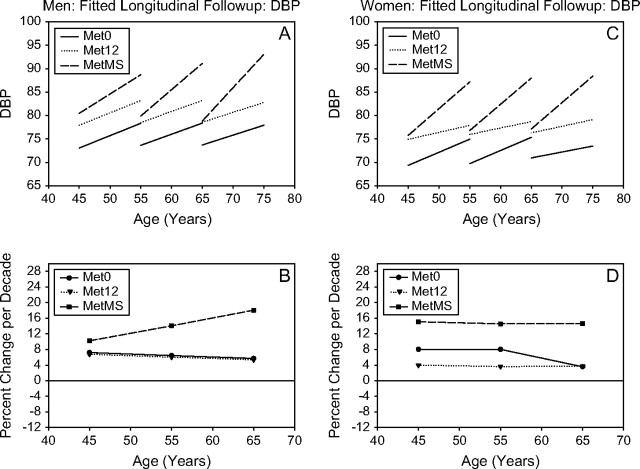
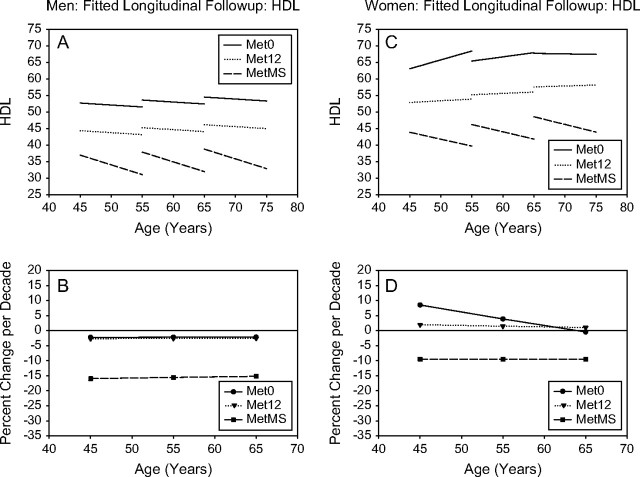
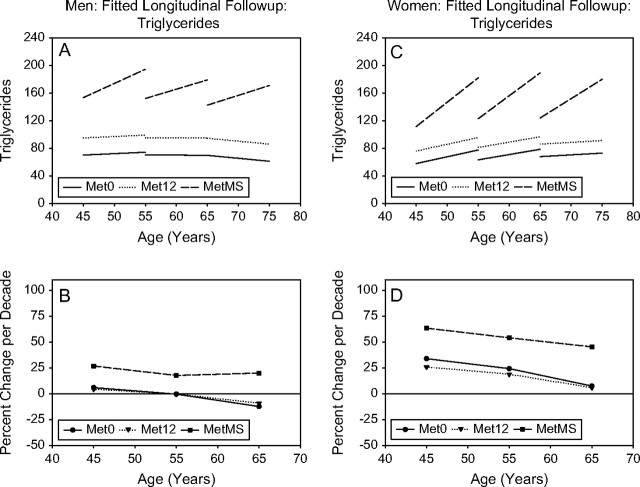
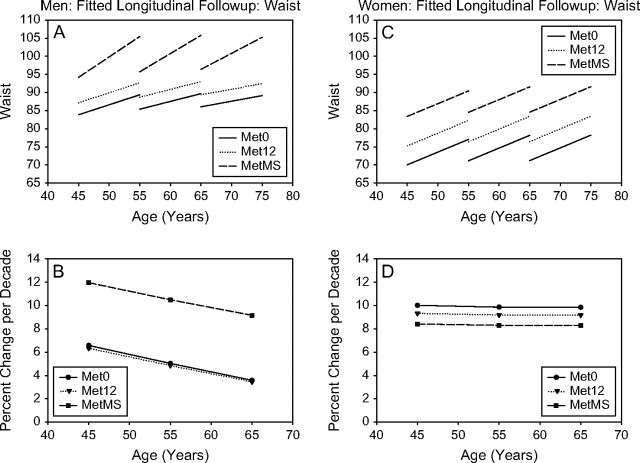
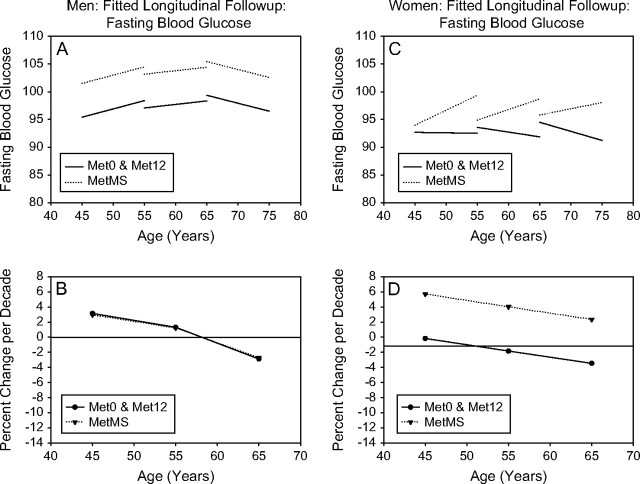
The longitudinal changes in the components of MetS were analyzed with linear mixed-effects models. The outputs of linear mixed-effects models are complex equations. The results are summarized graphically in Figures 1–6 to illustrate both predicted values for each component of MetS (top panel) and the mean percentage change per decade for different ages (bottom panel).
Figure 1.
SBP. Mixed-effects predicted lines representing the average changes over time in metabolic syndrome (MetS) components in men and women, for three starting ages (45, 55, and 65 years) for the Met0, Met12, and MetMS groups (top panels). The predicted average percentage changes for these components, for the same three starting ages, and for a follow-up time of 10 years are shown in the bottom panels. Average predicted changes are expressed as percentages to account for baseline differences in the MetS components among the three study groups.
Figure 2.
DBP. Mixed-effects predicted lines representing the average changes over time in metabolic syndrome (MetS) components in men (A) and women (C), for three starting ages (45, 55, and 65 years) for the Met0, Met12, and MetMS groups (top panels). The predicted average percentage changes for these components, for the same three starting ages, and for a follow-up time of 10 years are shown in the bottom panels ([B] for men and for women, respectively). Average predicted changes are expressed as percentages to account for baseline differences in the MetS components among the three study groups.
Figure 3.
HDL. Mixed-effects predicted lines representing the average changes over time in metabolic syndrome (MetS) components in men (A) and women (C), for three starting ages (45, 55, and 65 years) for the Met0, Met12, and MetMS groups (top panels). The predicted average percentage changes for these components, for the same three starting ages, and for a follow-up time of 10 years are shown in the bottom panels ([B] for men and for women, respectively). Average predicted changes are expressed as percentages to account for baseline differences in the MetS components among the three study groups.
Figure 4.
Triglycerides. Mixed-effects predicted lines representing the average changes over time in metabolic syndrome (MetS) components in men (A) and women (C), for three starting ages (45, 55, and 65 years) for the Met0, Met12, and MetMS groups (top panels). The predicted average percentage changes for these components, for the same three starting ages, and for a follow-up time of 10 years are shown in the bottom panels ([B] for men and for women, respectively). Average predicted changes are expressed as percentages to account for baseline differences in the MetS components among the three study groups.
Figure 5.
Waist. Mixed-effects predicted lines representing the average changes over time in metabolic syndrome (MetS) components in men (A) and women (C), for three starting ages (45, 55, and 65 years) for the Met0, Met12, and MetMS groups (top panels). The predicted average percentage changes for these components, for the same three starting ages, and for a follow-up time of 10 years are shown in the bottom panels ([B] for men and for women, respectively). Average predicted changes are expressed as percentages to account for baseline differences in the MetS components among the three study groups.
Figure 6.
Fasting Blood Glucose. Mixed-effects predicted lines representing the average changes over time in metabolic syndrome (MetS) components in men (A) and women (C), for three starting ages (45, 55, and 65 years) for the Met0, Met12, and MetMS groups (top panels). The predicted average percentage changes for these components, for the same three starting ages, and for a follow-up time of 10 years are shown in the bottom panels ([B] for men and for women, respectively). Average predicted changes are expressed as percentages to account for baseline differences in the MetS components among the three study groups.
A high correlation between observed values of the MetS components over time and those predicted by longitudinal mixed models (correlation coefficient ranged from .72 for fasting glucose in women to .97 for waist circumference in men) suggests that the mixed-effects model adequately fits the data.
Longitudinal changes in BP.—
In both men and women, Met12 and MetMS, at any starting age, had similar starting SBP and DBP values, which were higher than those observed in Met0 (Figures 1 and 2). However, MetMS participants also showed a higher rate of increase in SBP over time than Met0 participants and higher rate of increase in DBP than Met12 or Met0 participants at any age. For DBP, the increase over time was more robust in MetMS women, whereas SBP was substantially stable over time in Met0 men.
Longitudinal changes in HDL-cholesterol.—
In both men and women (Figure 3), lower HDL-cholesterol at baseline was observed from Met0 to Met12 to MetMS. MetMS participants showed a steeper decrease in HDL-cholesterol over time than Met12 or Met0 participants at any age. In fact, HDL declines from the starting levels only in MetS participants. Of note, Met0 participants presented virtually no change in HDL-cholesterol levels over time.
Longitudinal changes in triglycerides.—
In both men and women, higher triglycerides at baseline were observed from Met0 to Met12 to MetMS. MetMS participants showed a steeper increase in triglycerides over time than Met12 or Met0 participants, whose levels remained stable over time at any age, in both genders (Figure 4).
Longitudinal changes in waist circumference.—
In both men and women, larger waist circumference at baseline was observed from Met0 to Met12 to MetMS. MetMS men showed a steeper rate of increase in waist circumference over time than Met12 or Met0 men at any age; this was not observed in women at any age (Figure 5B).
Longitudinal changes in fasting plasma glucose.—
MetMS men showed higher glucose levels at baseline than Met0 or Met12 men. However, in contrast to younger groups in whom glucose levels increased over time, glucose levels for participants older than 65 years decreased over time. This likely reflects the higher incidence of DM in the oldest group, who would be prescribed glucose-lowering medications (Figure 6A).
In women, glucose levels were higher in MetMS compared with Met0 and Met12 groups, although these differences did not reach statistical significance. MetMS showed a greater increase in fasting glucose over time than Met12 and Met0, such that the difference in end values between MetMS and Met0 or Met12 was greater than that at the initial observation (Figure 6B). This trend was observed in all three age groups.
Distribution of Altered Components of the MetS at Baseline and at Last Visit
Among participants who developed MetS, at the time when the syndrome first appeared, men were more likely to have glucose alteration than women (45.7% vs 19.1%, p < .001), whereas women were more likely to have waist alteration than men (67.6% vs 49.6%, p < .05).
Predicting the Development of MetS
To predict the development of MetS, participants were classified as developing MetS (MetMS group) or not developing MetS (Met0 and Met12 groups combined).
We expected that given some initial values, changes in the MetS components would be different between participants in the MetMS group and those who did not develop MetS. Thus, individuals who end up with the MetS are discriminated by their baseline values and rate of change in the MetS values.
To examine how baseline values of specific MetS components and their rates of change predict the incidence of MetS, we fitted three parsimonious logistic regression models: the first model only included baseline values of individual MetS components, the second model only observed rates of change; and the third model included both baseline values of MetS components and their observed rates of change.
Baseline waist circumference (per 5 cm increase: relative risk [RR] 1.70, 95% confidence interval [CI] 1.47–1.97 in men; RR 1.85, 95% CI 1.52–2.24 in women), triglyceride (per 10 mg/dL increase: RR 1.08, 95% CI 1.03–1.14 in men; RR 1.15, 95% CI 1.08–1.23 in women), and HDL-cholesterol (per 10 mg/dL increase: RR 0.54, 95% CI 0.40–0.71 in men; RR 0.49, 95% CI 0.36–0.66 in women) were independent predictors of the development of MetS. Interestingly, neither baseline SBP nor DBP remained in the model as predictors of MetS. When the initial values of MetS components and their observed rates of change were included in the model, there was a mild improvement in accuracy compared with the model with baseline values only (AUC = 0.94 vs 0.84 for men and 0.92 vs 0.88 for women).
The “predictive” components in the logistic models were not the most prevalent in participants developing MetS, nor showed the higher percentage increase from baseline to the time of development of MetS. For instance, elevated BP, which was not an independent predictor, was the most prevalent MetS baseline component (>80% in participants developing MetS) and increased three- to fourfold in prevalence from baseline to the time of MetS. Analogously, altered glucose levels showed the highest increase in frequency from baseline to follow-up (approximately 5-fold in men and 12-fold in women). The baseline prevalence of low HDL-cholesterol was similar to high BP and increased only 1.5-fold in both genders but was a significant predictor of the development of MetS. Waist circumference, the strongest predictor of new-onset MetS, showed a similar increase over time as elevated BP but was altered in only half of new-onset cases of MetS.
DISCUSSION
In this report, we describe the natural history of MetS by analyzing longitudinal changes in MetS components. The incidence of MetS was 25.5% in men and 14.8% in women after an average follow-up of 6 years. In comparison, the Insulin Resistance Atherosclerosis Study reported an incidence of 17.1% in men and 20.9% in women after a follow-up period of 5 years (12). The enrolment of Hispanic women, who tend to be at particularly high risk of the MetS, and who comprised approximately 30% of the IRAS study population, might explain the higher incidence rate in women compared with our study (3,13). The San Antonio Heart Study showed a 15% incidence of MetS in men and a 17% in women after 8 years of follow-up (14). Although this large cohort also included many Hispanic participants, the threshold values used to define the MetS criteria were higher than those indicated by ATP III for lipids (triglycerides ≥200 mg/dL, HDL-cholesterol <35 mg/dL in men and <45 mg/dL in women), glucose (diabetic patients), and BP (BP ≥140/90 mmHg for systolic and diastolic, respectively).
The novel effort of the present study was predicting development of MetS in a community-living population. We found that baseline levels of waist circumference, HDL-cholesterol, and triglycerides were able to predict the development of MetS over time with considerable discriminatory power (c statistics = .84 for men and .88 for women) and that the addition of rate of changes of individual components of MetS only slightly improved the accuracy of the model. Interestingly, participants who subsequently developed MetS had greater abdominal obesity, higher triglycerides, and lower HDL-cholesterol than those who did not develop the MetS in both men and women. The IRAS Study investigators found that waist circumference, lower HDL, and proinsulin were associated with a significantly higher risk of MetS, even after controlling for glucose tolerance (12). Additionally, consistent with our findings, they identified waist circumference as the optimal predictor of MetS, with the most discriminating cut point at 102 cm in men and 88 cm in women (12). Other longitudinal studies documented the pivotal role of obesity in the pathogenesis of MetS in different populations, although the definition of MetS adopted varied from study to study (14–17).
That waist circumference is a strong predictor of the incidence of MetS in both men and women but that an altered waist component was not the most commonly altered component in participants who developed the MetS suggests that when conditions characterized by malnourishment and cachexia are excluded, the MetS burden of visceral adiposity is not only above a certain waist size threshold value is also a continuous function of waist circumference.
A second relevant finding of the present study was that the most frequently altered component, for example, elevated BP, was not a significant predictor of the risk for developing MetS, although MetMS participants showed a higher rate of increase in SBP or DBP over time as compared with participants not developing MetS, and this was observed in all three age groups. In fact, this sort of “dissociation” may affect the decision-making process in a clinical setting tailored for preventing MetS and CV events.
The lack of correlation between incident MetS and elevated BP at baseline in our study cohort is not completely surprising. Hypertension is the most controversial component of MetS (18). The high prevalence of elevated BP in the general population likely explains the frequent occurrence of elevated BP as an “isolated” component of MetS. Of note, many studies suggest that abdominal adiposity is a stronger predictor of high BP than total obesity (19–24) and that the relationship between adiposity and higher BP is linear and is evident even in the nonobese range (25). Thus, even small increases in waist circumference (below the threshold used in the NCEP criteria) significantly increase the risk for developing hypertension (20,26,27), which may help explain our finding that the prevalence of high BP was greater than the prevalence of high waist circumference. In this regard, it is noteworthy that SBP did not change with age in men who remained free of any of the other four MetS component risk factors.
A notable, and perhaps unexpected, finding was that a large number of men and women with baseline alterations in one or two MetS components did not develop MetS (40.9% of men and 45.8% of women). This observation is new and should influence prevention strategies aimed to reduce the burden of CV disease and diabetes. In fact, our findings indicate that many participants appearing at higher risk for developing MetS do not actually develop it. A possible explanation is that these participants may adjust their habits toward healthier lifestyles, such as increasing physical activity or changing diet, or both. The quest for a clinical marker has to deal with accuracy and discriminatory power of the marker but also with its costs and its practical adoption in clinical setting. In this context, measurement of waist circumference has been suggested as a key factor to monitor the progression toward MetS and may help to identify specific subjects who could be targeted for intensive CV prevention (28). In fact, our study showed that every 5-cm increase in waist circumference is associated with a 70% higher risk for developing MetS over time. Nonetheless, although waist measurement is easy and not time consuming, waist is not routinely measured in clinical practice (29).
The present study has some limitations. The first is that the sample studied was predominantly Caucasian so that no conclusion can be inferred for the general population. An additional limitation of the present study is that we cannot ascertain whether participants developing MetS during the follow-up were already in a trajectory of change different from those who did not develop MetS. However, we investigated both baseline levels and rates of change in MetS components and this allowed to account both for the individual’s distance on his or her “hypothetical” trajectory and for the slope and the rapidity of the change in the trajectory. Certainly, we assumed linearity of change in MetS components over time, and this itself may represent a limitation. An additional limitation is represented by the lack of information on the effects of medications (lipids or glucose lowering, antihypertensive) on the trajectory of metabolic syndrome components.
In conclusion, in the BLSA cohort the incidence of MetS was 25.5% in men and 14.8% in women after an average follow-up of 6 years. At baseline, participants who subsequently developed MetS had greater abdominal obesity, higher levels of triglycerides, and lower levels of HDL-cholesterol than the two other groups in both men and women. Predictive factors were not necessarily the most commonly altered components of MetS.
References
- 1.Executive Summary of The Third Report of The National Cholesterol Education Program (NCEP) Expert Panel on Detection, Evaluation, And Treatment of High Blood Cholesterol In Adults (Adult Treatment Panel III) Expert Panel on Detection, Evaluation, and Treatment of High Blood Cholesterol in Adults. JAMA. 2001;285:2486–97. doi: 10.1001/jama.285.19.2486. [DOI] [PubMed] [Google Scholar]
- 2.Meigs JB, D'Agostino RB, Sr, Wilson PW, Cupples LA, Nathan DM, Singer DE. Risk variable clustering in the insulin resistance syndrome. The Framingham Offspring Study. Diabetes. 1997;46:1594–1600. doi: 10.2337/diacare.46.10.1594. [DOI] [PubMed] [Google Scholar]
- 3.Ford ES, Giles WH, Dietz WH. Prevalence of the metabolic syndrome among US adults: findings from the third National Health and Nutrition Examination Survey. JAMA. 2002;287:356–359. doi: 10.1001/jama.287.3.356. [DOI] [PubMed] [Google Scholar]
- 4.Scuteri A, Najjar SS, Muller DC, et al. Metabolic syndrome amplifies the age-associated increases in vascular thickness and stiffness. J Am Coll Cardiol. 2004;43:1388–1395. doi: 10.1016/j.jacc.2003.10.061. [DOI] [PubMed] [Google Scholar]
- 5.Scuteri A, Najjar SS, Morrell CH, Lakatta EG. The metabolic syndrome in older individuals: prevalence and prediction of cardiovascular events: the Cardiovascular Health Study. Diabetes Care. 2005;28:882–887. doi: 10.2337/diacare.28.4.882. [DOI] [PubMed] [Google Scholar]
- 6.Ford ES, Li C, Sattar N. Metabolic syndrome and incident diabetes: current state of the evidence. Diabetes Care. 2008;31:1898–1904. doi: 10.2337/dc08-0423. [DOI] [PMC free article] [PubMed] [Google Scholar]
- 7.Shock NW, Greulich RC, Andres RA, et al. Normal Human Aging: The Baltimore Longitudinal Study of Aging NIH. Washington, DC: U.S. Government Printing Office; 1984. Publication no. 84-2450. [Google Scholar]
- 8.Nicholls SJ, Tuzcu EM, Sipahi I, et al. Statins, high-density lipoprotein cholesterol, and regression of coronary atherosclerosis. JAMA. 2007;297:499–508. doi: 10.1001/jama.297.5.499. [DOI] [PubMed] [Google Scholar]
- 9.Brant LJ, Pearson JD. Modeling the variability in longitudinal patterns of aging. In: Crews DE, Garruto RM, editors. Biological Anthropology and Aging: Perspective on Human Variation Over the Life Span. New York, NY: Oxford University Press; 1994. pp. 373–393. [Google Scholar]
- 10.Morrell CH, Brant LJ. Linear transformation of linear mixed-effects models. Am Statistician. 1997;51:338–343. [Google Scholar]
- 11.Scuteri A, Bos AJG, Brant LJ, Talbot L, Lakatta EG, Fleg JL. Hormone replacement therapy and longitudinal changes in blood pressure in postmenopausal women. Ann Intern Med. 2001;135:229–238. doi: 10.7326/0003-4819-135-4-200108210-00007. [DOI] [PubMed] [Google Scholar]
- 12.Palaniappan L, Carnethon MR, Wang Y, et al. Predictors of the incident metabolic syndrome in adults. The Insulin Resistance Atherosclerosis Study. Diabetes Care. 2004;27:788–793. doi: 10.2337/diacare.27.3.788. [DOI] [PubMed] [Google Scholar]
- 13.Lorenzo C, Serrano-Rios M, Martinez-Larrad MT, et al. Geographic variations of the International Diabetes Federation and the National Cholesterol Education Program-Adult Treatment Panel III definitions of the metabolic syndrome in nondiabetic subjects. Diabetes Care. 2006;29:685–691. doi: 10.2337/diacare.29.03.06.dc05-1796. [DOI] [PubMed] [Google Scholar]
- 14.Han TS, Williams K, Sattar N, Hunt KJ, Lean ME, Haffner SM. Analysis of obesity and hyperinsulinemia in the development of metabolic syndrome: San Antonio Heart Study. Obes Res. 2002;10:923–931. doi: 10.1038/oby.2002.126. [DOI] [PubMed] [Google Scholar]
- 15.Srinivasan SR, Myers L, Berenson GS. Predictability of childhood adiposity and insulin for developing insulin resistance syndrome (Syndrome X) in young adulthood. The Bogalusa Heart Study. Diabetes. 2002;51:204–209. doi: 10.2337/diabetes.51.1.204. [DOI] [PubMed] [Google Scholar]
- 16.Maison P, Byrne CD, Hales CN, Day NE, Wareham NJ. Do different dimensions of the metabolic syndrome change together over time? Diabetes Care. 2001;24:1758–1763. doi: 10.2337/diacare.24.10.1758. [DOI] [PubMed] [Google Scholar]
- 17.Liese AD, Mayer-Davis EJ, Tyroler HA, et al. Development of the multiple metabolic syndrome in the ARIC cohort: joint contribution of insulin, BMI and WHR. Atherosclerosis Risk in communities. Ann Epidemiol. 1997;7:407–416. doi: 10.1016/s1047-2797(97)00047-1. [DOI] [PubMed] [Google Scholar]
- 18.Haffner SM. Insulin and blood pressure: fact or fantasy? J Clin Endocrinol Metab. 1993;76:541–543. doi: 10.1210/jcem.76.3.8445008. [DOI] [PubMed] [Google Scholar]
- 19.Doll S, Paccaud F, Bovet P, Burnier M, Wietlisbach V. Body mass index, abdominal adiposity and blood pressure: consistency of their association across developing and developed countries. Int J Obes Relat Metab Disord. 2002;26:48–57. doi: 10.1038/sj.ijo.0801854. [DOI] [PubMed] [Google Scholar]
- 20.Dyer AR, Liu K, Walsh M, Kiefe C, Jacobs DR, Jr, Bild DE. Ten-year incidence of elevated blood pressure and its predictors: the CARDIA study. Coronary Artery Risk Development in (Young) Adults. J Hum Hypertens. 1999;13:13–21. doi: 10.1038/sj.jhh.1000740. [DOI] [PubMed] [Google Scholar]
- 21.Guagnano MT, Ballone E, Colagrande V, et al. Large waist circumference and risk of hypertension. Int J Obes Relat Metab Disord. 2001;25:1360–1364. doi: 10.1038/sj.ijo.0801722. [DOI] [PubMed] [Google Scholar]
- 22.Kanai H, Matsuzawa Y, Kotani K, et al. Close correlation of intra-abdominal fat accumulation to hypertension in obese women. Hypertension. 1990;16:484–490. doi: 10.1161/01.hyp.16.5.484. [DOI] [PubMed] [Google Scholar]
- 23.Siani A, Cappuccio FP, Barba G, et al. The relationship of waist circumference to blood pressure: the Olivetti Heart Study. Am J Hypertens. 2002;15:780–786. doi: 10.1016/s0895-7061(02)02976-x. [DOI] [PubMed] [Google Scholar]
- 24.Zhu S, Wang Z, Heshka S, Heo M, Faith MS, Heymsfield SB. Waist circumference and obesity-associated risk factors among whites in the third National Health and Nutrition Examination Survey: clinical action thresholds. Am J Clin Nutr. 2002;76:743–749. doi: 10.1093/ajcn/76.4.743. [DOI] [PubMed] [Google Scholar]
- 25.Jones DW, Kim JS, Andrew ME, Kim SJ, Hong YP. Body mass index and blood pressure in Korean men and women: the Korean National Blood Pressure Survey. J Hypertens. 1994;12:1433–1437. doi: 10.1097/00004872-199412000-00018. [DOI] [PubMed] [Google Scholar]
- 26.Huang Z, Willett WC, Manson JE, et al. Body weight, weight change, and risk for hypertension in women. Ann Intern Med. 1998;128:81–88. doi: 10.7326/0003-4819-128-2-199801150-00001. [DOI] [PubMed] [Google Scholar]
- 27.Juhaeri SJ, Chambless LE, Tyroler HA, et al. Associations between weight gain and incident hypertension in a bi-ethnic cohort: the Atherosclerosis Risk in Communities Study. Int J Obes Relat Metab Disord. 2002;26:58–64. doi: 10.1038/sj.ijo.0801846. [DOI] [PubMed] [Google Scholar]
- 28.Schwarz PE, Reimann M, Li J, et al. The metabolic syndrome—a global challenge for prevention. Horm Metab Res. 2007;39:777–780. doi: 10.1055/s-2007-990312. [DOI] [PubMed] [Google Scholar]
- 29.Klein S, Allison DB, Heymsfield SB, et al. Association for Weight Management and Obesity Prevention; NAASO; Obesity Society; American Society for Nutrition; American Diabetes Association. Waist circumference and cardiometabolic risk: a consensus statement from shaping America's health: Association for Weight Management and Obesity Prevention; NAASO, The Obesity Society; the American Society for Nutrition; and the American Diabetes Association. Diabetes Care. 2007;30:1647–1652. doi: 10.2337/dc07-9921. [DOI] [PubMed] [Google Scholar]


