

Abstract
Cytochrome P450 1B1 (CYP1B1) is involved in the metabolism of xenobiotic compounds and endogenous metabolites. Disruption of Cyp1b1 in mice results in suppression of high-fat diet (HFD)-induced obesity and an extensive change in hepatic energy regulation despite minimal constitutive expression of CYP1B1 in hepatocytes. Lack of CYP1B1 is correlated with altered lipid metabolism, especially lysophosphatidylcholines, contributing to protection against obesity. Ultraperformance liquid chromatography coupled to electrospray ionization quadrupole mass spectrometry (UPLC-ESI-QTOFMS)-based metabolomics revealed lysophosphatidylcholine 18:0 (LPC 18:0) as a biomarker positively related to HFD-induced obesity. The increased serum LPC 18:0 in wild-type mice is reduced in Cyp1b1-null mice on a HFD, which is reversed in CYP1B1-humanized mice. CYP1B1-humanized mice show higher diet-induced obesity compared with Cyp1b1-null mice, suggesting that human CYP1B1 shows a similar response to HFD as mouse Cyp1b1. In addition, hepatic stearoyl-CoA desaturase 1 (SCD1) expression was decreased in Cyp1b1-null mice, and the attenuated diet-induced obesity and lower serum LPC 18:0 in the Cyp1b1-null mice is elevated after SCD1 overexpression, suggesting that SCD1 is correlated with CYP1B1-induced obesity. These studies establish a biochemical link between cytochromes P450, lipids, and metabolic disorders and suggest that inhibition of CYP1B1 could be target for antiobesity drugs.
Keywords: CYP1B1, SCD1, obesity, metabolomics, lipid metabolism, mass spectrometry, lysophosphatidylcholine
Introduction
A biomarker is a molecular indicator of pathogenic processes or physiological responses to xenobiotic exposure. Nuclear magnetic resonance- and mass-spectrometry-based metabolomics enables the global profiling of metabolites in biofluids and tissues. Using this approach, biomarker discovery was carried out on various metabolic diseases.1,2 Biomarkers can be used to diagnose diseases and to elucidate the mechanism and biochemical pathways leading to disease and drug toxicity, and to monitor therapy.3−5 By combination with other high-throughput technologies, such as proteomics, biomarkers can be used to screen for candidate drugs to monitor efficacy in clinical trials.6−8 In addition, biomarkers hold promise to achieve personalization of disease treatment and prevention.
Obesity is a metabolic disease in which excess fat has accumulated in the body through storage in adipose tissue, leading to increased health problems and reduced life expectancy. Notably, obesity has become a global problem in the past decade and increases the likelihood of other metabolic diseases, particularly cardiovascular diseases, type-2 diabetes mellitus, and cancer.9,10 Human obesity has been subjected to metabolomics analysis, and biomarkers were identified that may provide information on the pathological conditions of obesity. Examples include serum branched-chain and aromatic amino acids and acylcarnitines in older women and men with obesity,11 plasma lysophosphatidylcholines in adult obese men,12 plasma fatty acids in obese adolescents,13 and serum phosphatidylcholines and lysophaphatidylcholines in children with obesity.14
Studies of Cyp1b1-null mice on low- and high-fat diets have shown that disruption of this gene provides extensive protection against obesity and steatotic hepatitis. This is associated with multiple major changes in gene expression in hepatocytes, including many suggestive of increased leptin activity and suppressed peroxisome proliferator-activated receptor α (PPARα) activity (Unpublished data). In the present study, mass-spectrometry-based metabolomics was adopted for the discovery of biomarkers related to HFD-induced obesity. LPC 18:0 was identified as a positively related biomarker for obesity along with a decrease in stearoyl-CoA desaturase 1 (SCD1) expression, particularly in livers of mice on a HFD. These responses are paralleled by a decrease in serum LPC 18:0 in Cyp1b1-null mice, which is reversed in CYP1B1-humaniced mice. Further studies indicated that SCD1 is involved in the effect of CYP1B1 on lipid metabolism.
Experimental Procedures
Chemicals and Reagents
Lysophosphatidylcholines (LPC 16:0, LPC 18:0, LPC 18:1, LPC 18:2, LPC 20:0, and LPC 22:0) were obtained from Avanti Polar Lipids (Alabaster, AL). All solvents and organic reagents were of the highest grade commercially available.
Generation of CYP1B1-Humanized Transgenic Mice
A bacterial artificial chromosome (BAC) clone containing the complete human CYP1B1 gene sequence was purified by using a Maxi Prep kit (QIAGEN, Valencia, CA). The BAC clone was verified by PCR using primers amplifying specific regions, exons 1, 2, 3, as described previously.15 The BAC clone DNA containing the human CYP1B1 gene was microinjected into fertilized FVB/N mouse eggs after linearization with the restriction enzyme NotI and purification. Mice positive for the human CYP1B1 transgene as identified by PCR analysis were bred with Cyp1b1-null mice.16 From this breeding, mice positive for the human CYP1B1 transgene in the Cyp1b1-null background were designated CYP1B1-humanized mice. The presence of the human CYP1B1 transgene was determined using the human CYP1B1-specific primers to amplify a PCR product of 201 bp that is diagnostic for the human CYP1B1 transgene. The mouse Cyp1b1 gene and the Tn5 gene encoding aminoglycoside 3′-phosphotransferase primers were genotyped by PCR to identify the mouse Cyp1b1 gene and Cyp1b1-null alleles through the diagnostic PCR products of 365 bp for Cyp1b1 allele and 460 bp for Cyp1b1-null allele. The CYP1B1-humanized mice were further bred with Cyp1b1-null mice on C57BL/6N genetic background for at least four generations.
Animal Studies and Treatment
Male, 6-week-old CYP1B1-humanized, Cyp1b1-null, and wild-type mice, were maintained under a standard 12 h light/12 h dark cycle with water and chow provided ad libitum. Animal studies were performed under a protocol approved by the NCI Animal Care and Use Committee and were in compliance with the Guide for the Care and Use of Laboratory Animal Resources (1996), National Research Council. For high-fat diet (HFD)-induced obesity, CYP1B1-humanized mice, Cyp1b1-null mice, and wild-type mice were fed for 12 weeks with a diet consisting of 60% kcal fat (D12492) obtained from Research Diets (New Brunswick, NJ). Mice treated with a diet consisting of 10% kcal fat (D12450B) were used as the control group. Serum samples were collected by retro-orbital bleeding at the end of treatment. Liver and adipose samples were harvested immediately following killing by CO2 asphyxiation and flash-frozen in liquid nitrogen. All samples were stored at −80 °C until analysis.
Metabolomics Analysis and Metabolites Quantification
Serum samples were prepared by adding 10 μL of serum to 190 μL of 67% aqueous acetonitrile (1:2, water/acetonitrile). Samples were mixed for 5 min and centrifuged at 14 000 rpm for 20 min at 4 °C to remove protein. A 5 μL aliquot of supernatant was separated using a 2.1 × 50 mm BEH C18 1.7 μm column (Waters, Milford, MA) and introduced via electrospray into a Waters ultraperformance liquid chromatography coupled with electrospray ionization quadrupole mass spectrometry (UPLC-ESI-QTOFMS). The samples were eluted using a gradient mobile phase with water and acetonitrile containing 0.1% formic acid solution. The parameters of ionization were consistent with previous reports.17,18 Data were collected in the positive mode and negative mode, which with the MS was operated in full-scan mode from m/z 100 to 1000.
The mass signal of ions was processed using MarkerLynx software (Waters, Milford, MA) to generate a data matrix, including peak area, mass-to-charge ratio (m/z), and retention time. The multivariate data matrix was exported into SIMCA-P+12.0 (Umetrics, Kinnelon, NJ) for principal component analysis (PCA). The ions contributing significantly to the separation of groups were further investigated by searching the metabolomics database (METLIN) and comparison with authentic compounds.
Quantitation of serum lysophosphatidylcholine was performed using an ACQUITY UPLC system coupled to a Xevo triple quadrupole tandem mass spectrometer (Waters). Calibration curves (0.2 to 25 μM) were generated for each metabolite. The following multiple reaction monitoring (MRM) transitions were monitored: LPC 16:0 (496 → 104; ESI+), LPC 18:0 (524 → 104; ESI+), LPC 18:1 (522 → 104; ESI+), LPC 18:2 (520 → 104; ESI+), LPC 20:0 (552 → 104; ESI+), LPC 22:0 (580 → 104; ESI+), and LPC 17:0 (510 → 104; ESI+). LPC 17:0 (1.0 uM) was used as the internal standard.
Gene Expression Analysis
RNA was extracted using TRIzol reagent (Invitrogen, Carlsbad, CA) from frozen liver. Complementary DNA was synthesized from 1 mg total RNA using Superscript II reverse transcriptase (Invitrogen, Carlsbad, CA). Primers were designed with qPrimerDepot. Quantitative real-time PCR (qPCR) primer sequences are shown in Supplementary Table 1 in the Supporting Information. QPCR was carried out using SYBR green PCR master mix in an ABI Prism 7900HT sequence detection system (Applied Biosystems, Foster City, CA). Values were quantified with the comparative CT method, and mRNA levels were normalized to those of β-actin mRNA. mRNA levels were expressed as fold change relative to wild-type mice.
Metabolic Assays
For glucose tolerance testing (GTT), mice were fasted for 16 h and injected intraperitoneally (i.p.) with 1.0 g/kg glucose. Blood samples were taken from the tail at 0, 15, 30, 60, and 90 min after injection, and glucose was measured using a Glucometer (Bayer, Pittsburgh, PA).
Western Blot Analysis
Fifty mg of liver was homogenized in RIPA buffer with protease and phosphatase inhibitors and centrifuged at 4 °C for 15 min at 15 000 rpm. Liver protein extract (10 μg) was separated on a 4–15% Tris-HCl gel and transferred to a polyvinylidene difluoride membrane. Membranes were incubated with antibodies against human CYP1B1 (provided by Craig Marcus, Oregon State University) and SCD1 (Santa Cruz Biotechnology, Santa Cruz, CA).
In Vivo Overexpression of SCD1 by Adenovirus
Adenovirus-expressing rat SCD1 (Ad-SCD1)19 was kindly provided by Vassilis I. Zannis (Boston University), and control adenovirus was provided by Shioko Kimura (National Cancer Institute). Ad-Scd1 was amplified in QBI293 cells and purified using two cesium chloride ultracentrifugation steps. For in vivo transfections, male wild-type mice and Cyp1b1-null mice were treated with HFD for 6 weeks, and 2 × 10⁹ plaque-forming units of control adenovirus or Ad-SCD1 (dissolving in 0.9% sterile saline) were injected into the tail vein in a total volume of 200 μL. The mice were injected once every 5 days for three cycles, and were killed on the fifth day after the last adenovirus injection.
Data Analysis
Statistical analysis was performed using GraphPad Prism software (GraphPad Software, San Diego, CA). Two-tailed Student’s t test and one-way ANOVA was used to compare the levels of metabolites and changes in gene expression between wild-type Cyp1b1-null and CYP1B1-humanized mice. Experimental values are presented as mean ± SEM. P-values of less than 0.05 are considered significant.
Results
Generation of CYP1B1-Humanized Mice
A transgenic mouse line was constructed using a BAC clone containing the complete human CYP1B1 gene sequence (exons 1–3) and 5′- and 3′-flanking sequences (Supplementary Figure 1A in the Supporting Information). Transgenic mice containing the human CYP1B1 gene in the mouse Cyp1b1-null background were bred to generate mice homozygous for the CYP1B1 allele. Genomic DNA from wild-type, Cyp1b1-null, and CYP1B1-humanized mice was amplified with three different sets of specific primers: human CYP1B1 (hCYP1B1), mouse Cyp1b1 (mCYP1B1), and the Neomycin resistance gene (NEO). Amplification of mCYP1B1 PCR product (365 bp) in wild-type mice and Cyp1b1-null generated a PCR product of 460 bp in both Cyp1b1-null and CYP1B1-humanized mice (Supplementary Figure 1B in the Supporting Information). The human CYP1B1-derived product of 201 bp is present only in CYP1B1-humanized mice (Supplementary Figure 1C in the Supporting Information). Liver microsomal protein from wild-type, Cyp1b1-null, and CYP1B1-humanized mice treated with 1.0 μg/kg of 2,3,7,8-tetrachlorodibenzo-p-dioxin (TCDD) for 3 days was subjected to Western blotting for detection of CYP1B1 protein expression. Human CYP1B1 protein (50 kDa) was only expressed in CYP1B1-humanized mice, and the mobility was consistent with human recombinant CYP1B1 protein (Supplementary Figure 1D in the Supporting Information).
Identification of LPC 18:0 as a Biomarker for HFD-Induced Obesity
Energy intake exceeds energy expenditure, which contributes to the incidence of obesity, which, in turn, is associated with other metabolic disorders such as diabetes and atherosclerosis.20 An HFD-induced obesity model was used to identify biomarkers for obesity. Measurement of body weight revealed that body mass was significantly elevated by ∼15 and ∼40% at 6 and 11 weeks in HFD-treated mice compared with those on a low-fat diet (Figure 1A). Serum samples were collected at 6 and 11 weeks on HFD and analyzed using UPLC-ESI-QTOFMS operating in positive ionization mode. PCA models distinguished HFD-induced obese mice from control mice at both 6 and 11 weeks on the diet (Figure 1B). Ions contributing to the separation of HFD-induced obese and control mice were those deviated from the ion cloud in the loading scatter plot (Figure 1C). The four top ions in serum of m/z 524.3697+ at 5.34 min, m/z 520.3376+ at 4.53 min, m/z 522.3536+ at 4.88 min, and m/z 494.3223+ at 4.35 min were found to contribute to separation of the HFD and control groups. Tandem mass spectrometry (MS/MS) fragmentation showed that all four compounds were similar, as revealed by the presence of 184+ (C5H15NO4P+) and 104+ (C5H14NO+) daughter ions (Supplementary Figure 2A–E in the Supporting Information). By comparison of retention times and mass fragmentation patterns to authentic standards, these four ions were identified as LPC 18:0, LPC 18:2, LPC 18:1, and LPC 16:1 (Supplementary Table 2 in the Supporting Information). All metabolites belonging to the lysophosphatidylcholine group are related to obesity.12,14 The levels of these metabolites, including other major lysophosphatidylcholines, were analyzed at the 11-week treatment time point. LPC 18:0, LPC 18:2, and LPC 20:0 were increased 50.2, 54, and 60% in HFD-obesity mice, while LPC 16:1 and LPC 18:1 were decreased 54 and 34%, respectively (Figure 1D). However, other lysophosphatidylcholines (LPC 16:0 and LPC 22:0) remained unchanged in HFD-fed obese mice with a weak correlation (Supplementary Figure 3A,B in the Supporting Information). To determine which metabolite was directly related to obesity, the correlation of the level of metabolites with adipose mass was calculated. LPC 18:0, LPC 18:2, and LPC 20:0 were positively correlated with the adipose mass, while LPC 16:1 and LPC 18:1 were negatively correlated with the adipose mass (Figure 2A–E). Among these lysophosphatidylcholines, LPC 18:0 levels showed the best correlation with the adipose mass (r = 0.80). Compared with the single LPC 18:1 (r = −0.22) and LPC 18:2 (r = 0.41), the ratios of LPC 18:0/LPC 18:1 (r = 0.72) and LPC 18:0/LPC 18:2 (r = 0.61) showed better correlations (Supplementary Figure 3C,D in the Supporting Information). These results indicate that serum lysophosphatidylcholines are associated with obesity, especially LPC 18:0.
Figure 1.

Metabolomics identification of obesity-related biomarkers. (A) Body weight of the mice after 6 and 11 weeks of HFD treatment. (B) PCA model of serum metabolites between the HFD group (n = 10, green) and control group (n = 10, blue). Each point represents an individual mouse serum sample from the HFD and control groups. The t[1] and t[2] correspond to principal components 1 and 2, respectively. (C) Loadings scatter plot from the PCA model of the HFD group and control group. Each point represents a serum ion obtained in positive mode (ESI+). The p[1] values represent the relative abundance of the ions and p[2] values represent the interclass difference. The top altered lipids are labeled in the loadings scatter plot. (D) Change of serum LPC in 11-week HFD-treated mice. Statistical analysis was performed using two-tailed Student’s t-test (n = 5 in each group). *, P < 0.05 and **, P < 0.01 compared with control mice (lower-fat diet).
Figure 2.
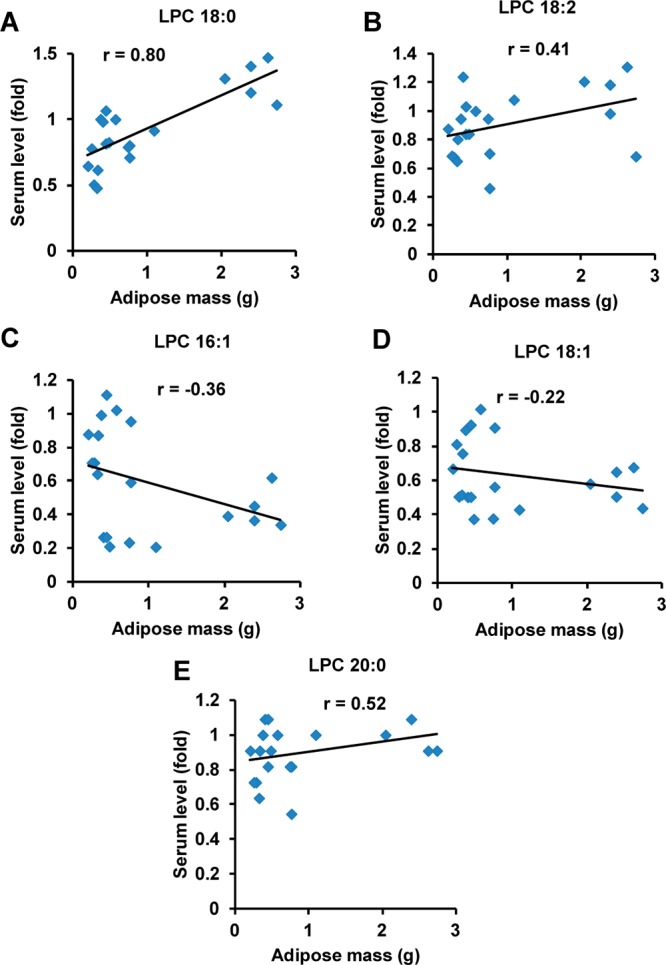
Correlation of serum lysophosphatidylcholines with adipose mass. (A–E) Correlation of serum LPC 18:0, LPC 18:2, LPC 16:1, LPC 18:1, and LPC 20:0 levels with adipose mass in HFD-induced obesity.
Suppression of Obesity in Cyp1b1-Null Mice Is Correlated with Changes in Serum LPC Metabolites
The body weight of Cyp1b1-null mice on a HFD decreases in proportion to suppression of adiposity. Body weight was significantly decreased from 6 weeks compared with wild-type mice following treatment with HFD (Figure 3A). To explore the role of loss of CYP1B1 on obesity-related glucose homeostasis, glucose tolerance tests (GTT) were performed. GTT revealed that after 11 weeks of HFD challenge, Cyp1b1-null mice displayed significantly reduced blood glucose levels after glucose loading compared with control mice (Figure 3B). The area under the curve (AUC) for glucose was lower in Cyp1b1-null mice than wild-type mice (Figure 3C). Serum metabolomics analysis demonstrated that the serum LPC metabolites in Cyp1b1-null mice showed significant difference from the wild-type mice in the PCA model (Figure 3D). Similarly, the four top ions, m/z 496.3404+ at 4.66 min, m/z 524.3717+ at 5.26 min, m/z 522.3560+ at 4.81 min, and m/z 520.3405+ at 4.46 min in serum, were identified as LPC 16:0, LPC 18:0, LPC 18:1, and LPC 18:2, respectively (Figure 3E). Two saturated lysophosphatidylcholines, LPC 16:0 and LPC 18:0, were decreased 24 and 15% in Cyp1b1-null mice (Figure 4A,D). Two unsaturated lysophosphatidylcholines, LPC 18:1 and LPC 18:2, were decreased 30 and 13% in Cyp1b1-null mice (Figure 4B,C). The expression of mRNA encoding phosphate cytidylyltransferase 1β (Pcyt1β), involved in the synthesis of lysophosphatidylcholines, was significantly decreased in Cyp1b1-null mice (Figure 4E), while other genes related to the metabolism and synthesis of lysophosphatidylcholines did not exhibit significantly differ between the groups, including lysophosphatidylcholine acyltransferase (Lpcat) and choline phosphotransferase 1 (Chpt1) (Supplementary Figure 4 in the Supporting Information). These results extend previous studies showing that resistance to HFD-induced obesity is associated with changes in fatty acid-selective LPC synthesis that is readily detected in serum.
Figure 3.

Human CYP1B1 induced obesity on HFD. (A) Typical growth curves on a HFD. (B) GTT after 11 weeks of HFD. (C) Glucose area under the curve after 11 weeks of HFD. (D) PCA model of serum metabolites for wild-type (WT), Cyp1b1-null, and CYP1B1-humanized (hCYP1B1) mice after HFD treatment for 12 weeks. (E) Loadings scatter plot of PCA. Statistical analysis was performed using two-tailed Student’s t test (n = 5 in each group). *, P < 0.05 and **, P < 0.01 compared with wild-type mice (WT); #, P < 0.05 compared with Cyp1b1-null mice.
Figure 4.
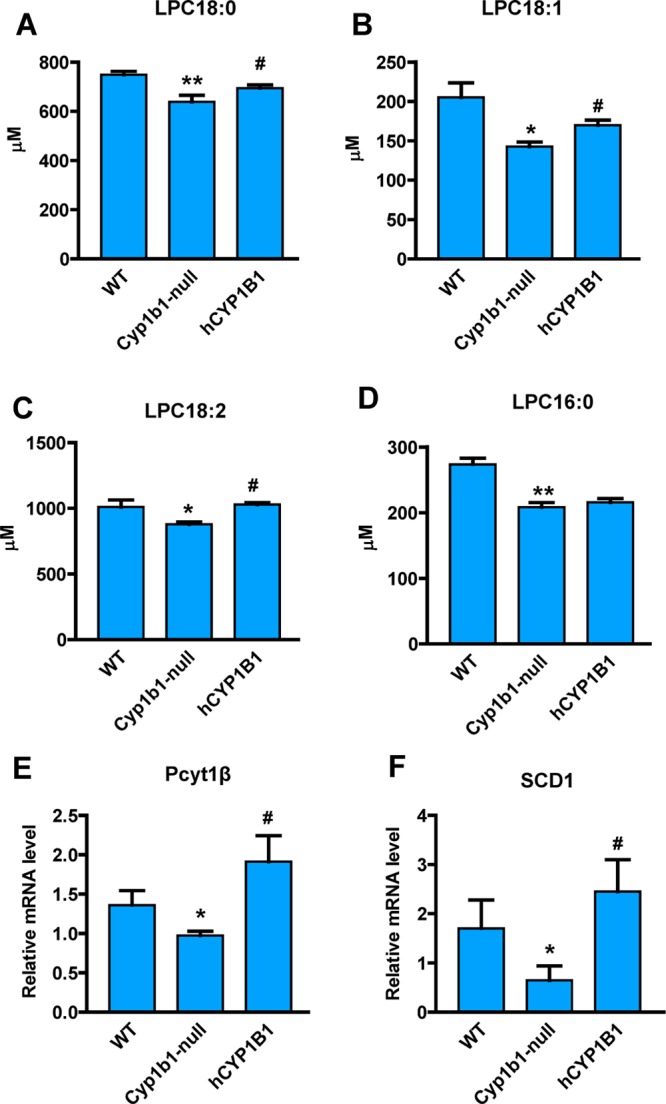
Changes of metabolites and genes associated with the mouse Cyp1b1 knockout and human CYP1B1 overexpression. (A–D) Serum levels of LPC 18:0, LPC 18:1, LPC 18:2, and LPC 16:0 in Cyp1b1-null, CYP1B1-humanized (hCYP1B1), and wild-type (WT) mice after treated with HFD for 12 weeks. The concentrations of serum lysophosphatidylcholines were measured by triple quadrupole tandem mass spectrometry. (E,F) Hepatic Pcyt1β and Scd1 mRNA levels. The mRNA levels were normalized to those of β-actin mRNA. Statistical analysis was performed using two-tailed Student’s t test (n = 5 in each group). *, P < 0.05 and **, P < 0.01 compared with wild-type mice (WT); #, P < 0.05 compared with Cyp1b1-null mice.
Human CYP1B1 as a Potential Therapeutic Target for Treatment of Obesity
To further explore the effect of human CYP1B1 on HFD-induced obesity, male CYP1B1-humanized mice were fed a HFD. The body weights of CYP1B1-humanized mice were higher than those of the Cyp1b1-null mice after 8 weeks of HFD treatment (Figure 3A). GTT revealed that after 11 weeks of HFD challenge, CYP1B1-humanized mice displayed significantly increased blood glucose levels after glucose loading compared with Cyp1b1-null (Figure 3B), and the glucose AUC was higher in CYP1B1-humanized mice than in Cyp1b1-null mice (Figure 3C). Serum metabolomics analysis demonstrated that the PCA model discriminated the CYP1B1-humanized mice from Cyp1b1-null mice (Figure 3D). Three serum-decreased lysophosphatidylcholines, LPC 18:0, LPC 18:1, and LPC 18:2, in Cyp1b1-null mice were significantly increased in CYP1B1-humanized mice (Figure 4A–C). Compared with Cyp1b1-null mice, the levels of LPC 18:0, LPC 18:1, and LPC 18:2 were increased 8.6, 19, and 17% in CYP1B1-humanized mice. The levels of LPC 16:0, LPC 20:0, and LPC 22:0 did not show significant differences between Cyp1b1-null and CYP1B1-humanized mice (Supplementary Figure 5A,B in the Supporting Information). In addition, expression of Pcyt1β was higher in CYP1B1-humanized mice than in Cyp1b1-null mice (Figure 4E). These observations confirm that the protection of CYP1B1 inhibition against HFD-induced obesity is reversed after the introduction of the human CYP1B1 gene to the Cyp1b1-null mice, suggesting that the inhibition of human CYP1B1 might function as a potential therapeutic target for obesity.
CYP1B1 Influence on Metabolic Profile Partially via Induction of SCD1
Previous studies indicated that hepatic SCD1 is one of the main regulators of the altered balance between long-chain fatty-acid-derived lysophosphatidylcholines in vivo under pathological conditions.21,22 Expression of hepatic Scd1 mRNA is significantly decreased in Cyp1b1-null mice compared with wild-type mice, particularly on a HFD (Unpublished data). This was also shown for Cyp1b1-null mice following treatment with HFD (Figure 4F). In contrast with Cyp1b1-null mice, the expression level of Scd1 was elevated in CYP1B1-humanized mice. To investigate whether SCD1 regulates the synthesis of lysophosphatidylcholines in vivo, a recombinant adenovirus expressing SCD1 (Ad-Scd1) was generated. Ad-Scd1 enhanced hepatic SCD1 protein expression, and this forced expression was correlated with increased body weight of both wild-type and Cyp1b1-null mice compared with the control group (Ad-ctr) without SCD1 overexpression (Figure 5A,B). The decreased LPC 18:0 levels in Cyp1b1-null mice were also reversed in the Cyp1b1-null mice treated with Ad-Scd1 (Figure 5C). However, LPC 18:0 levels were unchanged in wild-type mice with forced expression of SCD1. The levels of LPC18:1 and LPC18:2 were also not significantly increased in the Cyp1b1-null mice with forced expression of SCD1 by Ad-Scd1 (Supplementary Figure 6A,B in the Supporting Information). These results suggest that while hepatic SCD1 mediates the condition of obesity in both wild-type and Cyp1b1-null mice, the effect may not be due exclusively to altered LPC levels.
Figure 5.
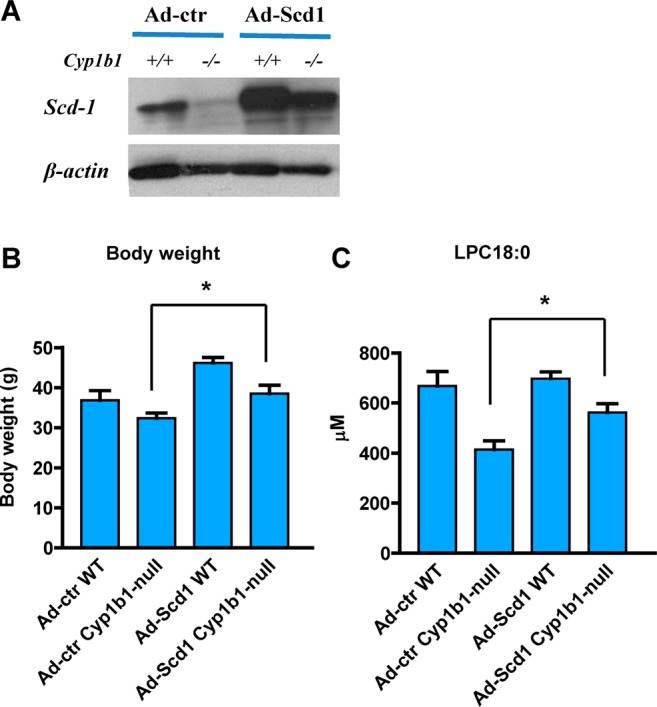
SCD1 mediates CYP1B1-induced obesity. (A) Western blot analysis of SCD1 in the liver of wild-type (+/+) and Cyp1b1-null (−/−) mice with SCD1 overexpression. (B) Body weight of wild-type (WT) and Cyp1b1-null mice after three Ad-Scd1 injections. (C) Serum levels of LPC 18:0 in Cyp1b1-null and wild-type mice with SCD1 overexpression. The concentrations of serum lysophosphatidylcholines were measured by triple quadrupole tandem mass spectrometry. Statistical analysis was performed using two-tailed Student’s t test (n = 5 in each group). *, P < 0.05 compared with Cyp1b1-null mice treated with Ad-ctr (Ad-ctr Cyp1b1-null).
Discussion
The current study demonstrates a direct correlation between CYP1B1 and SCD1 expression in the regulation of lipid metabolism that contributes to obesity. Mice lacking CYP1B1 fed a high-fat diet are leaner than their corresponding wild-type and CYP1B1-humanized counterparts. Adenoviral-mediated forced expression of SCD1 in the livers of Cyp1b1-null mice elevated adiposity found in the HFD-fed wild-type mice. One potential mechanism for this correlation is that the metabolism of saturated C18 and C16 fatty acids by SCD1 enhances their mitochondrial oxidation instead of conversion to triglycerides. However, forced SCD1 expression also increased the obesity of HFD-fed wild-type mice without the corresponding increase in LPC 18:0 levels noted in the Cyp1b1-null mice. In addition, there was no change in LPC 18:1 and 18:2 in the Cyp1b1-null mice administered the Ad-Scd1. Thus, other changes in hepatic gene expression in Cyp1b1-null mice might also contribute to this same metabolic switch. The present work suggests that while a systemic decrease in CYP1B1 activity lowers obesity through a combination of gene expression changes, SCD1 likely has a dominant effect. Recent work also shows that while systemic SCD1 suppression similarly lowers obesity, the primary effect is on the skin epidermis.23Scd1 disruption in the epidermis prevents diet-induced obesity, whereas disruption of the gene in hepatocytes lowers liver triglycerides but not obesity. This SCD1 loss is conveniently tracked by changes in phospholipid metabolism. UPLC-ESI-QTOFMS was adopted to examine the change of serum metabolites in wild-type mice, Cyp1b1-null mice, and CYP1B1-humanized mice following HFD treatment. The levels of several phospholipids were affected in HFD-induced obese mice, with LPC 18:0 showing a positive correlation with the fat mass. LPC 18:0 increased in HFD-fed wild-type mice and decreased in Cyp1b1-null mice with a lean phenotype. After Cyp1b1-null mice were reconstituted with the human CYP1B1 gene, the level of LPC 18:0 recovered. Additionally, stimulation of preadipocyte C3H10T1/2 cells by an adipogenic hormonal mixture consisting of insulin, dexamethasone, and methylisobutylxanthine can substantially induce CYP1B1 expression.24,25 These results provide evidence that CYP1B1 can affect lipid metabolism.
The effect of CYP1B1 on obesity via phospholipid metabolism is in agreement with previous studies, demonstrating that phosphatidylcholines are closely related to obesity in humans.26 Metabolomics analysis also indicated that the composition of lysophosphatidylcholines in serum was different between obese and lean animals and humans,12,27 in agreement with the present study where lower levels of LPC 18:0 were found in lean mice compared with their obese counterparts. It was also reported that lysophosphatidylcholines plays a role in the development of insulin resistance as well as proinflammatory and proatherogenic conditions.12 Consistent with change of metabolites, the hepatic expression of Pcyt1β, which is involved in lysophosphatidylcholine synthesis, shows a similar trend to serum LPC 18:0 levels between lean and obese mice. Hepatic SCD1 expression was decreased in HFD-fed Cyp1b1-null mice but increased in HFD-fed CYP1B1-humanized mice, probably contributing to the change of lysophosphatidylcholines. SCD1 catalyzes the generation of monounsaturated fatty acids from saturated fatty acids that are either synthesized de novo or derived from the diet. This is a critical control point in the development of metabolic diseases through the mediation of lipid metabolism and insulin response, especially for obesity and insulin resistance.28 It is known that Scd1 disruption can protect mice from HFD and leptin-deficiency-induced obesity.29Scd1-null mice show reduced fatty acid and triglyceride synthesis when treated with a high-carbohydrate diet, partially due to the decrease in sterol regulatory element-binding protein 1 (Srebp-1) and expression of its target genes such as fatty acid synthase (Fasn) and the fatty acid elongase (Elovl6).30 Insulin resistance under the condition of obesity is closely linked with lipid metabolism. Therefore, the decreased lipid synthesis contributes to the enhanced insulin sensitivity when the expression of SCD1 was inhibited. Indeed, Scd1-null mice enhance insulin sensitivity and insulin signaling pathways in various tissues, including muscle and white adipose tissue.31 In the current study, GTT indicated that insulin sensitivity in HFD-induced obese mice is correlated with the expression of SCD1. Several studies have demonstrated that serum lysophosphatidylcholines are one indicator for the change of body weight in HFD-induced obese animal models.27 These observations provide evidence that SCD1 and lipid metabolism have a major influence on CYP1B1-improved obesity.
CYP1B1, a member of the cytochrome P450 superfamily, is found in humans and mice and is involved in the metabolism of both endogenous and exogenous substrates. The CYP1B1 gene is expressed in several tissues, including the eye, uterus, and skin.32 It is responsible for the activation of carcinogens, including polycyclic aromatic hydrocarbons, N-heterocyclic amines, and arylamines.33 Endogenous compounds metabolized by CYP1B1 include steroid hormones and lipids that regulate the metabolism, accumulation, and distribution of adipose tissues.34 Among the lipids, the metabolism of arachidonic acid is carried out by CYP1B1.35 Arachidonic acid is the primary source of fatty acids that are esterified to form cell membrane glycerophospholipids, which are associated with obesity and insulin resistance.36 A previous study reported that treatment with arachidonic acid resulted in a decrease in SCD1 enzyme activity and Scd1 mRNA in 3T3-L1 adipocytes.37 The loss of CYP1B1 in mice could affect the metabolism of arachidonic acid in vivo, suggesting that the inhibited SCD1 expression might result from the decrease in arachidonic acid metabolism, leading to an antiobesity effect.
Because Cyp1b1-null mice are protected against HFD-induced obesity, the issue arises whether human CYP1B1 shows a similar pro-obesity effect. Species differences have been observed in the response to xenobiotics exposure, especially between humans and mice,38 and are attributed to genetic differences between CYPs and various xenobiotic receptors between humans and mice.39 For example, there are at least five Cyp2d genes in mice, whereas a single active member CYP2D6 with high polymorphism is found in humans. None of these genes encodes a protein that has the same enzymatic activity as CYP2D6.40 After introducing the human CYP1B1 gene into Cyp1b1-null mice, the change of body weight and glucose metabolism in CYP1B1-humanized mice responded to HFD in a manner similar to wild-type mice, suggesting no significant differences in the HFD-induced obesity effect between mouse and human CYP1B1. A recent study reported that cotreatment with rifampicin and isoniazid can cause accumulation of hepatotoxin protoporphyrin IX in the liver through pregnane X receptor (PXR)-mediated alteration of the heme biosynthesis in PXR-humanized mouse.41 These studies demonstrate that humanized-animal models are a valuable tool to evaluate the effect of human CYPs or xenobiotic receptors on xenobiotic exposure and disease susceptibility.
In conclusion, metabolomics revealed that serum LPC 18:0 is a positive biomarker for HFD-induced obesity. Suppression of obesity in Cyp1b1-null mice is paralleled by changes in serum LPC metabolites. The CYP1B1-humanized mouse model revealed that human CYP1B1 shows a similar response to HFD to the mouse CYP1B1. Further studies demonstrate SCD1 has a major influence on CYP1B1-improved obesity. The finding that human CYP1B1 influences lipid homeostasis via SCD1 and the lysophosphatidylcholine pathway suggests that the inhibition of CYP1B1 could be a clinical target for the treatment of obesity. However, the precise mechanism by which CYP1B1 influences lipid metabolism remains to be determined.
Acknowledgments
This work was supported by the National Cancer Institute Intramural Research Program to F.J.G., the National Institutes of Diabetes and Digestive and Kidney Diseases (5R01DK090249) to C.R.J., and the National Natural Science Foundation of China (81360509) to F.L.
Supporting Information Available
Supplementary Table 1. Primer pairs used for qPCR. Supplementary Table 2. Summary of ions altered in HFD-fed mice compared with control mice. Supplementary Figure 1. Generation of CYP1B1-humanized mice. Supplementary Figure 2. Identification of serum lysophosphatidylcholines. Supplementary Figure 3. Correlation of altered serum lysophosphatidylcholine with adipose mass. Supplementary Figure 4. Genes associated with the metabolism and synthesis of lysophosphatidylcholines. Supplementary Figure 5. The change of serum lysophosphatidylcholine in Cyp1b1-null and CYP1B1-humanized mice. Supplementary Figure 6. SCD1 affects serum lysophosphatidylcholine. This material is available free of charge via the Internet at http://pubs.acs.org.
Author Present Address
∥ T.W.: Department of Hematology, Ren Ji Hospital, Shanghai Jiao Tong University School of Medicine, Shanghai 200001, China.
Author Contributions
§ F.L. and C.J. contributed equally to this study
The authors declare no competing financial interest.
Funding Statement
National Institutes of Health, United States
Supplementary Material
References
- Xu F.; Tavintharan S.; Sum C. F.; Woon K.; Lim S. C.; Ong C. N. Metabolic signature shift in type 2 diabetes mellitus revealed by mass spectrometry-based metabolomics. J. Clin. Endocrinol. Metab. 2013, 986E1060–E1065. [DOI] [PubMed] [Google Scholar]
- Wang-Sattler R.; Yu Z.; Herder C.; Messias A. C.; Floegel A.; He Y.; Heim K.; Campillos M.; Holzapfel C.; Thorand B.; Grallert H.; Xu T.; Bader E.; Huth C.; Mittelstrass K.; Doring A.; Meisinger C.; Gieger C.; Prehn C.; Roemisch-Margl W.; Carstensen M.; Xie L.; Yamanaka-Okumura H.; Xing G.; Ceglarek U.; Thiery J.; Giani G.; Lickert H.; Lin X.; Li Y.; Boeing H.; Joost H. G.; de Angelis M. H.; Rathmann W.; Suhre K.; Prokisch H.; Peters A.; Meitinger T.; Roden M.; Wichmann H. E.; Pischon T.; Adamski J.; Illig T. Novel biomarkers for pre-diabetes identified by metabolomics. Mol. Syst. Biol. 2012, 8, 615. [DOI] [PMC free article] [PubMed] [Google Scholar]
- Vasan R. S. Biomarkers of cardiovascular disease: molecular basis and practical considerations. Circulation 2006, 113192335–2362. [DOI] [PubMed] [Google Scholar]
- Laferrere B.; Reilly D.; Arias S.; Swerdlow N.; Gorroochurn P.; Bawa B.; Bose M.; Teixeira J.; Stevens R. D.; Wenner B. R.; Bain J. R.; Muehlbauer M. J.; Haqq A.; Lien L.; Shah S. H.; Svetkey L. P.; Newgard C. B. Differential metabolic impact of gastric bypass surgery versus dietary intervention in obese diabetic subjects despite identical weight loss. Sci. Transl. Med. 2011, 38080re2. [DOI] [PMC free article] [PubMed] [Google Scholar]
- Nicholson J. K.; Connelly J.; Lindon J. C.; Holmes E. Metabonomics: a platform for studying drug toxicity and gene function. Nat. Rev. Drug Discovery 2002, 12153–161. [DOI] [PubMed] [Google Scholar]
- Frank R.; Hargreaves R. Clinical biomarkers in drug discovery and development. Nat. Rev. Drug Discovery 2003, 27566–580. [DOI] [PubMed] [Google Scholar]
- Patti G. J.; Yanes O.; Shriver L. P.; Courade J. P.; Tautenhahn R.; Manchester M.; Siuzdak G. Metabolomics implicates altered sphingolipids in chronic pain of neuropathic origin. Nat. Chem. Biol. 2012, 83232–234. [DOI] [PMC free article] [PubMed] [Google Scholar]
- Huang J. T.; Leweke F. M.; Oxley D.; Wang L.; Harris N.; Koethe D.; Gerth C. W.; Nolden B. M.; Gross S.; Schreiber D.; Reed B.; Bahn S. Disease biomarkers in cerebrospinal fluid of patients with first-onset psychosis. PLoS Med. 2006, 311e428. [DOI] [PMC free article] [PubMed] [Google Scholar]
- Khandekar M. J.; Cohen P.; Spiegelman B. M. Molecular mechanisms of cancer development in obesity. Nat. Rev. Cancer 2011, 1112886–895. [DOI] [PubMed] [Google Scholar]
- De Pergola G.; Silvestris F. Obesity as a major risk factor for cancer. J. Obes. 2013, 2013, 291546. [DOI] [PMC free article] [PubMed] [Google Scholar]
- Newgard C. B.; An J.; Bain J. R.; Muehlbauer M. J.; Stevens R. D.; Lien L. F.; Haqq A. M.; Shah S. H.; Arlotto M.; Slentz C. A.; Rochon J.; Gallup D.; Ilkayeva O.; Wenner B. R.; Yancy W. S. Jr.; Eisenson H.; Musante G.; Surwit R. S.; Millington D. S.; Butler M. D.; Svetkey L. P. A branched-chain amino acid-related metabolic signature that differentiates obese and lean humans and contributes to insulin resistance. Cell Metab. 2009, 94311–326. [DOI] [PMC free article] [PubMed] [Google Scholar]
- Pietilainen K. H.; Sysi-Aho M.; Rissanen A.; Seppanen-Laakso T.; Yki-Jarvinen H.; Kaprio J.; Oresic M. Acquired obesity is associated with changes in the serum lipidomic profile independent of genetic effects--a monozygotic twin study. PLoS One 2007, 22e218. [DOI] [PMC free article] [PubMed] [Google Scholar]
- Mihalik S. J.; Michaliszyn S. F.; de las Heras J.; Bacha F.; Lee S.; Chace D. H.; DeJesus V. R.; Vockley J.; Arslanian S. A. Metabolomic profiling of fatty acid and amino acid metabolism in youth with obesity and type 2 diabetes: evidence for enhanced mitochondrial oxidation. Diabetes Care 2012, 353605–611. [DOI] [PMC free article] [PubMed] [Google Scholar]
- Wahl S.; Yu Z.; Kleber M.; Singmann P.; Holzapfel C.; He Y.; Mittelstrass K.; Polonikov A.; Prehn C.; Romisch-Margl W.; Adamski J.; Suhre K.; Grallert H.; Illig T.; Wang-Sattler R.; Reinehr T. Childhood obesity is associated with changes in the serum metabolite profile. Obes. Facts 2012, 55660–670. [DOI] [PubMed] [Google Scholar]
- Tang Y. M.; Wo Y. Y.; Stewart J.; Hawkins A. L.; Griffin C. A.; Sutter T. R.; Greenlee W. F. Isolation and characterization of the human cytochrome P450 CYP1B1 gene. J. Biol. Chem. 1996, 2714528324–28330. [DOI] [PubMed] [Google Scholar]
- Buters J. T.; Sakai S.; Richter T.; Pineau T.; Alexander D. L.; Savas U.; Doehmer J.; Ward J. M.; Jefcoate C. R.; Gonzalez F. J. Cytochrome P450 CYP1B1 determines susceptibility to 7, 12-dimethylbenz[a]anthracene-induced lymphomas. Proc. Natl. Acad. Sci. U. S. A. 1999, 9651977–1982. [DOI] [PMC free article] [PubMed] [Google Scholar]
- Li F.; Patterson A. D.; Krausz K. W.; Jiang C.; Bi H.; Sowers A. L.; Cook J. A.; Mitchell J. B.; Gonzalez F. J. Metabolomics reveals that tumor xenografts induce liver dysfunction. Mol. Cell. Proteomics 2013, 1282126–2135. [DOI] [PMC free article] [PubMed] [Google Scholar]
- Li F.; Pang X.; Krausz K. W.; Jiang C.; Chen C.; Cook J. A.; Krishna M. C.; Mitchell J. B.; Gonzalez F. J.; Patterson A. D. Stable isotope- and mass spectrometry-based metabolomics as tools in drug metabolism: a study expanding tempol pharmacology. J. Proteome Res. 2013, 1231369–1376. [DOI] [PMC free article] [PubMed] [Google Scholar]
- Drosatos K.; Sanoudou D.; Kypreos K. E.; Kardassis D.; Zannis V. I. A dominant negative form of the transcription factor c-Jun affects genes that have opposing effects on lipid homeostasis in mice. J. Biol. Chem. 2007, 2822719556–19564. [DOI] [PMC free article] [PubMed] [Google Scholar]
- Bray G. A.; Popkin B. M. Dietary fat intake does affect obesity!. Am. J. Clin. Nutr. 1998, 6861157–1173. [DOI] [PubMed] [Google Scholar]
- Chen C.; Shah Y. M.; Morimura K.; Krausz K. W.; Miyazaki M.; Richardson T. A.; Morgan E. T.; Ntambi J. M.; Idle J. R.; Gonzalez F. J. Metabolomics reveals that hepatic stearoyl-CoA desaturase 1 downregulation exacerbates inflammation and acute colitis. Cell Metab. 2008, 72135–147. [DOI] [PMC free article] [PubMed] [Google Scholar]
- Budhu A.; Roessler S.; Zhao X.; Yu Z.; Forgues M.; Ji J.; Karoly E.; Qin L. X.; Ye Q. H.; Jia H. L.; Fan J.; Sun H. C.; Tang Z. Y.; Wang X. W. Integrated metabolite and gene expression profiles identify lipid biomarkers associated with progression of hepatocellular carcinoma and patient outcomes. Gastroenterology 2013, 14451066–1075.e1. [DOI] [PMC free article] [PubMed] [Google Scholar]
- Sampath H.; Ntambi J. M. Role of Stearoyl-CoA Desaturase-1 in Skin Integrity and Whole Body Energy Balance. J. Biol. Chem. 2014, 28952482–2488. [DOI] [PMC free article] [PubMed] [Google Scholar]
- Zheng W.; Tong T.; Lee J.; Liu X.; Marcus C.; Jefcoate C. R. Stimulation of mouse Cyp1b1 during adipogenesis: characterization of promoter activation by the transcription factor Pax6. Arch. Biochem. Biophys. 2013, 53211–14. [DOI] [PMC free article] [PubMed] [Google Scholar]
- Cho Y. C.; Zheng W.; Yamamoto M.; Liu X.; Hanlon P. R.; Jefcoate C. R. Differentiation of pluripotent C3H10T1/2 cells rapidly elevates CYP1B1 through a novel process that overcomes a loss of Ah Receptor. Arch. Biochem. Biophys. 2005, 4392139–153. [DOI] [PubMed] [Google Scholar]
- Donovan E. L.; Pettine S. M.; Hickey M. S.; Hamilton K. L.; Miller B. F. Lipidomic analysis of human plasma reveals ether-linked lipids that are elevated in morbidly obese humans compared to lean. Diabetol. Metab. Syndr. 2013, 5124. [DOI] [PMC free article] [PubMed] [Google Scholar]
- Kim H. J.; Kim J. H.; Noh S.; Hur H. J.; Sung M. J.; Hwang J. T.; Park J. H.; Yang H. J.; Kim M. S.; Kwon D. Y.; Yoon S. H. Metabolomic analysis of livers and serum from high-fat diet induced obese mice. J. Proteome Res. 2011, 102722–731. [DOI] [PubMed] [Google Scholar]
- Flowers M. T.; Ntambi J. M. Role of stearoyl-coenzyme A desaturase in regulating lipid metabolism. Curr. Opin. Lipidol. 2008, 193248–256. [DOI] [PMC free article] [PubMed] [Google Scholar]
- Miyazaki M.; Sampath H.; Liu X.; Flowers M. T.; Chu K.; Dobrzyn A.; Ntambi J. M. Stearoyl-CoA desaturase-1 deficiency attenuates obesity and insulin resistance in leptin-resistant obese mice. Biochem. Biophys. Res. Commun. 2009, 3804818–22. [DOI] [PMC free article] [PubMed] [Google Scholar]
- Miyazaki M.; Flowers M. T.; Sampath H.; Chu K.; Otzelberger C.; Liu X.; Ntambi J. M. Hepatic stearoyl-CoA desaturase-1 deficiency protects mice from carbohydrate-induced adiposity and hepatic steatosis. Cell Metab. 2007, 66484–496. [DOI] [PubMed] [Google Scholar]
- Gutierrez-Juarez R.; Pocai A.; Mulas C.; Ono H.; Bhanot S.; Monia B. P.; Rossetti L. Critical role of stearoyl-CoA desaturase-1 (SCD1) in the onset of diet-induced hepatic insulin resistance. J. Clin. Invest. 2006, 11661686–1695. [DOI] [PMC free article] [PubMed] [Google Scholar]
- Murray G. I.; Melvin W. T.; Greenlee W. F.; Burke M. D. Regulation, function, and tissue-specific expression of cytochrome P450 CYP1B1. Annu. Rev. Pharmacol. Toxicol. 2001, 41, 297–316. [DOI] [PubMed] [Google Scholar]
- Thier R.; Bruning T.; Roos P. H.; Bolt H. M. Cytochrome P450 1B1, a new keystone in gene-environment interactions related to human head and neck cancer?. Arch. Toxicol. 2002, 765–6249–256. [DOI] [PubMed] [Google Scholar]
- Vasiliou V.; Gonzalez F. J. Role of CYP1B1 in glaucoma. Annu. Rev. Pharmacol Toxicol 2008, 48, 333–58. [DOI] [PubMed] [Google Scholar]
- Choudhary D.; Jansson I.; Stoilov I.; Sarfarazi M.; Schenkman J. B. Metabolism of retinoids and arachidonic acid by human and mouse cytochrome P450 1b1. Drug Metab. Dispos. 2004, 328840–847. [DOI] [PubMed] [Google Scholar]
- Iyer A.; Fairlie D. P.; Prins J. B.; Hammock B. D.; Brown L. Inflammatory lipid mediators in adipocyte function and obesity. Nat. Rev. Endocrinol. 2010, 6271–82. [DOI] [PubMed] [Google Scholar]
- Sessler A. M.; Kaur N.; Palta J. P.; Ntambi J. M. Regulation of stearoyl-CoA desaturase 1 mRNA stability by polyunsaturated fatty acids in 3T3-L1 adipocytes. J. Biol. Chem. 1996, 2714729854–29858. [DOI] [PubMed] [Google Scholar]
- Gonzalez F. J. Cytochrome P450 humanised mice. Hum. Genomics 2004, 14300–306. [DOI] [PMC free article] [PubMed] [Google Scholar]
- Gonzalez F. J.; Yu A. M. Cytochrome P450 and xenobiotic receptor humanized mice. Annu. Rev. Pharmacol. Toxicol. 2006, 46, 41–64. [DOI] [PMC free article] [PubMed] [Google Scholar]
- Masubuchi Y.; Iwasa T.; Hosokawa S.; Suzuki T.; Horie T.; Imaoka S.; Funae Y.; Narimatsu S. Selective deficiency of debrisoquine 4-hydroxylase activity in mouse liver microsomes. J. Pharmacol. Exp. Ther. 1997, 28231435–1441. [PubMed] [Google Scholar]
- Li F.; Lu J.; Cheng J.; Wang L.; Matsubara T.; Csanaky I. L.; Klaassen C. D.; Gonzalez F. J.; Ma X. Human PXR modulates hepatotoxicity associated with rifampicin and isoniazid co-therapy. Nat. Med. 2013, 194418–420. [DOI] [PMC free article] [PubMed] [Google Scholar]
Associated Data
This section collects any data citations, data availability statements, or supplementary materials included in this article.