

Abstract
Integral membrane proteins (IMPs) are of great biophysical and clinical interest because of the key role they play in many cellular processes. Here, a comprehensive top down study of 152 IMPs and 277 soluble proteins from human H1299 cells including 11 087 fragments obtained from collisionally activated dissociation (CAD), 6452 from higher-energy collisional dissociation (HCD), and 2981 from electron transfer dissociation (ETD) shows their great utility and complementarity for the identification and characterization of IMPs. A central finding is that ETD is ∼2-fold more likely to cleave in soluble regions than threshold fragmentation methods, whereas the reverse is observed in transmembrane domains with an observed ∼4-fold bias toward CAD and HCD. The location of charges just prior to dissociation is consistent with this directed fragmentation: protons remain localized on basic residues during ETD but easily mobilize along the backbone during collisional activation. The fragmentation driven by these protons, which is most often observed in transmembrane domains, both is of higher yield and occurs over a greater number of backbone cleavage sites. Further, while threshold dissociation events in transmembrane domains are on average 10.1 (CAD) and 9.2 (HCD) residues distant from the nearest charge site (R, K, H, N-terminus), fragmentation is strongly influenced by the N- or C-terminal position relative to that site: the ratio of observed b- to y-fragments is ∼1:3 if the cleavage occurs >7 residues N-terminal and ∼3:1 if it occurs >7 residues C-terminal to the nearest basic site. Threshold dissociation products driven by a mobilized proton appear to be strongly dependent on not only relative position of a charge site but also N- or C-terminal directionality of proton movement.
Integral membrane proteins (IMPs) play a critical part in many cellular processes, including signal transduction and transport of ions, metabolites, and other proteins across lipid membranes.1 With functions that are so central to life, IMPs are important targets of fundamental and pharmacological study. For example, while IMPs are encoded by ∼25% of all known genes, they comprise a staggering ∼70% of current drug targets2,3 often occurring in multiple isoforms and variants arising from alternative splicing and post-translational modification of specific products of multigene families.4
Despite their essential roles in cell biology, precise characterization of whole IMPs remains a challenge for drug developers and proteomicists alike.5 The hydrophobic nature of IMPs and their resultant lack of solubility make them difficult to analyze by traditional bottom up mass spectrometry.6,7 IMP solubility also challenges the “top down” approach in which intact proteins are introduced directly to the mass spectrometer.8,9
Initial work from Whitelegge and Faull, with a focus on the seven-transmembrane helix protein bacteriorhodopsin, demonstrated the potential of top down analysis of IMPs.10,11 More recent reports12,13 have reinforced the viability of top down mass spectrometry for the study of IMPs, including a report by Walker in which sequence tags were derived from the extensive fragmentation of transmembrane domains (TMDs) for the identification of 13 integral membrane proteins.14 A much larger top down study of 83 integral membrane proteins identified from HeLa15 followed Walker’s report and demonstrated that collisionally activated dissociation (CAD) preferentially fragments in TMDs as compared to intracellular or extracellular regions. In general, a greater density of gas-phase fragmentation within the TMDs enables IMPs to be identified, on average, with more confidence than soluble or membrane-associated proteins.
However, the observation of these broad trends has provided little aid in the accurate prediction of the exact sites and relative intensities of peptide fragment ions, largely due to the myriad complicating chemical and physical factors.16,17 Much of the theory behind CAD is based on the “mobile proton model” (MPM), which posits that protons drive fragmentation and are free to translate along the peptide’s polyamide backbone prior to cleavage.18 The MPM, developed by observing the fragmentation of peptide ions, provides a framework for understanding the chemistry of vibrational dissociation in “bottom up” studies.
On the other hand, in-depth studies of CAD fragmentation of the whole protein ions used in top down studies19 have only examined selected standard proteins (myoglobin, ubiquitin, etc.). Although proteins and peptides might, at first, seem analogous, the increased number of charges, heterogeneity of charge site isomers, and potential diversity of higher-order structures can exert significant effects on bond cleavage that are not well understood. The differences in fragmentation between peptides and proteins also extend to electron-based dissociation modalities. As early as 1999, differences between the fragmentation of phosphoproteins compared to phosphopeptides were recognized.20 To the authors’ knowledge, studies of the fragmentation of intact proteins have never been extended to a similar scale of those performed on 2+ and 3+ peptide ions in comprehensive bottom up studies.21,22 Large-scale trends of peptide dissociation from different fragmentation methods have also been reported.23−25
While CAD fragmentation occurs by increasing the internal energy of peptide/protein ions until bond cleavage occurs, electron-based fragmentation, such as electron capture dissociation (ECD)26 or electron transfer dissociation (ETD),27 generally breaks bonds near the location of electron capture or transfer at a protonated site, respectively.28−31 Amazingly, noncovalent bonds from the tertiary structure or bound ligands can be conserved, despite backbone bonds being broken.32 Often attributed to the process being nonergodic, this effect has been used to study gas-phase protein secondary, tertiary, and even quaternary structure.33−37
A recent study by Breuker et al. has shown that the polar helices in the three helix bundle protein KIX are maintained after transfer to the gas-phase, due to the extensive stabilization resulting from salt bridges between basic and acidic residues.38 On the other hand, TMDs generally do not contain these polar residues; survival of their higher-order structures during and after transfer to the gas phase is not guaranteed.
Here, a top down study of 429 proteins, including 152 IMPs from human H1299 cells using 11 087 CAD (RF-style) fragments, 6452 higher-energy collisional dissociation (HCD, beam style) fragments, and 2981 ETD fragments, illustrates the great complementarity between the three methods for identifying and characterizing whole membrane proteins. Given these data, we further investigated bond cleavage patterns with respect to the membrane character of the precursor, the domain from which each cleavage occurs, the local membrane character of each fragment ion, and the effects of proximity of the cleavage to a basic residue (R, K, H, N-terminus).
Experimental Section
Data Collection
Enriched mitochondrial samples were prepared from H1299 cell lines as described previously.39 The resulting samples were separated using the GELFREE 8100 fractionation system (Expedeon, Cambridgeshire, United Kingdom) utilizing 10% T gel columns. The first five fractions, below 30 kDa, were collected for analysis. Following methanol/chloroform/water precipitation to remove SDS, the fractions were resuspended using 20–30 μL of buffer A (95% water, 5% acetonitrile, 0.2% formic acid).
The fractions were then analyzed with denaturing LC-MS using PLRP-S nanocapillary columns on an Orbitrap Elite instrument (Thermo Fisher Scientific) as described previously.39 All fragmentation was performed using a top-two data dependent method and 15 m/z isolation windows. CAD was performed using a q of 0.4, a normalized collision energy of 41, and 100 ms activation time. A 5 ms reaction time was utilized for ETD, and a 20 normalized collision energy was used for HCD. CAD data was acquired from two sets of GELFREE fractions, with one set analyzed in duplicate (16 total LC-MS injections). ETD and HCD data were each acquired from a single GELFrEE analysis (six and five LC-MS injections, respectively).
Data Analysis
Intact precursor and fragment masses from LC-MS/MS files were determined using the in-house software cRAWler, which utilizes Xtract to determine monoisotopic neutral masses from high-resolution precursor and fragment ion spectra. Processed data were further analyzed with a distributed version of ProSightPC 3.0 (Thermo Fisher Scientific) on a 168-core computing cluster using iterative absolute mass search logic with an initial 2.3 Da MS1 precursor tolerance followed by 2000, 20 000, and 100 000 Da windows. If a precursor mass could not be automatically determined, the entire database was searched. Fragment ions were matched using a 10 ppm mass tolerance.
All searches were performed against only “reviewed” entries from the March 2013 release of UniProtKB (2013_03), including 20 248 gene products. Searches with smaller precursor mass windows (2.3 or 2000 Da) were run against a highly annotated (26) PTM Warehouse (21 624 023 theoretical proteoforms), while searches with wider intact tolerance windows utilized a warehouse containing 164 088 proteoforms. The databases are available for download from ftp://prosightftp:gsX1gON@prosightpc.northwestern.edu. Residue-specific transmembrane domain prediction was accomplished using TMHMM v.2.0,40,41 based upon the precise sequence identified by ProSightPC.
A C# program was developed in-house to retrieve the TMHMM scores for each residue N-terminal to the cleavage site of a matching fragment ion; the overall TMHMM score was determined by averaging all such individual TMHMM scores across the entire protein. The same program was also used to find the closest basic residue to each cleavage site. Fragments with no reported m/z value or charge were not included.
Results and Discussion
Sequence coverage maps derived from consecutive ETD and CAD fragmentation scans are shown in Figure 1 for three representative proteins. For these three integral membrane proteins, their predicted TMDs are boxed in orange and their observed c, z· and b, y ions obtained from ETD and CAD, respectively, are indicated in standard fashion. Subunit 7b of cytochrome c oxidase exhibits CAD products from 21 of the 24 available sites within its single TMD, with only 5 of the 22 non-TMD sites cleaved (Figure 1a). Conversely, ETD of the same protein cleaves mostly in the soluble region, where the few products that do originate from the TMDs are only found on the N-terminal boundary near a lysine residue. Interestingly, only five cleavage sites are conserved between the two methods. Two other IMPs, ATP synthase subunit f (Figure 1b) and protein transport protein sec61 beta (Figure 1c), also exhibit high CAD and low ETD coverage in TMDs. The latter contains a phosphorylation at Ser16, which is indicated in pink and survives both fragmentation processes. ETD fragmentation in the soluble regions improves localization of this modification from a 56 to a nine-amino acid region (Figure 1c).
Figure 1.
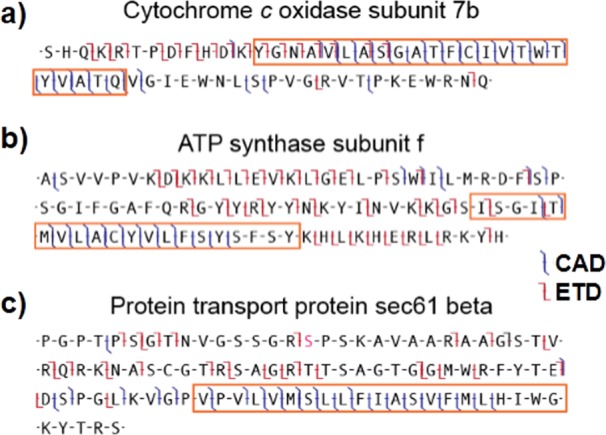
Fragmentation observed from three integral membrane proteins shows cleavage sites for CAD and ETD fragmentation with respect to TMHMM-predicted transmembrane helical regions (orange boxes). The utility of these techniques for localizing a post-translational modification is show in (c), with the phosphorylated serine residue highlighted in pink.
An extension of this analysis to all confidently identified proteins (E value <10–4) is shown in Figure 2a, where the average TMHMM score of the intact protein (computed as the average TMHMM score of every residue in the protein sequence40) is plotted with respect to the average TMHMM score of the observed matched fragment ions from that precursor. Each symbol represents one protein identified by either CAD (350 blue squares, 16 LC-MS injections), HCD (333 green diamonds, 5 LC-MS injections), or ETD (156 red circles, 6 LC-MS injections), where the size of the symbol is proportional to the number of matched fragment ions found from that protein. Soluble proteins lie at or near (0,0), as they have no predicted TMDs, while a hypothetical protein comprised entirely of TMDs will have both an average and matched fragment score of 1 and appear at (1,1). Random fragmentation should result in product ions that have on average the same TMHMM score as that of the entire protein, which is illustrated by the y = x line in Figure 2a. Clustering of CAD and HCD results above the line indicates that these proteins are preferentially fragmented within TMDs, as was predicted from previous studies of CAD in TMDs.15 For proteins identified multiple times during the three CAD runs, the minimum and maximum average TMHMM score from their matched fragments are shown in Figure S1, Supporting Information. Overall, a smaller number of proteins with predicted TMDs were identified in the ETD data set than for either of the collisionally activated methods. IMPs that were identified by ETD generally clustered below the line, corresponding to a higher cleavage propensity in soluble regions.
Figure 2.
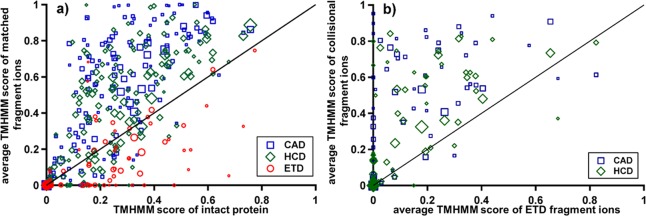
Comparison of average TMHMM scores for whole proteins, with y = x lines indicating where proteins with equal numbers of fragment ions in soluble versus transmembrane domains would fall. The legends display symbols for each dissociation method evaluated (CAD, HCD, and ETD), with symbol size proportional to the total number of matching fragment ions for that protein. (a) Each symbol indicates a protein, with the x-value determined by its overall average TMHMM score and the y-value by the average TMHMM score of its matched fragment ions. (b) A pairwise comparison of proteins plotting their average TMHMM scores for those fragmented using ETD (x-axis) and either CAD or HCD (y-axis); symbol size was drawn using data from the fragmentation method yielding the lowest number of matching fragment ions for that protein.
Due to the previously mentioned disparities in the proteins identified by the different fragmentation techniques, it is necessary to directly compare their cleavage propensities from the same protein. For the proteins identified by both ETD and collisional dissociation (CAD or HCD), a pairwise comparison of 391 proteins is shown (Figure 2b) of the average TMHMM score of ETD fragments with respect to that from CAD fragments (blue squares) and/or HCD fragments (green diamonds). The direct comparison between methods shows an identical trend: HCD and CAD are more likely to cleave in TMDs than ETD. IMP classes not represented here, due to the enriched mitochondrial preparation, include G-protein coupled receptors and other plasma membrane IMPs that may show different behavior, but the strong trends from Figure 2 indicate that this phenomenon is general. The analysis reflects the trends from high-throughput, data-dependent top down studies.42 We did not systematically study the effect of IMP precursor charge state on fragmentation in this report, which has been shown to significantly affect cleavage propensities in soluble proteins.
Whereas residues with high TMHMM scores (∼0.8–1) are almost certainly contained within a TMD, those with intermediate scores (∼0.1–0.7) often lie on the boundaries between membrane-spanning and soluble regions.41 Binning the TMHMM score of observed matching fragment ions and normalizing these against a random set (defined as all possible fragments from all proteins in the data set) shows the regions with the greatest increases or decreases in fragmentation (Figure 3). For example, 4627 HCD fragments were observed with scores between 0 and 0.1, while 40 541 cleavage sites (corresponding to 81 082 fragments) were possible with those same scores from all of the proteins identified in the HCD data set, resulting in a 5.7% cleavage propensity for soluble regions. The majority of increased CAD and HCD fragmentation comes from regions with scores of 0.9 or higher, where ∼16% of all possible fragments are observed from both. Conversely, this is the region of lowest ETD cleavage, with only ∼4% of all possible fragments observed. Intermediate regions, which account for fewer fragments, do show some moderate increase in CAD and HCD cleavage but no obvious decrease in ETD products. Overall, the ratio between the percent of CAD and ETD products observed changes from 0.6 to 3.7 for regions with TMHMM scores of <0.1 and >0.9, respectively. For top down proteomics, this >6-fold preference (3.7/0.6) of fragmentation type translates to a >10 orders-of-magnitude better certainty for identification of the proteins identified with both methods (Figure S2, Supporting Information).
Figure 3.
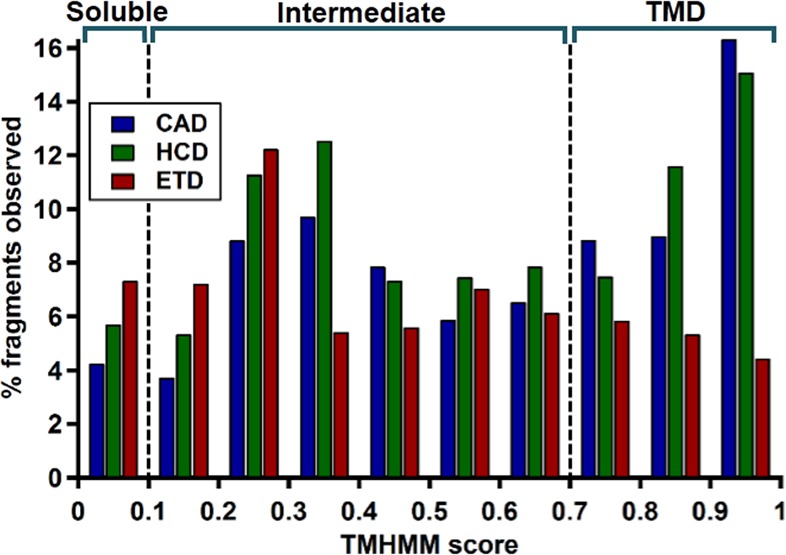
Percentage of fragments observed for CAD, HCD, and ETD with respect to the total number of possible fragments from all proteins identified from each data set binned according to TMHMM score. Scores under 0.1 indicate a soluble protein region, 0.1–0.7 an intermediate, and 0.7–1 a transmembrane domain.
Clear differences exist between CAD/HCD and ETD cleavage propensities across the hundreds of TMDs studied, reflecting a fundamental difference in fragmentation mechanism. ETD generally avoids cleaving within TMDs, likely due to their lack of basic residues, which carry the charges necessary for electron-based cleavages. Whitelegge and co-workers also found very limited ECD cleavage (only 3 fragments were observed) in the TMDs of ATP synthase subunit c from Arabidopsis thaliana but were able to increase fragmentation by vibrationally activating the ions prior to electron-based dissociation.43
ETD fragmentation near TMD boundaries (intermediate TMHMM scores) can be attributed to the presence of a basic residue in the neighboring soluble region. While CAD and HCD also depend on the presence of a charge, their inherent vibrational activation prior to dissociation leads to the mobilization of protons across the protein backbone, allowing for cleavages remote to basic residues.18 In the context of top down proteomics employed at scale, the excellent TMD sequence coverage offered by CAD and HCD provides more confident protein identifications but far fewer fragments in the PTM-rich soluble regions. Complementary ETD fragmentation was often necessary to better localize these PTMs and fully characterize the observed proteoform (as in Figure 1c).
Although threshold dissociation techniques mobilize protons prior to dissociation, current CAD mechanisms require a proton to be localized to the backbone NH or carbonyl directly proximal to the cleavage site.18 The charge must be present even in the middle of TMDs where there are few nearby acidic or basic residues. The mobile proton model would indeed predict a greater heterogeneity of cleavage sites within TMDs, attributable to elevated charge mobility due to the relative lack of proton-sequestering basic residues in these domains.44 Delocalization of these protons would result in a randomization of fragmentation throughout the TMD.14,18 If an individual proton can sample many more sites prior to driving a cleavage event in a TMD, fragment yields (and therefore fragment ion abundances) at each of those cleavage sites should exhibit a corresponding decrease. Figure 4 shows the intensity-weighted TMHMM score of a protein’s matched fragments compared to the average TMHMM score of the intact protein. Similar to Figure 2a, the HCD and CAD symbols cluster above the y = x line indicating not only that their cleavage in TMDs results in more fragment ions but also a higher overall proportion of the total fragment intensity or yield. Again, ETD symbols are clustered below the line, further indicating their aversion to fragmenting in TMDs. The increased “density” of fragment ions from HCD and CAD in TMDs can be explained by examining the original placement and movement of the protein’s charges prior to dissociation.
Figure 4.
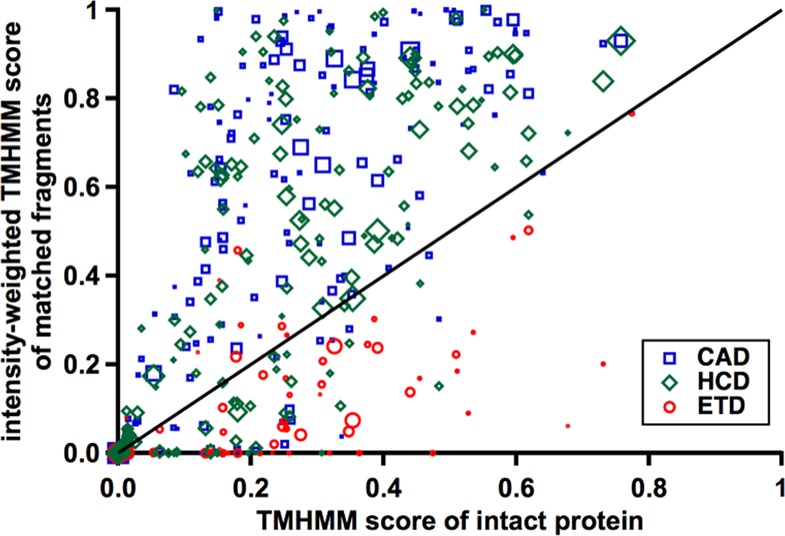
Correlation of the average THMHMM score of the whole protein (x-axis), with the average TMHMM score of matched fragment ions weighted by their observed intensities in the fragmentation spectra (y-axis). Proteins with an equal fragment ion yield from membrane and soluble regions will cluster around the y = x line. The legend displays the symbols corresponding to each dissociation method evaluated (CAD, HCD, and ETD), with symbol size proportional to the total number of matching fragment ions for that protein.
ETD fragmentation in soluble regions provides further evidence for charge sequestration by basic residues during ESI.45 Molecular dynamics simulations indicate that, during electrospray ionization, protons in solution are retained by basic residues, rapidly forming H-bonds with nearby amide NH groups.46 For ECD and ETD, fragmentation occurs where the electron is captured/transferred before the intramolecular vibrational redistribution can occur (∼1–100 ps47), which does not allow for intramolecular proton transfer prior to dissociation. In these cases, the characteristic fragmentation driven by a given charge is deemed its “charge site spectrum” and is almost always localized to within ten residues of the charge-carrying basic side chain.30 Thus, the lower number of ETD fragments in the TMDs can be directly correlated to the lack of basic residues in those regions.
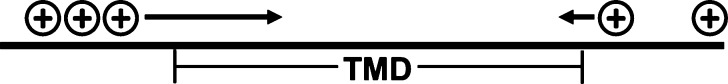
On the other hand, the high density of CAD and HCD fragments in TMDs provides further evidence that they do not require a nearby basic residue to fragment. Coulombic repulsion in the densely charged soluble regions would affect most strongly the charges carried at the border of the TMDs, mobilizing them into the large stretches of nonpolar residues (Scheme 1). However, once these charges are mobilized, they not only are driving cleavage at a greater number of backbone positions (Figure 2) but also are on average cleaving more often than their counterparts in soluble regions (Figure 4). The thermally excited protein ions undoubtedly have greatly disrupted secondary or tertiary structures prior to dissociation; favored cleavage in TMDs can instead be attributed to the movement of the charges themselves. While protons in soluble regions likely retain interaction with a basic side chain, those that have been mobilized are bound primarily to the backbone. Therefore, they can direct cleavage more readily, resulting in a higher overall fragment yield.
Scheme 1.
In order to drive CAD and HCD fragmentation deep within TMDs, the protons must first migrate (either through space or across backbone bonds) from the side chain of a basic residue all the way to the cleavage site. The average distance from the nearest basic residue (R, K, H, N-terminus) of the three dissociation techniques is shown in Figure 5a for fragments with increasing TMHMM scores. To provide a null hypothesis, the average distance between randomized cleavages (vide supra) and the nearest basic residue was calculated for all proteins. Across all observed fragments (TMHMM score ≥0), ETD cleaves 1.2 residues closer than random, while HCD and CAD cleave 1.5 and 2.9 residues farther away than random, respectively. At increasing TMHMM score, fragments are farther away from the nearest basic residues (up to 10.1 for CAD at TMHMM score ≥0.9), which is consistent with the scarcity of basic residues in these regions. The distance between random and observed fragmentation is mostly maintained at higher membrane scores, although HCD cleavages do move closer to random at TMHMM scores approaching 1. Even for fragments limited to TMHMM scores of 0 (not shown), CAD and HCD cleave, on average 1.4 residues and 0.9 residues farther than random, respectively. Binning these fragments by TMHMM scores with a bin size of 0.1 and plotting the differential distance from random (Figure S3, Supporting Information), instead of using a cutoff (Figure 5a), shows that these trends are maintained for regions of all scores.
Figure 5.

The effect of basic residue proximity on fragmentation. (a) The average distance of cleavages to the nearest basic residue (R, K, H, N-terminus) as a function of TMHMM score cutoff for observed fragments and randomized fragmentation from each data set. (b) Distribution of observed fragments with respect to proximity to nearest basic residue for CAD, HCD, and ETD. (c) and (d) Distribution of cleavages for fragments from CAD and HCD as shown in (b) but for fragments with TMHMM scores ≥0.5 and ≥0.9, respectively. The expected distribution based upon random fragmentation is also shown for each case.
In Figure 5b,c, cleavage products are binned by their “relative cleavage site”, which indicates the distance from the nearest basic residue to the cleavage site. Cleavages on the N-terminal side of their basic residue are indicated with negative values and C-terminal cleavages with positive. No zero values exist because cleavages occur between residues, so fragmentation directly adjacent to a basic residue would be considered 1 or −1. Fragment count is normalized so that the area under each curve is 100%. Figure 5b shows this correlation for the number of observed CAD, HCD, and ETD fragments. As expected, the ETD fragments are clustered much more closely around the basic residues, following a quasi-Cauchy distribution. A similar, but slightly broader, distribution is also found for random fragmentation (not shown). Conversely, CAD and HCD fragmentation exhibit a much broader distribution, indicating their propensity to cleave farther away from basic residues. Figure 5c,d shows the same correlation for CAD and HCD with TMHMM scores of ≥0.5 and ≥0.9, respectively. ETD did not produce substantial membrane fragments, and so, results were not included. Random fragmentation from CAD and HCD was computed as the average of the random from each data set. The two vibrational fragmentation methods exhibit a bimodal distribution, with HCD consistently closer to the nearest basic residue than CAD for fragments at TMHMM scores ≥0.5 and ≥0.9. Random fragmentation also shows the same bimodal distribution, which is consistent with the lack of basic residues in TMDs, but its lobes are significantly closer to the basic residue than those from the observed HCD and CAD fragmentation events.
Again, ETD fragmentation occurring consistently ∼1 site closer to basic residues than random provides further evidence that the charges driving the cleavages remain on the basic residues during this process. The few fragments that are observed far away from any basic residues can be attributed to a through space cleavage process, where the protonated basic residue is brought closer to the cleavage site through higher-order protein interactions.48 ETD fragments were very scarce in regions with higher TMHMM scores and were not included in Figure 5c,d.
Conversely, CAD fragmentation cleaves on average almost three residues farther away from the nearest basic residue than random. Surprisingly, the protons driving CAD cleavage are not just delocalized but in fact mobilized farther away from basic residues than would be predicted by a random model. The interaction that drives this mobilization is observed even in the center of TMDs, where cleavage sites are on average ∼10 residues distant from the nearest basic residue. Previous explanations of nonrandomized fragmentation often invoked salt-bridging or other interactions between the basic residues and cleavage site.43 However, very few interactions are possible in the nonpolar regions of an energetically excited protein ion. Indeed, it is most likely that the Coulombic repulsion between nearby charges causes the mobilized protons to migrate toward regions with the lowest charge density: away from basic residues (Scheme 1). HCD fragmentation exhibits cleavages closer to basic residues than CAD, which is consistent with CAD being a slower heating fragmentation process that allows protons slightly more time to migrate toward the center of TMDs prior to cleavage.
Further evidence of the influence of charge migration on collisional fragmentation can be found by examining the “y-fragment enhancement factor,” which is computed as
First defined by Yates and co-workers to study the effect of basic residue location on peptide fragmentation, this factor is a measure of the relative yield of y-fragments with respect to their complementary b-fragments.49 A protein with only matching y-fragments would have an enhancement factor of 1, while one with all b-fragments would lie at −1. Figure 6 shows the y-enhancement factor of CAD and HCD fragments with respect to their distance from the nearest basic residue for all fragments (a) and those with TMHMM scores ≥0.5 (b). However, unlike the previous study, here, only the number of matched fragment ions are considered, not their intensities. The horizontal red line in each represents the average enhancement factor of both CAD and HCD fragments, which was determined as 0.15 for all fragments and 0.08 for those with TMHMM scores ≥0.5. The observed nonzero average value indicates the overall increased stability of y-fragments with respect to b-fragments during cleavage and can be attributed to the tendency for b-fragment to further rearrange, forming a-fragments.50
Figure 6.

y-fragment enhancement factor plotted with respect to proximity to the nearest basic residue (R, K, H, N-terminus) for CAD and HCD for (a) all fragments and (b) fragments with a TMHMM score ≥0.5. The horizontal line indicates the average enhancement factor for each set. Observed b- and y-fragment count used to calculate enhancement factors is shown in (c) and (d).
Surprisingly, there is also a clear dependence between distance from and direction to a basic residue and enhancement factor. A cleavage 7 residues on the N-terminal side of the nearest basic residue has an enhancement factor of ∼0.5 (∼75% chance of a y-fragment), while a similar cleavage 7 residues C-terminal to the nearest basic residue has an enhancement factor of about −0.5 (∼25% chance of a y-fragment). Enhancement approaches the average value for cleavages adjacent to basic residues, but the increase or decrease in y-fragment enhancement extends to cleavages >10 residues distant, including those in TMDs (Figure 6b). The above results are consistent with the general y-fragment enhancement found for peptides with C-terminal basic residues49 and provide further evidence of the effect of charge migration on fragmentation. To rule out detection biases, the same HCD fragments were plotted (Figure S4, Supporting Information) with respect to distance to the closest of three nonbasic residues (F, A, D) with similar total natural abundance. Here, the slight trend can be attributed to the detection biases inherent in the experiment, which likely include biases toward observation of higher-charged fragment ions and the effect of the scan range window. However, this trend is in the opposite direction of that for the basic residues, indicating that the basic residues are in fact responsible for the y-fragment enhancement found in Figure 6.
The enhancement factor results above showed that the ratio of observed b- to y-fragments is ∼1:3 if the cleavage occurs >7 residues N-terminal and ∼3:1 if it occurs >7 residues C-terminal to the nearest basic site. Apparently, CAD and HCD fragmentation is dependent on the relative location of the nearest basic residue. For fragments occurring very near (<3–4 residues) to a basic residue, the protonated side chain can transfer the charge to backbone positions both N- and C-terminal to the future cleavage site. Thus, the proton driving these cleavages can be mobilized from either direction prior to backbone dissociation, and very little b- or y-fragment enhancement is observed. On the other hand, cleavages very distant to any basic residues, such as those found in TMDs, are most likely to be driven by a proton that is mobilized in a specific direction, causing significant b- or y-fragment enhancement. To the authors’ knowledge, this effect is not explained by any previously proposed mechanisms and provides an interesting avenue of study.
Here, we confirm, for >400 proteins (152 of those with significant TMDs), that preferential CAD and HCD fragmentation in TMDs and the corresponding decrease in ETD fragmentation depends critically on the location of the charges driving dissociation. During ETD, the protons driving cleavage remain localized to basic residues and cannot extend into the nonpolar TMDs. Conversely, the charges driving CAD and HCD are mobilized away from those same basic residues. Coulombic repulsion appears to be driving this migration. The charges naturally migrate to TMDs due to their almost complete lack of charge density. While the interactions driving this migration (whose results can be observed >10 residues distant) are not well understood, further evidence of it can be found in the proportion of b- vs y-fragments cleaved by HCD and CAD, which is directly dependent on whether the fragment is N- or C-terminal to the nearest basic residue. To the authors’ knowledge, this is the first strong evidence for the dependence of threshold dissociation on the direction of proton migration.
Conclusions
While many fragmentation studies have been performed on large data sets of digested peptides, no similar information exists for the intact proteins analyzed in top down proteomics. Here, we find that TMDs, as predicted by the TMHMM algorithm, are indeed preferentially cleaved by CAD and HCD but are generally avoided by ETD. From a proteomics standpoint, CAD and HCD can provide excellent sequence coverage of IMPs, aiding in their identification, while ETD helps to localize PTMs by providing more complete information in soluble regions. Further, the prediction of cleavages for scoring using posterior probability models incorporating a priori information will be greatly improved with the inclusion of residues’ TMHMM scores.
The almost complete lack of basic residues in the TMDs is the most likely cause of their interesting fragmentation properties. ETD is simply too localized to basic residues to cleave in TMDs, while the protons driving CAD and HCD are pushed there due to repulsion from those same basic residues. Although fragmentation by mobilized protons is difficult to characterize, it is clearly one of the main driving forces in protein fragmentation.
Acknowledgments
This work was supported by the National Institute of General Medical Sciences of the National Institutes of Health under award number R01 GM067193 (N.L.K.). Additional support was provided by the UIUC Center for Neuroproteomics on Cell to Cell Signaling (P30 DA018310), the Chicago Biomedical Consortium with support from The Searle Funds at The Chicago Community Trust, and the Robert H. Lurie Comprehensive Cancer Center. The content is solely the responsibility of the authors and does not necessarily represent the official views of the National Institutes of Health. A.D.C. would like to acknowledge the ACS Division of Analytical Chemistry for their support.
Supporting Information Available
Increased confidence in protein identification and further fragmentation results. This material is available free of charge via the Internet at http://pubs.acs.org.
Author Contributions
† O.S.S. and A.D.C. contributed equally.
The authors declare no competing financial interest.
Funding Statement
National Institutes of Health, United States
Supplementary Material
References
- Alberts B.; Bray D.; Hopkin K.; Johnson A.; Lewis J.; Raff M.; Roberts K.; Walter P.. Essential Cell Biology; Garland Science: New York, 2009. [Google Scholar]
- Wallin E.; von Heijne G. Protein Sci. 1998, 7, 1029. [DOI] [PMC free article] [PubMed] [Google Scholar]
- Stevens T. J.; Arkin I. T. Proteins: Struct., Funct., Genet. 2000, 39, 417. [DOI] [PubMed] [Google Scholar]
- Huber C. G.; Timperio A. M.; Zolla L. J. Biol. Chem. 2001, 276, 45755. [DOI] [PubMed] [Google Scholar]
- Hopkins A. L.; Groom C. R. Nat. Rev. Drug Discovery 2002, 1, 727. [DOI] [PubMed] [Google Scholar]
- Wu C. C.; Yates J. R. Nat. Biotechnol. 2003, 21, 262. [DOI] [PubMed] [Google Scholar]
- Speers A. E.; Wu C. C. Chem. Rev. 2007, 107, 3687. [DOI] [PubMed] [Google Scholar]
- Kelleher N. L. Anal. Chem. 2004, 76, 196 A. [PubMed] [Google Scholar]
- Tipton J. D.; Tran J. C.; Catherman A. D.; Ahlf D. R.; Durbin K. R.; Kelleher N. L. J. Biol. Chem. 2011, 286, 25451. [DOI] [PMC free article] [PubMed] [Google Scholar]
- Whitelegge J. P.; Gundersen C. B.; Faull K. F. Protein Sci. 1998, 7, 1423. [DOI] [PMC free article] [PubMed] [Google Scholar]
- Whitelegge J. P. Photosynth. Res. 2003, 78, 265. [DOI] [PubMed] [Google Scholar]
- Thangaraj B.; Ryan C. M.; Souda P.; Krause K.; Faull K. F.; Weber A. P. M.; Fromme P.; Whitelegge J. P. Proteomics 2010, 10, 3644. [DOI] [PMC free article] [PubMed] [Google Scholar]
- Ryan C. M.; Souda P.; Bassilian S.; Ujwal R.; Zhang J.; Abramson J.; Ping P. P.; Durazo A.; Bowie J. U.; Hasan S. S.; Baniulis D.; Cramer W. A.; Faull K. F.; Whitelegge J. P. Mol. Cell. Proteomics 2010, 9, 791. [DOI] [PMC free article] [PubMed] [Google Scholar]
- Carroll J.; Altman M. C.; Fearnley I. M.; Walker J. E. Proc. Natl. Acad. Sci. U. S. A. 2007, 104, 14330. [DOI] [PMC free article] [PubMed] [Google Scholar]
- Catherman A. D.; Li M.; Tran J. C.; Durbin K. R.; Compton P. D.; Early B. P.; Thomas P. M.; Kelleher N. L. Anal. Chem. 2013, 85, 1880. [DOI] [PMC free article] [PubMed] [Google Scholar]
- Smith R. D.; Loo J. A.; Barinaga C. J.; Edmonds C. G.; Udseth H. R. J. Am. Soc. Mass Spectrom. 1990, 1, 53. [DOI] [PubMed] [Google Scholar]
- Loo J. A.; Quinn J. P.; Ryu S. I.; Henry K. D.; Senko M. W.; McLafferty F. W. Proc. Natl. Acad. Sci. U. S. A. 1992, 89, 286. [DOI] [PMC free article] [PubMed] [Google Scholar]
- Dongre A. R.; Jones J. L.; Somogyi A.; Wysocki V. H. J. Am. Chem. Soc. 1996, 118, 8365. [Google Scholar]
- Kelleher N. L.; Lin H. Y.; Valaskovic G. A.; Aaserud D. J.; Fridriksson E. K.; McLafferty F. W. J. Am. Chem. Soc. 1999, 121, 806. [Google Scholar]
- Meng F. Y.; Cargile B. J.; Miller L. M.; Forbes A. J.; Johnson J. R.; Kelleher N. L. Nat. Biotechnol. 2001, 19, 952. [DOI] [PubMed] [Google Scholar]
- Falth M.; Savitski M. M.; Nielsen M. L.; Kjeldsen F.; Andren P. E.; Zubarev R. A. J. Proteome Res. 2007, 6, 4063. [DOI] [PubMed] [Google Scholar]
- Huang Y.; Triscari J. M.; Tseng G. C.; Pasa-Tolic L.; Lipton M. S.; Smith R. D.; Wysocki V. H. Anal. Chem. 2005, 77, 5800. [DOI] [PMC free article] [PubMed] [Google Scholar]
- Kim S.; Mischerikow N.; Bandeira N.; Navarro J. D.; Wich L.; Mohammed S.; Heck A. J.; Pevzner P. A. Mol. Cell. Proteomics 2010, 9, 2840. [DOI] [PMC free article] [PubMed] [Google Scholar]
- Aguiar M.; Haas W.; Beausoleil S. A.; Rush J.; Gygi S. P. J. Proteome Res. 2010, 9, 3103. [DOI] [PMC free article] [PubMed] [Google Scholar]
- Phanstiel D.; Zhang Y.; Marto J. A.; Coon J. J. J. Am. Soc. Mass Spectrom. 2008, 19, 1255. [DOI] [PMC free article] [PubMed] [Google Scholar]
- Zubarev R. A.; Kelleher N. L.; McLafferty F. W. J. Am. Chem. Soc. 1998, 120, 3265. [Google Scholar]
- Syka J. E. P.; Coon J. J.; Schroeder M. J.; Shabanowitz J.; Hunt D. F. Proc. Natl. Acad. Sci. U. S. A. 2004, 101, 9528. [DOI] [PMC free article] [PubMed] [Google Scholar]
- Breuker K.; Oh H.; Horn D. M.; Cerda B. A.; McLafferty F. W. J. Am. Chem. Soc. 2002, 124, 6407. [DOI] [PubMed] [Google Scholar]
- Sohn C. H.; Chung C. K.; Yin S.; Ramachandran P.; Loo J. A.; Beauchamp J. L. J. Am. Chem. Soc. 2009, 131, 5444. [DOI] [PMC free article] [PubMed] [Google Scholar]
- Skinner O.; Breuker K.; McLafferty F. J. Am. Soc. Mass Spectrom. 2013, 24, 807. [DOI] [PMC free article] [PubMed] [Google Scholar]
- Kruger N. A.; Zubarev R. A.; Carpenter B. K.; Kelleher N. L.; Horn D. M.; McLafferty F. W. Int. J. Mass Spectrom. 1999, 182–183, 1. [Google Scholar]
- Zubarev R. A.; Haselmann K. F.; Budnik B.; Kjeldsen F.; Jensen F. Eur. J. Mass Spectrom. 2002, 8, 337. [Google Scholar]
- Zhang H.; Cui W.; Wen J.; Blankenship R. E.; Gross M. L. J. Am. Soc. Mass Spectrom. 2010, 21, 1966. [DOI] [PMC free article] [PubMed] [Google Scholar]
- Zhang H.; Cui W.; Wen J.; Blankenship R. E.; Gross M. L. Anal. Chem. 2011, 83, 5598. [DOI] [PMC free article] [PubMed] [Google Scholar]
- Breuker K.; Oh H.; Lin C.; Carpenter B. K.; McLafferty F. W. Proc. Natl. Acad. Sci. U. S. A. 2004, 101, 14011. [DOI] [PMC free article] [PubMed] [Google Scholar]
- Zubarev R. A.; Horn D. M.; Fridriksson E. K.; Kelleher N. L.; Kruger N. A.; Lewis M. A.; Carpenter B. K.; McLafferty F. W. Anal. Chem. 2000, 72, 563. [DOI] [PubMed] [Google Scholar]
- Schennach M.; Breuker K. Angew. Chem. 2014, 126, 168. [DOI] [PMC free article] [PubMed] [Google Scholar]
- Breuker K.; Brüschweiler S.; Tollinger M. Angew. Chem., Int. Ed. 2011, 50, 873. [DOI] [PMC free article] [PubMed] [Google Scholar]
- Catherman A. D.; Durbin K. R.; Ahlf D. R.; Early B. P.; Fellers R. T.; Tran J. C.; Thomas P. M.; Kelleher N. L. Mol. Cell. Proteomics 2013, 12, 3465. [DOI] [PMC free article] [PubMed] [Google Scholar]
- Sonnhammer E. L.; von Heijne G.; Krogh A. Proc. Int. Conf. Intell. Syst. Mol. Biol. 1998, 6, 175. [PubMed] [Google Scholar]
- Krogh A.; Larsson B.; von Heijne G.; Sonnhammer E. L. J. Mol. Biol. 2001, 305, 567. [DOI] [PubMed] [Google Scholar]
- Durbin K. R.; Fellers R. T.; Ntai I.; Kelleher N. L.; Compton P. D. Anal. Chem. 2014, 86, 1485–1492. [DOI] [PMC free article] [PubMed] [Google Scholar]
- Zabrouskov V.; Whitelegge J. P. J. Proteome Res. 2007, 6, 2205. [DOI] [PubMed] [Google Scholar]
- Iavarone A. T.; Williams E. R. J. Am. Chem. Soc. 2003, 125, 2319. [DOI] [PMC free article] [PubMed] [Google Scholar]
- Schnier P. D.; Gross D. S.; Williams E. R. J. Am. Soc. Mass Spectrom. 1995, 6, 1086. [DOI] [PubMed] [Google Scholar]
- Steinberg M. Z.; Elber R.; McLafferty F. W.; Gerber R. B.; Breuker K. ChemBioChem 2008, 9, 2417. [DOI] [PMC free article] [PubMed] [Google Scholar]
- Henry E. R.; Eaton W. A.; Hochstrasser R. M. Proc. Natl. Acad. Sci. U. S. A. 1986, 83, 8982. [DOI] [PMC free article] [PubMed] [Google Scholar]
- Neff D.; Sobczyk M.; Simons J. Int. J. Mass Spectrom. 2008, 276, 91. [Google Scholar]
- Tabb D. L.; Huang Y.; Wysocki V. H.; Yates J. R. 3rd Anal. Chem. 2004, 76, 1243. [DOI] [PMC free article] [PubMed] [Google Scholar]
- Wysocki V. H.; Resing K. A.; Zhang Q.; Cheng G. Methods 2005, 35, 211. [DOI] [PubMed] [Google Scholar]
Associated Data
This section collects any data citations, data availability statements, or supplementary materials included in this article.