

Abstract
The intrahepatic biliary destruction of primary biliary cirrhosis (PBC) appears secondary to a multi-lineage response that includes autoantibodies, biliary apotopes, and cellular responses. Although there has been considerable effort in defining the role and specificity of anti-mitochondrial autoantibodies, a major challenge has been the characterization of T effector pathways. This difficulty is due in part to the limitation of current technologies for directly isolating and characterizing autoreactive T cells from patients. Herein, we successfully demonstrate a novel technology for characterizing the surface phenotype of T cell oligoclonal expansions directly ex vivo. Using PBC as a prototypic disease we were able to detect clonal T cell expansions in 15/15 patients examined. Although the T cell expansions from different patients expressed different TCR Vβ gene segments, the surface phenotype of the cells was the same. The clonal T cell expansions in PBC patients are CX3CR1+ Fas+ effector-memory T cells, a finding of particular importance given the known up-regulation of fractalkine on injured biliary epithelial cells (BEC). In contrast to the persistent aberrantly expanded T cells observed in the PBC patients, T cell expansions detected in response to a herpes viral infection were very dynamic and resolved over time. This protocol can be used to characterize T cell expansions in other autoimmune diseases.
Keywords: Autoimmunity, Immunoscope, Primary Biliary Cirrhosis, CX3CR1, T cell repertoire analysis, CCR7
1. Introduction
We have chosen to gain insight into the pathophysiology of T cell mediated autoimmune diseases by identifying and characterizing the T cells involved. T cell oligoclonal expansions have been detected in the setting of autoimmunity and are generally considered evidence in favor of an antigen-specific immune response driving the disease pathology [1–6]. However, the clonally expanded T cells have rarely been characterized in detail.
There are a variety of techniques that can be employed to study pathogenic T cells. One powerful approach is to characterize bulk lymphocyte populations by flow cytometry. This technique can detect both cell surface and intracellular molecules. Patients with autoimmunity can be compared to healthy controls and multicolor flow cytometry can identify the presence of unique lymphocyte populations. Unfortunately, the pathogenic T cell component sometimes comprises only a small fraction of the peripheral T cell repertoire. Thus, observed differences can be relatively small and difficult to interpret. In addition, flow cytometry cannot identify individual T cell clones from within a bulk population of lymphocytes. Another strategy is to culture autoreactive T cells directly from the peripheral blood or inflamed tissue. This technique has several advantages. For one, the antigen specificity of the T cell clone is known. Once cloned, the T cells are available for in vitro cellular assays that can identify the cell’s cytokine secretion profile, intracellular signaling pathways, and expression pattern of co-receptors and adhesion molecules, among other things. The T cell receptor (TCR) expressed by the cloned cell can also be identified. Although this strategy is very powerful, it also has many limitations. One of the most concerning is that autoreactive T cells can be easily isolated from healthy controls [7], thus, their simple presence does not verify that they are participating in the pathogenic immune response. T cells may also alter their cytokine secretion profile and their cell surface phenotype after prolonged in vitro culturing [8]. Lastly, assumptions are usually made during T cell cloning. For example, a self-antigen must be chosen to stimulate the autoreactive T cell clones and, unfortunately, different self-antigens may be dominant in different individuals suffering from the same autoimmune disease. If investigators chose the wrong antigen for the cloning process, they might select for a T cell population that does not play a dominant role in the pathophysiology of that particular patient’s disease.
One technique that was once very popular but has now become somewhat passé is T cell repertoire analysis. The main advantage of this technique is that it allows for individual T cell expansions to be detected from within a bulk population of lymphocytes. This technique divides the T cell repertoire based upon the lengths of the TCRs’ complementarity determining region 3 (CDR3) and the different variable gene segments that encode this region [9]. The assumption is that T cell expansions seen in the setting of autoimmunity are involved in the autoreactive immune response. The major limitation of this technique is that it cannot further characterize the putatively pathogenic T cell beyond identifying the TCR it expresses.
We hypothesized that oligoclonal T cell expansions would be found in patients with primary biliary cirrhosis (PBC). This hypothesis was based in part on previous observations that patients with PBC have PDC-E2-specific CD4 and CD8 T cells [10–13]. However, since antigen specific T cell clones comprise only a small fraction of the peripheral T cell repertoire, it is extremely difficult to define their cellular and molecular characteristics without first culturing them in vitro.
Herein, we demonstrate a novel technology for characterizing the surface phenotype of T cell oligoclonal expansions directly ex vivo. Specifically, we have combined CDR3-length T cell repertoire analysis with magnetic cell sorting and flow cytometry to directly characterize the surface phenotype of T cell clonal expansions. Our results demonstrate that the clonal T cell expansions detected in PBC patients are CX3CR1+ Fas+ effector-memory cells. This protocol will allow for the further characterization of other immune mediated diseases.
2. Methods
2.1. Subjects
Fifteen patients with PBC and 16 healthy controls were included in this study. The diagnosis of PBC was based on internationally accepted criteria as previously described [14]. Subjects were excluded if they had malignancies or were using immunosuppressive drugs. The age of the patients are outlined in Table 1. Informed consent was obtained in writing from each patient and the Institutional Review Board for Human Research approved the study.
Table 1.
T Cell expansions detected in PBC patients and healthy controls
| PBC | Healthy Control | ||||
|---|---|---|---|---|---|
| ID | Age | T cell expansions | ID | Age | T cell expansions |
| BD01 | 58 | 2, 3, (6), 11, 16, 21, 22, 23 | DM | 40 | 1, 3, 11, 13A, 16, 21, 24 |
| TC06 | 53 | 1, 3, 4, 5a, 5b, 7, 13b, 14, 16, 18, 20, 22, 23 | BS3 | 40 | 4, 15, 20, 22, 23 |
| JS08 | 78 | 3, 4, 7, 22 | BS4 | 57 | - |
| BM11 | 51 | 11, 17, 22 | BS5 | 64 | 1, 2, 4, 12, 13B, 22 |
| TW13 | 50 | 1, 2, 3, 4, 8, 9, 22, 23 | BS6 | 52 | 9, 24 |
| 2SLS | 51 | 1, 2, 13a, 14, 23 | BS7 | 64 | 3, 4, 5B 9, 12, 15, 16, 17 |
| 3MFE | 73 | 2, 3, 5a, 5b, 7, 8, 11, 12, 13b, 14, 15, 16, 17, 18, 20, 21, 22 | BS8 | 66 | - |
| 9LN | 61 | (7), 11, (22), 23 | BS9 | 64 | 7, 13B |
| 15AS | 66 | (7), 12, 13b, 15, 17, (22), 23 | BS10 | 44 | - |
| 23BS | NR | 1, 7, 11, 17, 18, 22, 23 | BS11 | 49 | 1, 3, 9, 13B |
| 52CN | 62 | (2), 7, 11, 14, 22, 23 | EM | 40 | - |
| DS17 | NR | (3), 13b, 15, (17), (22), 23 | YO | 42 | - |
| JM19 | NR | 3, 5b, 7, (14), 16, 17, 23 | VS | 68 | - |
| LE20 | NR | 1, (5b), 7, 9, 13b, 15, (16), 20, 22 | SS | 56 | - |
| CC56 | 56 | 11, 15, 13b, 16, 18, (22), 23 | SC | NR | - |
| JV | NR | 2, 4, 8, 12, 13A, 13B, 22, 23 | |||
2.2. Preparation of peripheral blood cells
Fresh peripheral blood was collected into a BD Vacutainer® CPT™ Cell Preparation Tube with Sodium Citrate (BD Franklin Lakes, NJ). Peripheral blood mononuclear cells were isolated. Two lymph node homing receptors CD62L and CCR7 were employed for isolation of memory cells. Essentially, total PBMCs were divided into two aliquots. One aliquot was incubated with anti-CD62L microbeads for separation of CD62L positive and negative fractions using magnetic cell sorting (Miltenyi Biotec Inc, Auburn, CA). Another aliquot was stained with PE conjugated anti-human CCR7 antibody (BD Biosciences, San Jose, CA) followed by anti-PE microbeads incubation for magnetic separation of CCR7 positive and negative fractions (Stemcell Technologies, Vancouver, Canada). The purity of CD62L negative population and CCR7 negative population were assessed by flow cytometry. To collect highly purified CD62L− (>90%), the CD62L− fraction was passed through an LD depletion column (Miltenyi Biotec Inc). Four different subsets, namely CD62L+, CCR7+, CD62L−, and CCR7− were subjected to CDR3-length T cell repertoire analysis.
To estimate the CD4 and CD8 T cell repertoire diversity, we separated effector-memory T (CD62L negative) cells into CD4+ and CD8+ populations. First, CD62L negative sorted cells were incubated with anti-CD4 or anti-CD8 microbeads and divided into either CD62L−CD4+ or CD62L−CD8+ populations using magnetic cell sorting (Miltenyi Biotec Inc). The purity of CD62L−CD4+ or CD62L−CD8+ was assessed by flow cytometry (>90%). Then, the CD62L−CD4+ or CD62L−CD8+ subpopulations were subjected to CDR3-length TCRVβ repertoire analysis. This identified expanded T cell populations as being either CD4+ or CD8+.
2.3. CDR3-length analysis of TCRVβ gene segments
The clonal T cell expansions were identified by CDR3-length analysis of TCRVβ gene segments as previously described [15]. Total RNA was extracted immediately from sorted cells by using a RNeasy Mini Kit (QIAGEN, Valencia, CA). RNA quantities were determined using a Nanodrop ND-100 spectrophotometer (Thermo Scientific, West Palm Beach, FL). cDNA was then synthesized by reverse transcription using SuperScript® III Reverse Transcriptase kit (Invitrogen, Carlsbad, CA). From each cDNA, PCR reactions were performed using Vβ primers and a common Cβ primer HTCB3: GACAGCGGAAGTGGTTGCGGGGT.
Using first-round PCR products as a template, Vβ primers and a common fluorescent-conjugated (6-FAM) Cβ primer HTCB1: FAM-TTGGGTGTGGGAGATCTCTGC was applied to a run-off PCR reaction. PCR products were then analyzed on an ABI 3100 Prism Genetic Analyzer (Applied Biosystems, Carlsbad, CA) and Peak Scanner Software v1.0 (Applied Biosystems). The relative intensity of signal (RIS) values were calculated as the area under the experimental peak divided by the area under the control peak found within a Gaussian distribution. Peaks were normalized before division. RIS values >4 were considered significant [16–19].
2.4. Sequencing of Expanded T cell clone
TCRVβ expansions were first identified by CDR3-length analysis. This allowed us to apply nucleotide sequencing of the CDR3 region to determine whether the T cell expansion was oligoclonal. The Vβ22 T cell expansion from Patient BD01 was found in the effector-memory population (CD62L− fraction) and CD62L−CD8+ population, but not in the CD62L−CD4+ population. Therefore, total RNA was isolated from the CD62L− and CD62L−CD8+ populations using a RNeasy Plus Mini Kit (QIAGEN), and then cDNA was synthesized by reverse transcription using the SuperScript® III Reverse Transcriptase kit (Invitrogen). cDNA was amplified with Vβ22 and HTCB3-specific primers and Phusion™ Hot Start High-Fidelity DNA Polymerase (Finnzyme F-540). After adding deoxyadenosine (A) to the 3′ ends of PCR products, PCR products were TA ligated and cloned into PCR 2.1-TOPO vector using the PCR 2.1-TOPO TA Cloning Kit (Invitrogen) according to the manufacturer’s instructions. cDNA-containing plasmid DNA was extracted using QIAprep 96 Turbo Miniprep Kit (QIAGEN) and sequenced with M13 primers. Amino acid sequences of CDR3 were analyzed and identified with IMGT-V-Quest software (Immunogenetics Information System; http://www.imgt.org/IMGT_vquest).
2.5. Flow Cytometry Analysis of clonally expanded T cells
CD62L positive cells and negative cells were stained with a specific PE-conjugated anti-TCRVβ antibody for Vβ4, Vβ22, Vβ23, FITC-conjugated anti-TCRVβ16, Vβ22 (Beckman Coulter, Brea, CA), PerCP-conjugated anti-CD4 and CD8 antibodies (Biolegend, San Diego, CA), and a panel of antibodies against CD45RO, CD27, CD57, CD69, CCR5, CCR7, CXCR1, CXCR5, CX3CR1, Fas, and FasL (BD Biosciences). Stained cells were analyzed using a FACScan flow cytometer (BD Bioscience) that was upgraded by Cytec Development (Fremont, CA), which allows for five-color analysis. Data were analyzed utilizing CELLQUEST software (BD Bioscience). Appropriate known positive and negative controls were used throughout.
2.6. Statistical Analysis
Values for the percentage of clonally expanded CD45RO, CD27, CD57, CCR7, CX3CR1, and Fas positive T cells in PBC patients were compared to non-expanded controls in PBC patients. The data are presented as the mean ± SEM. Two-sample comparisons were analyzed using the two-tailed Mann-Whitney U test. A value of p < 0.05 was considered statistically significant.
3. Results
3.1. Clonotypic T cell expansions are predominantly present in the peripheral effector memory T cell population
Because autoreactive T cells can reside at relatively low frequencies in the peripheral blood, we first sought to identify a protocol that would increase the sensitivity of traditional T cell repertoire analysis. To accomplish this, we took into account that effector memory T cells lose expression of both CCR7 and CD62L. Thus, PBMCs were equally divided into two populations, one sorted for the presence of CCR7 and the other for CD62L. Magnetic beads and depleting columns were used for cell sorting. RNA was then extracted from the four resulting populations (CCR7+, CCR7−, CD62L+, and CD62L−) and CDR3-length T cell repertoire analysis was conducted. Fig. 1 reveals that T cell expansions were predominantly in the effector memory population, virtually identical in the CCR7− and CD62L− populations (Vβ5A Vβ8 Vβ13B Vβ22, and Vβ23). However, they were consistently larger in the CD62L− population. This was also true for other patients examined (data not shown). Importantly, these two different sorting strategies independently verified that oligoclonal expansions are present in patients with PBC and that these expansions are predominantly present in the effector memory population. All patients (15/15) with PBC had strong T cell expansions detected by this method, while only half (8/16) of the control patients had detectable T cell expansions (Table 1).
Fig. 1.
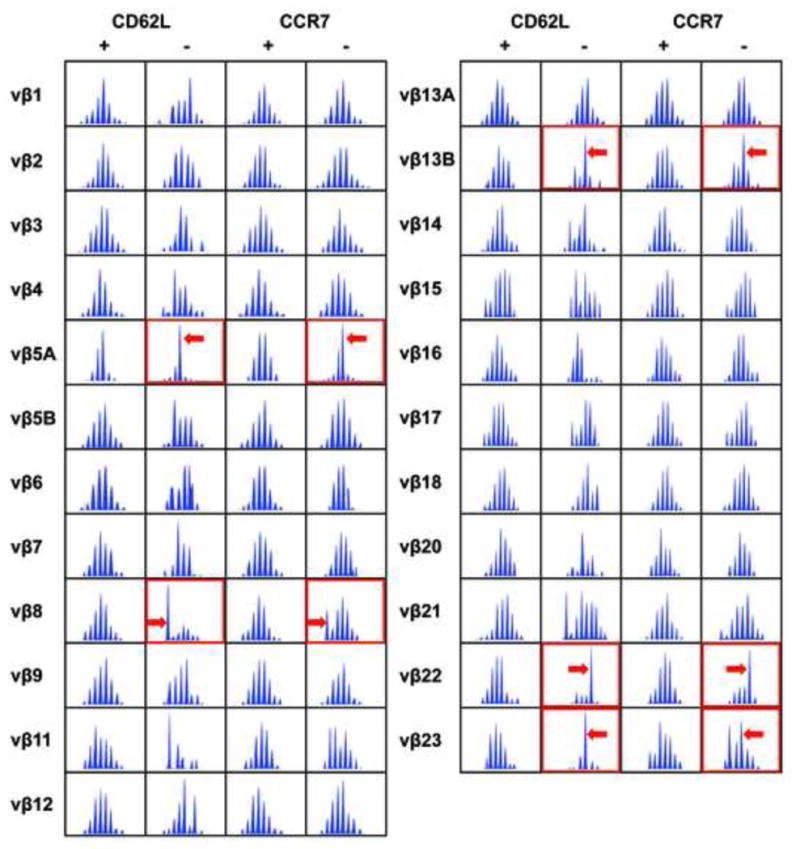
PBC patients have dominant T cell expansions belonging to their peripheral effector memory pool. PBMCs were sorted into four populations using magnetic beads and antibodies specific to CCR7 or CD62L, markers known to be down regulated on effector memory T cells. The resulting populations were then subjected to TCR Vβ CDR3-length repertoire analysis. All spectra are shown. With this technique, if there is no detectable T cell expansion within a Vβ spectrum, a Gaussian distribution of CDR-3 lengths is observed. In contrast, clonal expansions are observed as a perturbation of this Gaussian distribution. There were no strong expansions detected in the CD62L+ and CCR7+ populations. In contrast, several spectratype expansions were found in CD62L− or CCR7− populations, as indicated by arrows.
3.2. An additional magnetic sort can further characterize the T cell expansion as either CD4 or CD8 positive
Conducting repertoire analysis on CD62L negative and positive fractions easily identifies T cell expansions from within peripheral leukocyte populations, but it does not further characterize these expansions. Knowing whether or not they are CD4 or CD8 positive will be of importance to understanding the pathophysiology of autoimmunity. Thus, PBMCs were sorted for the presence or absence of CD62L as described above and the resulting CD62L− populations were sorted again, this time for the presence or absence of CD8. By this method we were able to determine that the Vβ22 expansion detected in Fig. 1 expressed CD8 on its surface (Fig. 2). The second sort was performed four months later, so the expansion was stable over this time period, and thus it was not specific to a transient pathogen. Table 1 reveals that patients with PBC had both CD4 and CD8 positive T cell expansions, though there were more CD8 positive expansions.
Fig. 2.
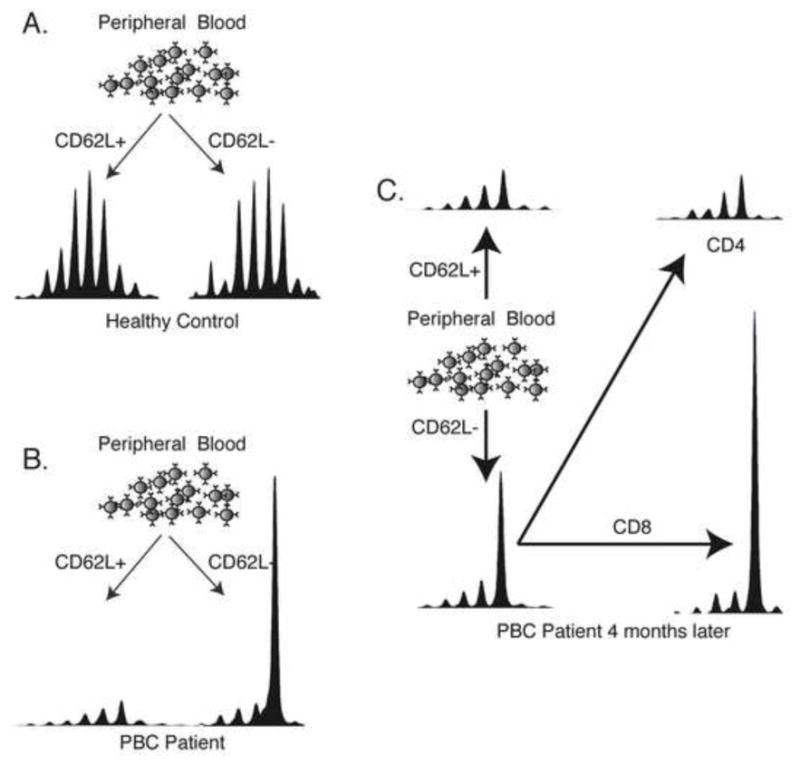
Additional sorting identifies T cell clonal expansions as either CD4+ or CD8+. A) The buffy coat obtained from a healthy control was sorted into CD62L+ and CD62L− populations. Vβ22 spectra are shown at 5x scale. The Gaussian distributions of these spectra indicate that there are no clonal expansions present. B) The same protocol performed on a patient with PBC reveals a large clonotypic expansion present in the CD62L- population. Results are shown at 1x scale. C) 4 months later, this same expansion was observed. Further sorting reveals that the expansion is a CD8+ T cell (1x scale).
3.3. Expansions detected by T cell repertoire analysis are clonal
T cell expansions detected in mice are often oligoclonal, or have multiple DNA sequences that encode for the same amino acid sequence [20, 21]. Thus, a T cell expansion detected by repertoire analysis in the mouse is often the result of several very similar T cell clones expanding in response to an antigenic stimulus. To determine if the detected T cell expansions of the PBC patients were oligoclonal, we performed DNA sequencing of cloned TCR cDNA. Table 2 reveals that the expanded CD62L− CD8+ Vβ22 T cell clone is monoclonal. These results were also consistent with the spectratype profile. Since the CD62L− population contains both CD4 and CD8 cells, and there is no obvious expansion in the CD4+ CD62L− population in Patient BD01(Fig. 2), the frequency of expanded clone was only 75.6% in the CD62L− population, whereas it was 95.2% in the CD8+ CD62L− population (Table 2).
Table 2.
Amino acid sequences of CDR3 of Vb22 TCRs from Patient BD01
| Populations | V-GENE | J-GENE | D-GENE | CDR3 Length | AA JUNCTION | Frequency (%) |
|---|---|---|---|---|---|---|
| CD62L− | TRBV2 | TRBJ2-1 | TRBD1 | 9 | CASTQGGEQFF | 1/41 (2.4) |
| TRBV2 | TRBJ2-3 | TRBD1 | 10 | CASGDRARTQYF | 1/41 (2.4) | |
| TRBV2 | TRBJ2-1 | TRBD2 | 11 | CASDGLAPNEQFF | 1/41 (2.4) | |
| TRBV2 | TRBJ2-1 | TRBD1 | 11 | CASSPDRGHEQFF | 1/41 (2.4) | |
| TRBV2 | TRBJ1-3 | TRBD1 | 12 | CARSRGDSGNTIYF | 1/41 (2.4) | |
| TRBV2 | TRBJ1-6 | TRBD1 | 12 | CASSAQGFDSPLHF | 1/41 (2.4) | |
| TRBV2 | TRBJ2-3 | TRBD2 | 12 | CASSVLGIRNTQYF | 1/41 (2.4) | |
| TRBV2 | TRBJ1-1 | TRBD1 | 13 | CASRDRAYSNTEAFF | 1/41 (2.4) | |
| TRBV2 | TRBJ2-5 | TRBD1 | 13 | CASSEARLSRETQYF | 2/41 (4.9) | |
| TRBV2 | TRBJ1-5 | TRBD1 | 13 | CASSGGPDSNQPQHF | 31/41 (75.6) | |
| CD8+CD62L− | TRBV2 | TRBJ1-5 | TRBD1 | 12 | CASSEDGGNQPQHF | 1/42 (2.4) |
| TRBV2 | TRBJ2-3 | TRBD2 | 13 | CASIVSGPSTDTQYF | 1/42 (2.4) | |
| TRBV2 | TRBJ1-5 | TRBD1 | 13 | CASSGGPDSNQPQHF | 40/42 (95.2) |
3.4. Expanded T cell clones highly express CX3CR1 and several activation molecules
Following the identification of clonally expanded T cells and determining their expression of CD4 or CD8, we next sought to further characterize the individual cells by flow cytometry. We first enriched the PBMCs for the clone of interest by following the same magnetic sorting protocol just described. Then corresponding anti-Vβ antibodies and a panel of antibodies to various effector and activation markers were used to characterize the surface phenotype of the T cell expansions. Although the expression profile of every clone within the expanded set was not perfectly matched, as a whole the expansions were fairly homogeneous. Each expansion had a significant increase in the expression of CD45RO (86.98 ± 5.26 % vs. 47.01 ± 10.80 %, p < 0.05), CD57 (69.50 ± 17.55 % vs. 2.475 ± 0.39 %, p < 0.05), Fas (98.45 ± 0.60 % vs. 38.01 ± 6.74 %, p < 0.05), and CX3CR1 (71.81 ± 7.00 % vs. 2.888 ± 0.76 %, p < 0.05) when compared to un-expanded T cell populations from the same patient. Also of interest was the finding that the surface phenotype of the CD4 and CD8 T cell expansions were very similar. Both CD4 and CD8 T cell expansions had a high percentage of T cells bearing CD45RO+, CD57+, Fas+, and CX3CR1+ (the receptor for fractalkine). They also lacked expression of CCR7 (Fig. 3). Because fractalkine (CX3CL1) is known to be upregulated on activated-endothelial cells [22], the expanded CX3CR1-expressing T cells detected in our analysis will be especially poised to migrate into the injured liver.
Fig. 3.

A multistep strategy reveals the surface phenotype of the clonally expanded T cells. PBMCs were separated into CD62L− and CD62L+ fractions using magnetic beads, and the resulting samples underwent TCRVβ CDR3-length T cell repertoire analysis. Expansions were identified in the CD62L− population, data not shown. Staining with specific anti-Vβ antibodies and a panel of other antibodies, the phenotype of clonally expansion T subsets was characterized by Flow Cytometry. (A) Clonally expanded Vβ22T cells detected in the CD8+ CD62L− T cell fraction isolated from Patient BD01, Vβ4 T cells in the CD4+ CD62L− T cells isolated from Patient BM11, and Vβ23 T cells in the CD4+ CD62L− and CD8+ CD62L− T cells isolated from Patient TW13 were analyzed by Flow Cytometry. (B) Compared with non-expansion controls, clonally expanded Vβ subpopulations have an effector memory phenotype and a significant increase in CD45RO, CD57, CCR7, CX3CR1, and Fas expression (* p < 0.05).
Importantly, without the knowledge gained from T cell repertoire analysis and the magnetic bead sorting step, flow cytometry would have been unable to characterize the surface phenotype of the individual T cell expansions, which normally resides in comparatively low numbers among other non-expanded T cells. Using our novel protocol, we were able to characterize the surface of just the putatively pathogenic clones, which comprised less than 0.1% of the peripheral blood PBMCs.
3.5. Recurrent viral infection results in transient T cell expansions
PBC patients underwent two or more blood draws separated by a minimum of 3 months. At each time point, T cell repertoire analysis was repeated and the detected expansions were virtually identical at each time point (data not shown). Healthy control, JV, also underwent two blood draws and the T cell expansions detected at each time point were also identical. Thus, it is possible that a recurrent viral infection could be responsible for the sustained T cell expansions observed in these patients. To investigate this further, a patient experiencing an outbreak of herpes labialis was enrolled in our study. Fig. 4 reveals that during her herpes outbreak, numerous T cell expansions were detected; three of these are depicted here. However, 6 months and 12 months later, these expansions were undetectable. Thus, a normally functioning immune system is very dynamic, allowing for rapid expansions and contractions of T cells. Therefore, we can conclude that PBC patients and a fraction of healthy controls have aberrant chronically expanded circulating T cells.
Fig. 4.

Healthy control mounts a dynamic T cell response after recurrent viral exposure. Blood was drawn from a healthy control approximately 4 days after small grouped vesicles appeared on her cutaneous upper lip, indicating herpes viral infection. PBMCs were isolated and sorted into CD62L positive and negative fractions. Vβ3, Vβ7, and Vβ16 T cell expansions were identified at the 4 day time point but were undetectable at 6 and 12 months.
4. Discussion
We demonstrated that the surface phenotype of clonally expanded T cells can be characterized directly ex vivo without the need of prolonged in vitro culturing. To our knowledge, this is the first report on the cellular characteristics of T cell clonal expansions in patients with PBC.
During a typical immune response the initial antigen encounter triggers a massive clonal expansion inducing the differentiation of naïve T cells into effector T cells. Ideally, this rapid T cell expansion is followed by a contraction phase to avoid immunopathology after the antigen or infection is cleared [23–25] (Fig. 4). However, intrinsic T cell defects or disease states might render immune systems more susceptible to sustained unopposed T cell responses, which may result in the development of autoimmunity [25–27]. In the setting of autoimmunity, there is accumulating evidence that the organ-specific destruction is mediated by cellular immune responses, particularly T cells [28, 29]. PBC is an organ-specific autoimmune liver disease characterized by mononuclear cell infiltrates in the portal tracts. The infiltrates are comprised predominantly of CD4+ and CD8+ T cells [30–32].
Oligoclonal expansions have been observed in the CD8+ CD57+ T cell population of rheumatoid arthritis (RA) patients [33]. Likewise, autoreactive CD8 T cells are currently believed to be a major effector cell type responsible for some of the tissue damage seen in PBC [34, 35]. Furthermore, proinflammatory IFN-γ-producing PDC-E2-specific CD8+ cytotoxic T lymphocytes were found in the liver of patients with PBC [13], and a mouse model of PBC also demonstrated a prominent role of CD8 T cells in liver pathogenesis [36]. Finally, immunohistochemistry analysis of liver biopsy specimens revealed increased CD3+ CD57+ T cells within the portal tracts in patients with PBC, particularly around injured interlobular bile ducts [37]. Based on these findings, a positive correlation between the clonally expanded CD8+ CD57+ T cells observed in our study and the pathogenesis of PBC is plausible. Seven of the control patients also had T cell expansions and in prior studies, up to 50% of healthy individuals have shown T cell expansions in their peripheral CD8 T cell repertoire [38]. Thus, the observed T cell expansions in our PBC patients are not necessarily autoreactive. This is a major drawback of our study. Unlike many reports of T cell expanions in healthy controls, our PBC patients had expansions in both their CD4 and CD8 T cell populations (Fig. 3).
A critical component of the pathogenesis of autoimmunity is the ability of T cells to be recruited to the target organ. By providing signals for lymphocyte adhesion, migration, and retention, chemokines and cellular adhesion molecules contribute to the pathogenesis and progression of inflammatory diseases. CX3CR1 is a seven-transmembrane G-protein-coupled chemokine receptor dominantly expressed on NK cells, monocytes, dendritic cells, and some T cells [39]. Its high-affinity ligand is fractalkine, also known as CX3CL1, a novel fourth class of chemokine. Fractalkine is a unique transmembrane molecule with a CX3C-motif and a mucin-like stalk. Fractalkine/CX3CR1 interactions mediate both cell adhesion and migration [22, 39, 40]. Up-regulation of fractalkine has been observed on injured biliary epithelial cells (BEC) and in the serum of patients with PBC [41], in the lesional tissue of patients with Crohn’s disease, and in the serum of patients with allergic asthma [42–44]. Moreover, it has been reported that CX3CR1-positive mononuclear cells and CX3CR1-positive intraepithelial lymphocytes are found in the portal tracts and injured bile ducts, respectively, of patients with PBC [41, 45]. This evidence supports the pathogenic nature of the characterized T cell expansions in our PBC patients.
This paper is part of a special dedicated issue in honor of Chella David. Dr. David’s contributions to immunology have been enormous and we especially note his willingness to provide unique mouse strains without the burdens of MTAs that are so often required. This issue is part of a special series of the Journal of Autoimmunity and Autoimmunity Reviews that honors autoimmunologists including Ian Mackay, Noel Rose, Harry Moutsopoulos, but also has included special dedicated issues that attempt to focus on critical problems of geoepidemiology and especially treatment. This current issue likewise attempts to provide a broad overview of these critical areas [46–63].
Footnotes
The authors declare that they have no conflict of interest.
Publisher's Disclaimer: This is a PDF file of an unedited manuscript that has been accepted for publication. As a service to our customers we are providing this early version of the manuscript. The manuscript will undergo copyediting, typesetting, and review of the resulting proof before it is published in its final citable form. Please note that during the production process errors may be discovered which could affect the content, and all legal disclaimers that apply to the journal pertain.
References
- 1.Wucherpfennig KW, Ota K, Endo N, Seidman JG, Rosenzweig A, Weiner HL, et al. Shared human T cell receptor V beta usage to immunodominant regions of myelin basic protein. Science. 1990;248:1016–9. doi: 10.1126/science.1693015. [DOI] [PubMed] [Google Scholar]
- 2.Pluschke G, Ricken G, Taube H, Kroninger S, Melchers I, Peter HH, et al. Biased T cell receptor V alpha region repertoire in the synovial fluid of rheumatoid arthritis patients. Eur J Immunol. 1991;21:2749–54. doi: 10.1002/eji.1830211115. [DOI] [PubMed] [Google Scholar]
- 3.Waase I, Kayser C, Carlson PJ, Goronzy JJ, Weyand CM. Oligoclonal T cell proliferation in patients with rheumatoid arthritis and their unaffected siblings. Arthritis Rheum. 1996;39:904–13. doi: 10.1002/art.1780390606. [DOI] [PubMed] [Google Scholar]
- 4.Hingorani R, Monteiro J, Furie R, Chartash E, Navarrete C, Pergolizzi R, et al. Oligoclonality of V beta 3 TCR chains in the CD8+ T cell population of rheumatoid arthritis patients. J Immunol. 1996;156:852–8. [PubMed] [Google Scholar]
- 5.Wagner UG, Koetz K, Weyand CM, Goronzy JJ. Perturbation of the T cell repertoire in rheumatoid arthritis. Proc Natl Acad Sci U S A. 1998;95:14447–52. doi: 10.1073/pnas.95.24.14447. [DOI] [PMC free article] [PubMed] [Google Scholar]
- 6.Hwang HY, Bahk YY, Kim TG, Kim TY. Identification of a commonly used CDR3 region of infiltrating T cells expressing Vbeta13 and Vbeta15 derived from psoriasis patients. J Invest Dermatol. 2003;120:359–64. doi: 10.1046/j.1523-1747.2003.12055.x. [DOI] [PubMed] [Google Scholar]
- 7.Pette M, Fujita K, Kitze B, Whitaker JN, Albert E, Kappos L, et al. Myelin basic protein-specific T lymphocyte lines from MS patients and healthy individuals. Neurology. 1990;40:1770–6. doi: 10.1212/wnl.40.11.1770. [DOI] [PubMed] [Google Scholar]
- 8.Baron JL, Madri JA, Ruddle NH, Hashim G, Janeway CA., Jr Surface expression of alpha 4 integrin by CD4 T cells is required for their entry into brain parenchyma. J Exp Med. 1993;177:57–68. doi: 10.1084/jem.177.1.57. [DOI] [PMC free article] [PubMed] [Google Scholar]
- 9.Pannetier C, Cochet M, Darche S, Casrouge A, Zoller M, Kourilsky P. The sizes of the CDR3 hypervariable regions of the murine T-cell receptor beta chains vary as a function of the recombined germ-line segments. Proc Natl Acad Sci U S A. 1993;90:4319–23. doi: 10.1073/pnas.90.9.4319. [DOI] [PMC free article] [PubMed] [Google Scholar]
- 10.Gershwin ME, Mackay IR. The causes of primary biliary cirrhosis: Convenient and inconvenient truths. Hepatology. 2008;47:737–45. doi: 10.1002/hep.22042. [DOI] [PubMed] [Google Scholar]
- 11.Coppel RL, Gershwin ME. Primary biliary cirrhosis: the molecule and the mimic. Immunol Rev. 1995;144:17–49. doi: 10.1111/j.1600-065x.1995.tb00064.x. [DOI] [PubMed] [Google Scholar]
- 12.Kita H, Lian ZX, Van de Water J, He XS, Matsumura S, Kaplan M, et al. Identification of HLA-A2-restricted CD8(+) cytotoxic T cell responses in primary biliary cirrhosis: T cell activation is augmented by immune complexes cross-presented by dendritic cells. J Exp Med. 2002;195:113–23. doi: 10.1084/jem.20010956. [DOI] [PMC free article] [PubMed] [Google Scholar]
- 13.Kita H, Matsumura S, He XS, Ansari AA, Lian ZX, Van de Water J, et al. Quantitative and functional analysis of PDC-E2-specific autoreactive cytotoxic T lymphocytes in primary biliary cirrhosis. J Clin Invest. 2002;109:1231–40. doi: 10.1172/JCI14698. [DOI] [PMC free article] [PubMed] [Google Scholar]
- 14.Talwalkar JA, Lindor KD. Primary biliary cirrhosis. Lancet. 2003;362:53–61. doi: 10.1016/S0140-6736(03)13808-1. [DOI] [PubMed] [Google Scholar]
- 15.Menezes JS, van den Elzen P, Thornes J, Huffman D, Droin NM, Maverakis E, et al. A public T cell clonotype within a heterogeneous autoreactive repertoire is dominant in driving EAE. J Clin Invest. 2007;117:2176–85. doi: 10.1172/JCI28277. [DOI] [PMC free article] [PubMed] [Google Scholar]
- 16.Cibotti R, Cabaniols JP, Pannetier C, Delarbre C, Vergnon I, Kanellopoulos JM, et al. Public and private V beta T cell receptor repertoires against hen egg white lysozyme (HEL) in nontransgenic versus HEL transgenic mice. J Exp Med. 1994;180:861–72. doi: 10.1084/jem.180.3.861. [DOI] [PMC free article] [PubMed] [Google Scholar]
- 17.Maverakis E, Menezes JS, Ametani A, Han M, Stevens DB, He Y, et al. Molecular mimics can induce a nonautoaggressive repertoire that preempts induction of autoimmunity. Proc Natl Acad Sci U S A. 2010;107:2550–5. doi: 10.1073/pnas.0914508107. [DOI] [PMC free article] [PubMed] [Google Scholar]
- 18.Maverakis E, Beech JT, Wilson SS, Quinn A, Pedersen B, Sercarz EE. T cell receptor complementarity determining region 3 length analysis reveals the absence of a characteristic public T cell repertoire in neonatal tolerance. The response in the “tolerant” mouse within the residual repertoire is quantitatively similar but qualitatively different. J Exp Med. 2000;191:695–702. doi: 10.1084/jem.191.4.695. [DOI] [PMC free article] [PubMed] [Google Scholar]
- 19.Maverakis E, Beech J, Stevens DB, Ametani A, Brossay L, van den Elzen P, et al. Autoreactive T cells can be protected from tolerance induction through competition by flanking determinants for access to class II MHC. Proc Natl Acad Sci U S A. 2003;100:5342–7. doi: 10.1073/pnas.0936151100. [DOI] [PMC free article] [PubMed] [Google Scholar]
- 20.Venturi V, Price DA, Douek DC, Davenport MP. The molecular basis for public T-cell responses? Nat Rev Immunol. 2008;8:231–8. doi: 10.1038/nri2260. [DOI] [PubMed] [Google Scholar]
- 21.Menezes JS, van den Elzen P, Thornes J, Huffman D, Droin NM, Maverakis E, et al. A public T cell clonotype within a heterogeneous autoreactive repertoire is dominant in driving EAE. J Clin Invest. 2007;117:2176–85. doi: 10.1172/JCI28277. [DOI] [PMC free article] [PubMed] [Google Scholar]
- 22.Bazan JF, Bacon KB, Hardiman G, Wang W, Soo K, Rossi D, et al. A new class of membrane-bound chemokine with a CX3C motif. Nature. 1997;385:640–4. doi: 10.1038/385640a0. [DOI] [PubMed] [Google Scholar]
- 23.Marrack P, Kappler J. Control of T cell viability. Annu Rev Immunol. 2004;22:765–87. doi: 10.1146/annurev.immunol.22.012703.104554. [DOI] [PubMed] [Google Scholar]
- 24.Sanjabi S, Mosaheb MM, Flavell RA. Opposing effects of TGF-beta and IL-15 cytokines control the number of short-lived effector CD8+ T cells. Immunity. 2009;31:131–44. doi: 10.1016/j.immuni.2009.04.020. [DOI] [PMC free article] [PubMed] [Google Scholar]
- 25.Lan RY, Cheng C, Lian ZX, Tsuneyama K, Yang GX, Moritoki Y, et al. Liver-targeted and peripheral blood alterations of regulatory T cells in primary biliary cirrhosis. Hepatology. 2006;43:729–37. doi: 10.1002/hep.21123. [DOI] [PubMed] [Google Scholar]
- 26.Kong PL, Odegard JM, Bouzahzah F, Choi JY, Eardley LD, Zielinski CE, et al. Intrinsic T cell defects in systemic autoimmunity. Ann N Y Acad Sci. 2003;987:60–7. doi: 10.1111/j.1749-6632.2003.tb06033.x. [DOI] [PubMed] [Google Scholar]
- 27.Torgerson TR, Ochs HD. Regulatory T cells in primary immunodeficiency diseases. Curr Opin Allergy Clin Immunol. 2007;7:515–21. doi: 10.1097/ACI.0b013e3282f1a27a. [DOI] [PubMed] [Google Scholar]
- 28.Katsifis GE, Moutsopoulos NM, Wahl SM. T lymphocytes in Sjogren’s syndrome: contributors to and regulators of pathophysiology. Clin Rev Allergy Immunol. 2007;32:252–64. doi: 10.1007/s12016-007-8011-8. [DOI] [PubMed] [Google Scholar]
- 29.Selmi C, Lleo A, Pasini S, Zuin M, Gershwin ME. Innate immunity and primary biliary cirrhosis. Curr Mol Med. 2009;9:45–51. doi: 10.2174/156652409787314525. [DOI] [PubMed] [Google Scholar]
- 30.Shimoda S, Miyakawa H, Nakamura M, Ishibashi H, Kikuchi K, Kita H, et al. CD4 T-cell autoreactivity to the mitochondrial autoantigen PDC-E2 in AMA-negative primary biliary cirrhosis. J Autoimmun. 2008;31:110–5. doi: 10.1016/j.jaut.2008.05.003. [DOI] [PubMed] [Google Scholar]
- 31.Hashimoto E, Lindor KD, Homburger HA, Dickson ER, Czaja AJ, Wiesner RH, et al. Immunohistochemical characterization of hepatic lymphocytes in primary biliary cirrhosis in comparison with primary sclerosing cholangitis and autoimmune chronic active hepatitis. Mayo Clin Proc. 1993;68:1049–55. doi: 10.1016/s0025-6196(12)60897-0. [DOI] [PubMed] [Google Scholar]
- 32.Shimizu M, Yuh K, Aoyama S, Ichihara I, Watanabe H, Shijo H, et al. Immunohistochemical characterization of inflammatory infiltrates at the site of bile duct injury in primary biliary cirrhosis. Liver. 1986;6:1–6. doi: 10.1111/j.1600-0676.1986.tb00260.x. [DOI] [PubMed] [Google Scholar]
- 33.Morley JK, Batliwalla FM, Hingorani R, Gregersen PK. Oligoclonal CD8+ T cells are preferentially expanded in the CD57+ subset. J Immunol. 1995;154:6182–90. [PubMed] [Google Scholar]
- 34.Selmi C, Meda F, Kasangian A, Invernizzi P, Tian Z, Lian Z, et al. Experimental evidence on the immunopathogenesis of primary biliary cirrhosis. Cell Mol Immunol. 2010;7:1–10. doi: 10.1038/cmi.2009.104. [DOI] [PMC free article] [PubMed] [Google Scholar]
- 35.Shimoda S, Ishikawa F, Kamihira T, Komori A, Niiro H, Baba E, et al. Autoreactive T-cell responses in primary biliary cirrhosis are proinflammatory whereas those of controls are regulatory. Gastroenterology. 2006;131:606–18. doi: 10.1053/j.gastro.2006.05.056. [DOI] [PubMed] [Google Scholar]
- 36.Yang GX, Lian ZX, Chuang YH, Moritoki Y, Lan RY, Wakabayashi K, et al. Adoptive transfer of CD8(+) T cells from transforming growth factor beta receptor type II (dominant negative form) induces autoimmune cholangitis in mice. Hepatology. 2008;47:1974–82. doi: 10.1002/hep.22226. [DOI] [PMC free article] [PubMed] [Google Scholar]
- 37.Harada K, Isse K, Tsuneyama K, Ohta H, Nakanuma Y. Accumulating CD57 + CD3 + natural killer T cells are related to intrahepatic bile duct lesions in primary biliary cirrhosis. Liver Int. 2003;23:94–100. doi: 10.1034/j.1600-0676.2003.00807.x. [DOI] [PubMed] [Google Scholar]
- 38.Hingorani R, Choi IH, Akolkar P, Gulwani-Akolkar B, Pergolizzi R, Silver J, et al. Clonal predominance of T cell receptors within the CD8+ CD45RO+ subset in normal human subjects. J Immunol. 1993;151:5762–9. [PubMed] [Google Scholar]
- 39.Imai T, Hieshima K, Haskell C, Baba M, Nagira M, Nishimura M, et al. Identification and molecular characterization of fractalkine receptor CX3CR1, which mediates both leukocyte migration and adhesion. Cell. 1997;91:521–30. doi: 10.1016/s0092-8674(00)80438-9. [DOI] [PubMed] [Google Scholar]
- 40.Fong AM, Robinson LA, Steeber DA, Tedder TF, Yoshie O, Imai T, et al. Fractalkine and CX3CR1 mediate a novel mechanism of leukocyte capture, firm adhesion, and activation under physiologic flow. J Exp Med. 1998;188:1413–9. doi: 10.1084/jem.188.8.1413. [DOI] [PMC free article] [PubMed] [Google Scholar]
- 41.Shimoda S, Harada K, Niiro H, Taketomi A, Maehara Y, Tsuneyama K, et al. CX3CL1 (fractalkine): a signpost for biliary inflammation in primary biliary cirrhosis. Hepatology. 2010;51:567–75. doi: 10.1002/hep.23318. [DOI] [PMC free article] [PubMed] [Google Scholar]
- 42.Brand S, Hofbauer K, Dambacher J, Schnitzler F, Staudinger T, Pfennig S, et al. Increased expression of the chemokine fractalkine in Crohn’s disease and association of the fractalkine receptor T280M polymorphism with a fibrostenosing disease Phenotype. Am J Gastroenterol. 2006;101:99–106. doi: 10.1111/j.1572-0241.2005.00361.x. [DOI] [PubMed] [Google Scholar]
- 43.Rimaniol AC, Till SJ, Garcia G, Capel F, Godot V, Balabanian K, et al. The CX3C chemokine fractalkine in allergic asthma and rhinitis. J Allergy Clin Immunol. 2003;112:1139–46. doi: 10.1016/j.jaci.2003.09.041. [DOI] [PubMed] [Google Scholar]
- 44.D’Haese JG, Demir IE, Friess H, Ceyhan GO. Fractalkine/CX3CR1: why a single chemokine-receptor duo bears a major and unique therapeutic potential. Expert Opin Ther Targets. 2010;14:207–19. doi: 10.1517/14728220903540265. [DOI] [PubMed] [Google Scholar]
- 45.Isse K, Harada K, Zen Y, Kamihira T, Shimoda S, Harada M, et al. Fractalkine and CX3CR1 are involved in the recruitment of intraepithelial lymphocytes of intrahepatic bile ducts. Hepatology. 2005;41:506–16. doi: 10.1002/hep.20582. [DOI] [PubMed] [Google Scholar]
- 46.Youinou P. Haralampos M. Moutsopoulos: A lifetime in autoimmunity. J Autoimmun. 2010;35:171–175. doi: 10.1016/j.jaut.2010.06.003. [DOI] [PubMed] [Google Scholar]
- 47.Miyagawa F, Gutermuth J, Zhang H, Katz SI. The use of mouse models to better understand mechanisms of autoimmunity and tolerance. J Autoimmun. 2010;35:192–198. doi: 10.1016/j.jaut.2010.06.007. [DOI] [PMC free article] [PubMed] [Google Scholar]
- 48.Mackay IR, Leskovsek NV, Rose NR. The odd couple: A fresh look at autoimmunity and immunodeficiency. J Autoimun. 2010;35:199–205. doi: 10.1016/j.jaut.2010.06.008. [DOI] [PubMed] [Google Scholar]
- 49.Youinou P, Pers J-O. The international symposium on Sjogren’s syndrome in Brest: The “top of the tops” at the “tip of the tips”. Autoimmun Rev. 2010;9:589–590. doi: 10.1016/j.autrev.2010.05.014. [DOI] [PubMed] [Google Scholar]
- 50.Takahashi H, Yamamoto M, Suzuki C, Naishiro Y, Shinomura Y, Imai K. The birthday of a new syndrome: IgG4-related diseases constitute a clinical entity. Autoimmun Rev. 2010;9:591–594. doi: 10.1016/j.autrev.2010.05.003. [DOI] [PubMed] [Google Scholar]
- 51.Ansari AA, Gershwin ME. Navigating the passage between Charybdis and Scylla: Recognizing the achievements of Noel Rose. J Autoimmun. 2009;33:165–169. doi: 10.1016/j.jaut.2009.07.007. [DOI] [PubMed] [Google Scholar]
- 52.Mackay IR. Clustering and commonalities among autoimmune diseases. J Autoimmun. 2009;33:170–177. doi: 10.1016/j.jaut.2009.09.006. [DOI] [PubMed] [Google Scholar]
- 53.Kong Y-CM, Morris GP, Brown NK, Yan Y, Flynn JC, David CS. Autoimmune thyroiditis: A model uniquely suited to probe regulatory T cell function. J Autoimmun. 2009;33:239–246. doi: 10.1016/j.jaut.2009.09.004. [DOI] [PMC free article] [PubMed] [Google Scholar]
- 54.Invernizzi P, Gershwin ME. The genetics of human autoimmune disease. J Autoimmun. 2009;33:290–299. doi: 10.1016/j.jaut.2009.07.008. [DOI] [PubMed] [Google Scholar]
- 55.Gualtierotti R, Biggioggero M, Penatti AE, Meroni PL. Updating on the pathogenesis of systemic lupus erythematosus. Autoimmun Rev. 2010;10:3–7. doi: 10.1016/j.autrev.2010.09.007. [DOI] [PubMed] [Google Scholar]
- 56.Torres-Aguilar H, Blank M, Jara LJ, Shoenfeld Y. Tolerogenic dendritic cells in autoimmune diseases: Crucial players in induction and prevention of autoimmunity. Autoimmun Rev. 2010;10:8–17. doi: 10.1016/j.autrev.2010.07.015. [DOI] [PubMed] [Google Scholar]
- 57.Smith PP, Gordon C. Systemic lupus erythematosus: Clinical presentations. Autoimmun Rev. 2010;10:43–45. doi: 10.1016/j.autrev.2010.08.016. [DOI] [PubMed] [Google Scholar]
- 58.Doria A, Zen M, Canova M, Bettio S, Bassi N, Nalotto L, Rampudda M, Ghirardello A, Iaccarino L. SLE diagnosis and treatment: When early is early. Autoimmun Rev. 2010;10:55–60. doi: 10.1016/j.autrev.2010.08.014. [DOI] [PubMed] [Google Scholar]
- 59.Youinou P, Pers J-O, Gershwin ME, Shoenfeld Y. Geo-epidemiology and autoimunity. J Autoimmun. 2010;34:J163–J167. doi: 10.1016/j.jaut.2009.12.005. [DOI] [PubMed] [Google Scholar]
- 60.Brooks WH, Le Dantec C, Pers J-O, Youinou P, Renaudineau Y. Epigenetics and autoimunity. J Autoimmun. 2010;34:J207–J219. doi: 10.1016/j.jaut.2009.12.006. [DOI] [PubMed] [Google Scholar]
- 61.Chang C, Gershwin ME. Drugs and autoimmunity - A contemporary review and mechanistic approach. J Autoimmun. 2010;34:J266–J275. doi: 10.1016/j.jaut.2009.11.012. [DOI] [PubMed] [Google Scholar]
- 62.Hemminki K, Li X, Sundquist J, Sundquist K. The epidemiology of Graves’ disease: Evidence of a genetic and an environmental contribution. J Autoimmun. 2010;34:J307–J313. doi: 10.1016/j.jaut.2009.11.019. [DOI] [PubMed] [Google Scholar]
- 63.Tomer Y. Hepatitis C and interferon induced thyroiditis. J Autoimmunity. 2010;34:J322–J326. doi: 10.1016/j.jaut.2009.11.008. [DOI] [PMC free article] [PubMed] [Google Scholar]