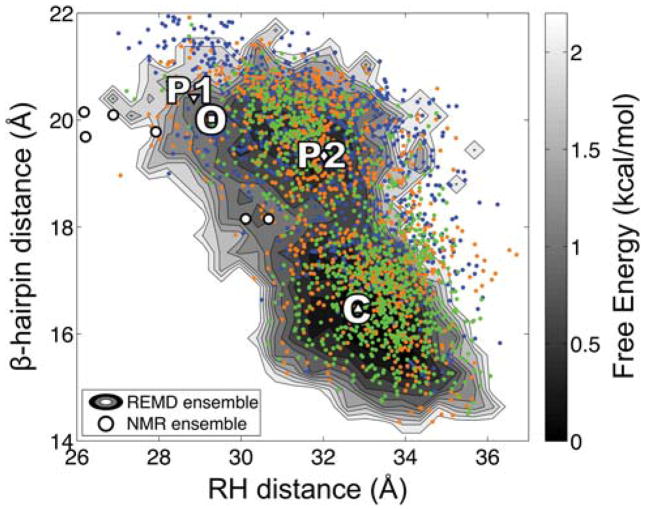
Figure 3.
Comparison of conformational sampling during solution simulation of WT and mutant Cro. The coordinates corresponding to the β-hairpin and RH distances for snapshots extracted from REMD simulation of mutant Cro are plotted over the two-dimensional free energy surface computed from REMD simulations of the WT Cro dimer.20 Blue, orange, and green points represent snapshots extracted from 0–10, 10–20, and 20–30 ns, respectively, during the mutant trajectory. The coordinates of the four X-ray structures are indicated on the surface: WT apo (C, closed), WT DNA-bound (O, fully open), PSQ mutant form 1 (P1, fully open) and form 2 (P2, semi-open). The coordinates of P1 denote the initial configuration for simulation of the mutant dimer. The NMR models are indicated by circles. Details pertaining to the construction of the free energy surface can be found in a previous publication.20

