

Abstract
Lipolysis is defined as the hydrolytic cleavage of ester bonds in triglycerides (TGs), resulting in the generation of fatty acids (FAs) and glycerol. The two major TG pools in the body of vertebrates comprise intracellular TGs and plasma/nutritional TGs. Accordingly, this leads to the discrimination between intracellular and intravascular/gastrointestinal lipolysis, respectively. This chapter focuses exclusively on intracellular lipolysis, referred to as lipolysis herein. The lipolytic cleavage of TGs occurs in essentially all cells and tissues of the body. In all of them, the resulting FAs are utilized endogenously for energy production or biosynthetic pathways with one exception, white adipose tissue (WAT). WAT releases FAs and glycerol to supply nonadipose tissues at times of nutrient deprivation. The fundamental role of lipolysis in lipid and energy homeostasis requires the accurate measurement of lipase activities and lipolytic rates. The recent discovery of new enzymes and regulators that mediate the hydrolysis of TG has made these measurements more complex. Here, we describe detailed methodology for how to measure lipolysis and specific enzymes’ activities in cells, organs, and their respective extracts.
1. INTRODUCTION
In times of abundant nutrients, virtually all eukaryotic organisms are able to store excess energy in form of triglycerides (TGs) that can be reutilized in times of nutrient deprivation or high-energy demand. In all cell types, TGs are stored in lipid droplets (LDs) composed of variable amounts of neutral lipids, phospholipids, and LD-associated proteins. Vertebrates, in particular, have developed white adipose tissue (WAT) as a highly specialized tissue for the deposition and remobilization of TG. In WAT, a tight balance between lipolysis and lipogenesis controls homeostasis and body composition. Dysregulation of this balance leads to either obesity or lipodystrophy. In nonadipose tissues, TG storage is normally much more short term with a small number of LDs and a high LD turnover. Nevertheless, lipolysis is also essential in nonadipose tissues for instant provision of fatty acids (FAs) upon demand, particularly in highly oxidative tissues such as the brown adipose tissue, liver, cardiac and skeletal muscles, or macrophages. In these tissues, FAs not only are efficient energy substrates but also represent basic building blocks for the synthesis of membrane lipids or intracellular signaling molecules. In addition, FAs have also been recognized as signaling molecules per se, which can bind to and thereby activate members of the nuclear receptor family of transcription factors (Kliewer et al., 1997). Defective lipolysis in nonadipose tissues impairs their normal function, leading to excessive TG accumulation and neutral lipid storage disease. Conversely, overabundance of FAs due to unrestrained lipolysis results in lipotoxicity, which is characterized by ER stress, mitochondrial dysfunction, and cell death. Elevated cellular FA concentrations, independent of whether they originate from exogenous lipolysis in WAT or endogenous lipolysis in nonadipose tissues, cause prevalent metabolic disorders such as insulin resistance, type II diabetes, liver steatosis, or atherosclerosis. Additionally, dysregulated lipolysis is also observed in other pathological conditions such as in cancer-induced cachexia.
1.1. Current model of lipolysis
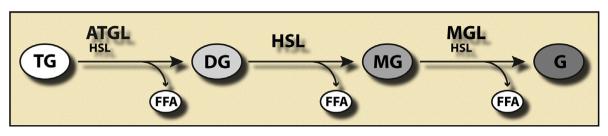
Lipolysis requires specific enzymes commonly called lipases for each step of ester bond hydrolysis in TGs. To date, three major lipases have been identified: (i) Adipose triglyceride lipase (ATGL) performs the first step of TG hydrolysis, generating diglycerides (DGs) and FAs (Zimmermann et al., 2004). Its activity is tightly regulated by two accessory proteins: comparative gene identification-58 (CGI-58) coactivates the hydrolase activity of ATGL and G0/G1 switch gene 2 (G0S2) inactivates the hydrolase activity of ATGL (Lass et al., 2006; Yamaguchi, 2010; Yamaguchi & Osumi, 2009; Yang et al., 2010). (ii) Hormone-sensitive lipase (HSL) performs the second step and hydrolyzes DGs, generating monoglycerides (MGs) and FAs. In contrast to ATGL, HSL exhibits a broader substrate specificity, also hydrolyzing TGs, cholesteryl esters, MGs, and retinyl esters in addition to DGs. (iii) Monoglyceride lipase (MGL) is selective for MGs and generates glycerol and the third FA (Vaughan, Berger, & Steinberg, 1964). Thus, lipolysis constitutes a coordinated three-step process catalyzed by three different enzymes, which degrade TG into glycerol and FAs (Fig. 10.1). The relative importance of these three enzymes, however, highly depends on their tissue-specific expression pattern and the metabolic state. In WAT, ATGL, HSL, and MGL are responsible for more than 90% of its lipolytic activity (Schweiger et al., 2006). This may be different in other tissues such as skeletal muscle or cardiac muscle, where other, possibly unknown enzymes may also contribute to intracellular TG hydrolase activity (Haemmerle et al., 2006).
Figure 10.1. Coordinated breakdown of triglycerides in the course of lipolysis.
1.2. Regulation of adipose tissue lipolysis
As mentioned earlier, WAT provides FAs to tissues with high-energy demand at times of fasting. This necessitates that FAs and glycerol derived from WAT lipolysis enter the bloodstream, which makes WAT lipolysis the main determinant of plasma FA concentrations. Numerous physiological conditions, hormones, and cytokines regulate WAT lipolysis on multiple levels. The most important regulatory steps to control enzyme activity include (i) regulation of lipase gene expression, (ii) translation and stability of lipases and accessory proteins, (iii) control of intracellular localization of lipases, (iv) posttranslational modifications (e.g., phosphorylation), and (v) regulation of lipase activity via coregulators (e.g., CGI-58, G0S2, and perilipins).
Regulation of each of these steps is tissue-specific and often varies among different organisms. For example, while mRNA expression of ATGL is upregulated in response to fasting in murine WAT (reviewed in Zechner, Kienesberger, Haemmerle, Zimmermann, & Lass, 2009), it is reduced in human WAT. Nevertheless, this reduction of ATGL mRNA in fasted human WAT is associated with increased ATGL protein concentrations (Nielsen et al., 2011) and, presumably, increased lipase activity. Similarly, despite drastically elevated lipolysis, ATGL and HSL mRNA expression is unaltered upon endurance training (Huijsman et al., 2009) or even decreased by the lipolysis-inducing (lipolytic) hormones isoproterenol and TNF-α (Kralisch et al., 2005). This indicates that lipolysis is predominantly regulated at the posttranscriptional and posttranslational level (Fig. 10.2). Accordingly, measurements of lipase mRNA levels are inadequate markers for the estimation of actual lipase activities.
Figure 10.2. Intracellular localization of lipases and regulatory proteins in the basal/non-lipolytic-stimulated state and upon lipolytic stimulation.

In the basal/non-lipolytic-stimulated state, CGI-58 is bound to perilipin-1 and unavailable for ATGL binding/ activation. HSL resides in the cytosol. β-Adrenergic stimulation leads to the phosphorylation of HSL and perilipin-1, which causes HSL to translocate onto the LD. ATGL also translocates from the cytosol to the LD surface. In both lipolytic states, G0S2 is localized on LD, bound to ATGL. In addition, phosphorylated perilipin-1 releases CGI-58, which is now available for ATGL binding and activation. MGL is localized on the LD, the cytosol, and the ER independent of the metabolic state of the cell.
To date, most work related to regulatory mechanisms controlling lipolysis focused on WAT. Oxidative tissues share many of the lipases and accessory proteins with adipose tissue, specific differences exist regarding expression of hormone receptors, signaling pathways, and LD composition and structure. These differences require better characterization. In WAT, the most important mechanism regulating lipolysis involve the activation of ATGL by CGI-58 and the protein kinase A (PKA) - mediated phosphorylation of HSL and perilipin-1. In the nonstimulated/basal state, CGI-58 is bound to perilipin-1 and unavailable for ATGL binding/activation. At the same time, HSL resides in the cytosol. Upon hormonal (e.g., β-adrenergic) stimulation, PKA phosphorylates both HSL and perilipin-1 on multiple serines, which causes HSL translocation to the LD (Clifford, Londos, Kraemer, Vernon, & Yeaman, 2000; Egan et al., 1992). Phosphorylated perilipin-1 also releases CGI-58, which is now available for ATGL binding and activation (Granneman et al., 2006). Following hormone stimulation, ATGL also translocates from the cytosol to the LD surface. However, the underlying mechanism is not clear (Bezaire et al., 2009; Yang et al., 2010) (Fig. 10.2). G0S2 efficiently inhibits ATGL activity in in vitro lipase assays. Moreover, G0S2-deficient mice exhibit increased adipose tissue lipolysis, improved insulin sensitivity, and are resistant to diet induced liver steatosis (Zhang et al., 2013). Notably, G0S2 appears to be involved in the activation of lipolysis in adipocytes by TNF-α. Experiments in 3T3-L1 adipocytes showed that TNF-α decreases G0S2 mRNA and protein levels, leading to enhanced lipolysis (Yang, Zhang, Heckmann, Lu, & Liu, 2011).
1.3. Strategies to assess lipolysis
1.3.1 Non-activity-based methods
1.3.1.1 Quantitation of cell and tissue mRNA levels of lipases and regulatory proteins
Due to the convenience and simplicity of the involved methodology, the lipolytic activities in cells or tissues are often estimated by quantification of mRNA levels of lipases and regulatory proteins. It is assumed that changes in mRNA levels will lead to respective changes in the protein concentrations, which will finally translate into changes in the lipolytic activity. This conclusion, as mentioned before, is mostly unwarranted. Accordingly, determination of mRNA levels is only meaningful when the transcription, mRNA processing, or mRNA degradation of lipolytic genes is in question.
1.3.1.2 Quantitation of protein concentrations of lipases and regulatory proteins
To date, a number of very specific antibodies for lipolytic enzymes and regulatory proteins are available for various species including murine and human proteins. These tools have substantially broadened the assessment of protein levels of lipases and regulatory proteins, determination of which is necessary if translation from RNA, protein stability, or protein degradation is in question. Since lipase activities are regulated at the posttranscriptional level, a direct correlation between protein expression levels and activities usually does not exist.
1.3.1.3 Quantitation of HSL and perilipin phosphorylation state
The phosphorylation state of perilipin-1 and HSL is a good measure to investigate hormone-stimulated lipolysis. More precisely, the phosphorylation of HSL and perilipin is a direct readout for PKA activity, since these proteins are known substrates for PKA. Thus, this method is well suited when PKA activity has to be determined. However, PKA-mediated phosphorylation of HSL and perilipin does not necessarily correlate with lipolytic activities, since lipolysis is a complex orchestration between different lipolytic enzymes and regulatory proteins.
1.3.2 Activity-based methods
1.3.2.1 In vitro TG hydrolase activity
To directly measure lipolytic activities of tissues or cells, the in vitro TG hydrolase activity assay is widely used. This assay is relatively easy to perform and meaningful in that it provides a good measure for the lipolytic capacity in a given sample. It is based on an artificial, radioactive isotope-labeled triolein substrate where the lipolytic activity of the sample leads to a release of radiolabeled FAs. Hence, it is important that samples do not contain large amounts of endogenous TG, since these would also be hydrolyzed but as they are not labeled they would not be detected in the assay. Thus, endogenous TG lowers the rate of hydrolysis in the assay by diluting the artificial substrate. Usually, a 20,000×g infranatant of tissue homogenates is used because LDs will float on top and can be easily removed. Yet, by removing the LDs from the sample, also, a portion of lipases and regulatory proteins is removed and lost for the measurement. As shown in Fig. 10.2, the majority of ATGL and HSL translocates from the cytosol to the LD surface upon β-adrenergic stimulation. Thus, under these conditions, the major lipolytic activity of the sample is not accessible for TG hydrolase activity measurement.
1.3.2.2 LD-associated activity
To circumvent the limitations of the in vitro TG hydrolase assay, an analysis of the LD-associated lipolytic capacity can be performed. For this, LDs have to be isolated and purified by differential centrifugation (density gradient). Then, these LDs are incubated for “self-digestion” and released FAs are determined by an enzymatic test, which is a direct readout for the lipolytic capacity. Generally, LDs can be isolated from either cultured cells or tissues. The advantage of using cultured cells for LD isolation is that they can be transfected with a gene of interest (i.e., an LD-associated protein), whose role in lipolysis can then be analyzed. Furthermore, the TG moiety of LDs of cultured cells can also be radiolabeled, which enhances sensitivity and accuracy of the assay. LDs, isolated from tissues of genetically modified animals, can be used as substrate to more precisely determine the effect of the genetic manipulation on lipolysis. Furthermore, during “self-digestion” of LDs, the exogenous addition of proteins of interest (either purified or in lysates) allows investigators to assess their respective effect on lipolysis in a much-closer-to-reality system since the substrate, the isolated LDs, is composed of a biological complex mixture of lipid species and already contains numerous proteins, depending on cell type or tissue. Although this method is convenient, isolation of LDs is time-consuming and inactivation or mis-localization of proteins may occur.
1.3.2.3 Lipolysis of cultured adipocytes and organ explants
The most direct assessment of lipolysis is the measurement of the lipolytic products released by adipocytes or fat explants. This method is based on the measurement of lipolytic products (FAs and glycerol), which are released into the incubation media. In this scenario, two lipolytic states can be differentiated, the so-called basal and β-adrenergic-stimulated states. It is important to add bovine serum albumin (BSA) as FA acceptor to the incubation media since the extracellular accumulation of free FAs will promote reuptake of FAs and reesterification of glycerolipids. Despite an excess of FA acceptor in the media, not all FAs and glycerols generated during lipolysis are released to the media but used for intracellular needs. Thereby, FAs are readily activated by acyl-CoA synthetases (ACS) to FA-CoA, which serve as precursors for MG, DG, TG, and phospholipid (PL) synthesis. Although to a lesser extent, glycerol can also be recycled by glycerol kinase, glycerolphosphate-acyltransferase, acylglycerolphosphate-acyltransferase, and lipin to DGs (Fig. 10.3). Thus, the molar ratio between FA and glycerol released into the media is usually closer to 1:1 under basal/non-lipolytic-stimulated conditions and only reaches a ratio of 3:1 under lipolytic-stimulated conditions (i.e., by β-adrenergic stimulation) or by the inhibition of ACS (i.e., by triacsin C; Paar et al., 2012).
Figure 10.3. The fate of free fatty acids (FA) and glycerol (G) generated during intracellular lipolysis.

FAs generated by the activity of ATGL, HSL, and MGL are either released into the circulation or activated by acyl-CoA synthetases (ACS) to FA-CoA. These FA-CoAs serve as building blocks for the synthesis of MG, DG, TG, and phospholipids (PL), by the activities of MGAT (monoacylglycerol-acyltransferase), DGAT (diacylglycerol-acyltransferase), or CPT (cholinephosphotransferase). Glycerol (G) is recycled by GK (glycerol kinase), GPAT (glycerolphosphate-acyltransferase), AGPAT (acylglycerolphosphate-acyltransferase), and lipin to DGs.
2. METHODOLOGICAL DESCRIPTION OF ACTIVITY-BASED ASSAYS
2.1. Measurement of in vitro TG hydrolase activity
2.1.1 Validity of the in vitro TG hydrolase assay to determine ATGL activity
The measurement of TG hydrolase activity in adipose tissue was originally optimized for HSL (Holm, Olivecrona, & Ottosson, 2001). It was suggested that HSL hydrolyzes TG and DG to form MG and FA. MGL then hydrolyzes MG. At that time, TG hydrolysis was found to be highest at neutral pH, using a substrate of triolein emulsified with phospholipids. Not surprisingly, ATGL is also maximally active under the same conditions. In the presence of CGI-58, the optimal pH for ATGL-mediated TG hydrolysis is pH 7.0 (Fig. 10.4). An increase to pH 8.0 or decrease to pH 6.0 results in a loss of nearly half of the activity. Using triolein as substrate, the acylglycerol hydrolase activity present in adipose tissue lysates derives mostly (>90%) from ATGL, HSL, and MGL. To differentiate between TG hydrolase activities mediated by ATGL or HSL, a specific inhibitor for HSL can be used (Schweiger et al., 2006). Inhibition of HSL activity in WAT reduces the acylglycerol activity by approximately 60%, which is expected since DG accumulates, and DG has two out of three FAs still esterified to the glycerol backbone. The absence of ATGL activity reduces the acylglycerol hydrolase activity of WAT by approximately 80%, and no intermediary degradation products accumulate (Haemmerle et al., 2006).
Figure 10.4. pH dependence of CGI-58-coactivated ATGL hydrolysis of TG.

COS-7 cell lysates containing recombinant CGI-58 and ATGL were incubated with 0.32 mM triolein as substrate and 3H-triolein as tracer in 100 mM potassium phosphate buffer of various pH (6–8). Substrates were emulsified in phospholipids (PC/PI, 3:1, w/w) containing 5% BSA (FA-free). After incubation, FAs were extracted and radioactivity was determined by scintillation counting. Data are means ± standard deviation of three replicates.
For the determination of TG hydrolase activity, triolein is widely used as substrate. Detergents are often used for the preparation of emulsions, including phospholipids (PC/PI), cholate, Triton X-100, and glycerol or a combination thereof. BSA (FA-free) has to be added as FA acceptor since the solubility of FAs is limited and accumulation of FAs will inhibit rate of hydrolysis. Figure 10.5 depicts the effect of different substrate preparations on rate of hydrolysis of HSL, ATGL, and ATGL coactivated by CGI-58. HSL exhibits highest activity when phospholipids (PC/PI) are used for substrate preparation. When the substrate is prepared using Triton X-100 (0.025%) or glycerol (2%), HSL loses approximately 50% of the activity. In the presence of cholate (20 mM), HSL activity is reduced by ~80% (Fig. 10.5A). For ATGL (Fig. 10.5B), the highest activity was obtained with PC/PI- and Triton X-100-stabilized substrates. Preparation of substrates either with cholate or glycerol reduced activities to 35% and 8%, respectively. This suggests that for measurement of ATGL activity, PC/PI and Triton X-100 are suitable. However, this is not the case for CGI-58-coactivated ATGL activity. CGI-58 coactivation of ATGL is only seen using a PC/PI-emulsified substrate (Fig. 10.5C), implicating that the interaction of ATGL and CGI-58 is highly affected by the nature of a detergent.
Figure 10.5. TG hydrolase activities of HSL and ATGL using different detergents for substrate preparation.

COS-7 cell lysates containing recombinant HSL (A), ATGL (B), or ATGL and CGI-58 (C) were subjected to TG hydrolase assay using 0.32 mM triolein as substrate and 3H-triolein as tracer. As control, lysates containing recombinant β-galactosidase (LacZ) were used. Substrates were prepared in 100 mM potassium phosphate buffer, pH 7.0, containing 5% BSA (FA-free). For stabilization 45 μM PC/PI (3:1, w/w), 20 mM cholate, 2% glycerol, or 0.025% Triton X-100 were used. After incubation, FAs were extracted and radioactivity was determined by scintillation counting. Data are means ± standard deviation of three replicates.
2.1.2 Required materials
Solution A: 0.25 M sucrose, 1 mM EDTA, 1 mM DTT, pH 7.0, 1 μg/ml pepstatin, 2 μg/ml antipain, and 20 μg/ml leupeptin as protease inhibitors (Pi’s).
Prepare 20 mg/ml (~25 mM) phosphatidylcholine (PC) from egg yolk and phosphatidylinositol (PI) from soybean (Sigma-Aldrich, St Louis, MO, cat. no. P-3556 and cat. no. P-0639, respectively) with a ratio of 3:1 in chloroform and store at −20 °C.
Prepare a 100 mg/ml (113 mM) solution of triolein (trioleoylglycerol, TO; Sigma-Aldrich, cat. no. T-7140) in toluene and store at −20 °C.
Prepare a 0.5 μCi/μl solution of TO [9,10(N)-3H] (PerkinElmer, Waltham, MA, cat. no. NET431L005MC) in toluene and store in aliquots of 2 ml at −20 °C.
0.1 M potassium ×phosphate buffer (KPB; pH 7.0) is prepared freshly.
Prepare a 20% solution of BSA (FA-free; Sigma-Aldrich, cat. no. A6003) in 0.1 M KPB (pH 7.0) and store in aliquots at −20 °C.
Assay tubes (12 ml, round bottom, polypropylene; Greiner Bio-One GmbH, cat. no. 160201).
Extraction solution I: Methanol/chloroform/n-heptane with a ratio of 10:9:7 (v/v/v) is stored light-protected at 4 °C. Prewarm solution before use.
Extraction solution II: 0.1 M potassium carbonate, pH 10.5 adjusted with saturated boric acid.
Liquid scintillation cocktail (Roth, Karlsruhe, Germany, cat. no. 0016.3, or equivalent).
Sonicator Virsonic 475 (Virtis, Gardiner, NJ) or equivalent.
Liquid scintillation counter (Packard or equivalent).
2.1.3 Procedure
2.1.3.1 Preparation of cellular or tissue extracts
Homogenize tissue samples on ice in solution A using an UltraTurrax (IKA, Janke & Kunkel, Germany) and centrifuge at 1,000×g, 4 °C for 10 min to remove nondisrupted tissue and nuclei. Thereafter, transfer the supernatant to a new tube and centrifuge at 20,000×g, 4 °C for 30 min. Carefully collect the infranatant, leaving the fat layer behind. TG hydrolase activity is determined on the 20,000×g infranatant. For preparation of cell extracts, harvest cultured cells and disrupt cells in buffer A by sonication on ice. Thereafter, centrifuge cell lysates at 1,000×g, 4 °C for 10 min to pellet intact cells and nuclei. For cells that do not contain large amounts of TG (e.g., COS-7 cells), the 1,000×g supernatant is used to measure TG hydrolase activity. Be aware that ATGL, CGI-58, HSL, and MGL may localize on LDs of cells and tissues. Thus, when assaying TG hydrolytic activity of the 20,000×g infranatant, a part of the total lipolytic activity might be lost in the fat cake.
2.1.3.2 Measurement of TG hydrolase activity
According to Holm and Østerlund with some modifications (Holm et al., 2001):
Add 1.67 mM TO, 10 μCi 3H-TO/ml, and 190 μM PC/PI in an assay tube resistant to organic solvent. For nonadipose tissue samples, a 0.32 mM TO and 45 μM PC/PI substrate with same amounts of radiolabel can be used, which will increase the sensitivity of the assay. Bring the solvents to complete dryness under a stream of nitrogen.
Add initially not more than 2 ml of 0.1 M KPB, pH 7.0. Sonicate (Virsonic 475, Virtis, Gardiner, NJ) for 30 s with an output power of 20% on ice. Wait for 30 s and repeat sonication two more times. Be careful that sonicator tip does not touch the walls or the bottom during sonication and avoid foam formation. Ideally, sonicator tip should be on the upper third of the tube.
Add remaining KPB as required and sonicate for 15 s on ice.
Add FA-free BSA to give a final concentration of 5%.
Measure aliquot of the substrate to determine specific substrate activity (should be around 1×10⁶cpm/100 μl).
Prepare samples on ice. For each determination, use 100 μl samples (tissue homogenates or cell lysates) in solution A. As blank, use 100μl solution A. Important: Adapt the amount of protein in the assay experimentally to obtain rates in the linear range of the assay. Prepare at least triplicates for samples and blank. Pipette samples and blanks onto the bottom of assay tubes.
Mix 100 μl samples with 100 μl of substrate by pipetting substrate onto the sample and incubate for 1 h in a water bath at 37 °C under constant shaking.
Terminate the reaction by the addition of 3.25 ml extraction solution I. Add 1.05 ml extraction solution II and mix vigorously for 5 s using a vortex.
Centrifuge samples at 1,000×g for 10 min. Transfer 200 μl of the upper aqueous phase to a scintillation vial containing 2 ml of scintillation cocktail and analyze radioactivity.
2.1.4 Calculation
Rates of TG/DG/MG or acylglycerol hydrolase activities are presented as amount (nmol) of released FAs per hour and milligram protein. For the calculation, the partition coefficient of 1.9 for the extraction of FAs into the water phase (22 °C), meaning that 71.5% of FA is recovered into the water phase, is used. Rates are be calculated using the equation as follows:
where V1 is the total volume of upper water phase (2.45 ml); V2, the volume measured by liquid scintillation (0.2 ml); and t, incubation time (h); 1 501 nmol FA/100 μl for 1.67 mM TG substrate; 90 nmol FA/100 μl for 0.3 mM TG substrate; 60 nmol FA/100 μl for 0.3 mM DG substrate; 400 nmol/100 μl for 4 mM MG substrate.
2.2. Measurement of in vitro DG hydrolase activity
2.2.1 Required materials
Prepare a 10 mg/ml DG solution (select isomer as required; Sigma-Aldrich, cat. no. D3627, sn-1,3 DG; cat. no. 42494, sn-1,2 DG; cat. no. D8394, rac-1,2/2,3 DG; cat. no. D8894, rac-1,2/2,3/1,3 DG) in chloroform and store at −20 °C.
Prepare a 0.5 μCi/μl radiolabeled DG isomer solution (American Radiolabeled Chemicals, Saint Louis, United States, rac-DG [9,10(N)-3H], cat. no. ART0643) in chloroform and store in aliquots of 2 ml at −20 °C.
2.2.2 Procedure
Add 0.3 mM DG, 10 μCi radiolabeled DG/ml, and 50 μM PC/PI in an assay tube resistant to organic solvents (polypropylene test tubes) and bring to complete dryness under a stream of nitrogen.
Further steps are identical as described in steps 2–9 of Section 2.1.3.2 for measurement of TG hydrolase activity and Section 2.1.4 for calculation of lipase activity.
2.3. Measurement of in vitro MG hydrolase activity
2.3.1 Required materials
Prepare a 10 mg/ml MG solution (select isomer as required; Sigma-Aldrich, cat. no. M7765, 1-oleoyl-rac-glycerol; M2787 2-oleoyl-glycerol) in chloroform and store at −20 °C.
Prepare a 0.5 μCi/μl radiolabeled MG isomer solution (American Radiolabeled Chemicals, e.g., 2-mono oleoyl [9,10-3H(N)] glycerol, cat. no. ART1158) in chloroform and store in aliquots of 2 ml at −20 °C.
2.3.2 Procedure
Add 4 mM MG, 2.5 μCi radiolabeled MG/ml, and 1 mM PC/PI in an assay tube resistant to organic solvents (polypropylene test tubes) and bring to complete dryness under a stream of nitrogen.
Steps 2–9 are identical as described in Section 2.1.3.2 for measurement of TG hydrolase activity with the modification that the incubation time of the assay is 15 min.
For calculation, see Section 2.1.4.
2.4. Measurement of ATGL-, HSL-, and/or MGL-specific activity using inhibitors
To determine the TG hydrolase activity of ATGL in tissue samples or cells, HSL activity can be inhibited by specific inhibitors such as NNC0076-0000-0079 (N-methyl-phenyl carbamoyl triazole, Novo Nordisk, Denmark) (Ebdrup, Sørensen, Olsen, & Jacobsen, 2004; Schweiger et al., 2006) or 4-isopropyl-3-methyl-2-{1-[3-(S)-methyl-piperidin-1-yl]-methanoyl}-2H-isoxazol-5-1 (BAY; Lowe et al., 2004). Alternatively, murine ATGL can be specifically inhibited by Atglistatin (3-(4′-(Dimethylamino)-[1,1′-biphenyl]-3-yl)-N,N-dimethylurea) (Mayer et al., 2013). To determine MGL-independent MG hydrolase activity, the MGL-specific inhibitor JZL 184 (Cayman Chemicals, Michigan, United States, cat. no. 13158) can be used (Long, Nomura, & Cravatt, 2009). Stock solution (20 mM) of respective inhibitors is prepared in DMSO and stored at −80 °C. The inhibitors will be added to the samples prior to the addition of substrate. Full inhibition of ATGL, HSL, and MGL activity is obtained at 50 μM, 10 μM, and 100 nM, respectively. Rates obtained in the presence of inhibitors as compared to that in the absence will give a good approximation for ATGL and HSL activity, respectively.
2.5. Measurement of LD-associated lipolysis of cultured cells and tissues
For the analysis of LD-associated lipolytic capacity, LDs of either cultured cells or tissues can be used. The advantage of using LDs from cultured cells is that cells can be transfected with a gene of interest, whose function on LDs can then be analyzed. Furthermore, the TG moiety of cellular LDs can also be radiolabeled, which enhances sensitivity and accuracy of the assay. To investigate lipolytic activity of tissues (e.g., from genetically modified animals, fed/fasted animals, or animals on specific diets), LDs can also be isolated from tissue samples and used as substrate for “self-digestion” experiments.
2.5.1 Isolation of LDs from cultured cells and tissues
2.5.1.1 Required materials
Prepare 4 mM oleic acid (OA) complexed to 1.35 mM BSA by the dropwise addition of prewarmed (37 °C) OA (8 mM in water) to prewarmed BSA (FA-free, 2.7 mM in Dulbecco-PBS, DPBS) under shaking conditions.
Prepare 3H-9,10-OA complexed to BSA (1 μCi/μl; 1.4 Ci/mmol) by dissolving 1,000 μCi 3H-9,10-OA (5 μCi/μl; cat. no. ART 0198, American Radiolabeled Chemicals) in 50 μl 20 mM NaOH for 15 min at 37 °C under shaking conditions. Thereafter, add 950 μl of 1% BSA (in water) and incubate for 5 min while shaking. Ideally, this solution has 1×10⁶ cpm/μl as determined by liquid scintillation counting.
DPBS.
Solution A: 0.25 M sucrose, 1 mM EDTA, 1 mM DTT, pH 7.0, 1 μg/ml pepstatin, 2 μg/ml antipain, and 20 μg/ml leupeptin as Pi’s.
Overlay buffer: 50 mM KPB (pH 7.4), 100 mM KCl, 1 mM EDTA, 1 μg/ml pepstatin, 2 μg/ml antipain, and 20 μg/ml leupeptin as Pi’s.
Siliconizing Fluid (AquaSil; cat. no. TS-42799, Thermo Fisher Scientific, Rockford, United States).
Swing out rotor (SW 41, Beckman or equivalent), corresponding tubes (Herolab or equivalent), and ultracentrifuge (Beckman or equivalent).
TG reagent (cat. no. TR 22421, Thermo Fisher Scientific) and glycerol standard solution (cat. no. F6428, Sigma-Aldrich).
BCA reagent and BSA standard (cat. no. 23227,Thermo Fisher Scientific).
2.5.1.2 Procedure
(A) To isolate radiolabeled LDs from cultured cells:
For labeling of TG stores, seed cells at a density of 50,000 cells/cm2. Incubate semiconfluent cells for 24 h in the presence of 0.4 mM OA complexed to BSA, containing 0.75 mCi 3H-9,10-OA/mmol as tracer.
Intensively wash cells with DPBS, suspend in solution A, and disrupt by sonication. Then, proceed with step 3 later.
(B) To isolate LDs from tissue samples:
Excise tissue (white and brown adipose tissue or liver), wash intensively with DPBS, and place on ice. For isolation of LDs, frozen tissue is not recommended.
Homogenize tissue in solution A on ice using an UltraTurrax (IKA, Janke & Kunkel, Germany) and centrifuge at 1,000×g, 4 °C for 10 min to remove nondisrupted tissue and nuclei.
Transfer cell/tissue lysates to siliconized tubes, overlay with overlay buffer, and centrifuge 2 h, 100,000×g, 4 °C.
Collect floated LDs from the top of the tubes and resuspend in overlay buffer by brief sonication.
Determine the TG content of LDs using TG reagent.
Perform protein determination using BCA reagent. As lipids interfere with protein measurement, incubate 20 μl of the LD fraction with 200 μl BCA reagent. Then, add 0.5% Triton X-100, mix, and incubate for 10 min at RT. After centrifugation at 20,000×g for 10 min, read the absorbance of the underlying solution at 562 nm (typically the protein content of LDs is 0.5 mg protein/mmol TG).
2.5.2 Measurement of lipolysis of isolated LDs from cultured cells
2.5.2.1 Required materials
Isolated radiolabeled LDs.
0.1 M KPB (pH 7.0).
Pi (1,000×stock): 1 mg/ml pepstatin, 2 mg/ml antipain, and 20 mg/ml leupeptin.
20% FA-free BSA (Sigma-Aldrich) dissolved in 0.1 M KPB (pH 7.0).
Extraction solution I: Methanol/chloroform/n-heptane with a ratio of 10:9:7 (v/v/v) is stored light-protected at 4 °C. Prewarm solution before use.
Extraction solution II: 0.1 M potassium carbonate, 0.1 M boric acid, pH 10.5.
Liquid scintillation cocktail (Roth or equivalent).
Liquid scintillation counter (Packard or equivalent).
2.5.2.2 Procedure
Prepare samples on ice. For each determination, prepare 100 μl sample (~0.2 mM TG from isolated radiolabeled LD; see 2.5.1). As blank, use 100 μl overlay buffer. Pipette samples and blanks directly onto the bottom of the assay tubes.
Add 100 μl of 0.1 M KPB, containing 1 × Pi and 1% BSA (FA-free) to samples and blank to give a final volume of 200 μl. To study the effect of recombinant proteins (e.g. lipases or LD proteins) on hydrolysis of LDs, add purified enzymes or cell lysates containing proteins of interest.
Incubate samples and blanks for 1 h at 37 °C in a water bath under constant shaking.
Terminate the reaction by the addition of 3.25 ml extraction solution I. Add 1.05 ml of extraction solution II and mix vigorously for 5 s using a vortex.
Centrifuge samples at 1,000×g for 10 min. Then, transfer 200 μl of the upper aqueous phase to a scintillation vial containing 2 ml of scintillation cocktail and analyze radioactivity.
2.5.2.3 Calculation
LD-associated lipolytic activity is calculated as the amount of released FA (nmol) per TG (μmol) or per protein (mg) amount of the LD and per hour. The partition coefficient for FAs into the water phase is 1.9 (22 °C), meaning that 71.5% of OA is recovered in the water phase. For the calculation, the following equation can be used:
where V1 is the total volume of the upper water phase (2.45 ml); V2, volume measured by liquid scintillation (0.2 ml); and t, incubation time (h); 1 60 nmol FA/100 μl for 0.2 mM TG substrate.
2.5.3 Lipolysis of isolated tissue LDs
2.5.3.1 Required materials
Isolated LDs.
0.1 M KPB (pH 7.0).
Pi (1,000×stock): 1 mg/ml pepstatin, 2 mg/ml antipain, and 20 mg/ml leupeptin.
20% BSA (FA-free; Sigma-Aldrich) in 0.1 M KPB (pH 7.0).
NEFA kit and standard solution (cat. no. 999-34691; 995-3479; 991-34891; 993-35191; 276-76491, Wako Chemicals, Neuss, Germany).
10% Triton X-100.
2.5.3.2 Procedure
Incubate 1 mM TG of isolated LDs with 1% BSA in 0.1 M KPB containing 1×Pi in a final volume of 200 μl for 1 h at 37 °C in a water bath under constant shaking. In order to evaluate the capacity of ATGL or HSL to hydrolyze natural LDs, add purified enzymes or cell lysates over-expressing the enzyme of interest.
Solubilize LDs by the addition of 20 μl 10% Triton X-100 (final conc. 1%) to the samples, vortex, and incubate for 10 min at RT.
Centrifuge samples for 30 min at 20,000×g and carefully transfer the underlying solution, without any lipids in a new tube.
4. Determine FA content in the underlying solution using NEFA kit.
2.5.3.3 Calculation
To calculate net FA release of the tissue LDs, FA levels are also measured from the LD substrate prior to incubation (blank). After subtraction of the blank, lipolysis of tissue LDs is calculated as nmol FA per TG (μmol) or per protein (mg) amount of the LDs.
2.6. Measurement of lipolysis in cultured adipocytes and organ explants
The most direct assessment of lipolysis is the measurement of the lipolytic products, released by adipocytes or fat explants. This method is based on the measurement of the lipolytic products, FAs, and glycerol in the incubation media. Two lipolytic states can be differentiated, the so-called basal and β-adrenergic-stimulated states. Stimulation of lipolysis leads to a rapid increase in FA and glycerol release within 15 min, with a quasi linear rate during the first hours which levels off thereafter (see Fig. 10.6). Since the rate of stimulated lipolysis is highest and nearly linear between the first and second hour of β-adrenergic stimulation, the measurement of the stimulated state requires a preincubation period. Usually, cells or fat explants are preincubated for 1 h with isoproterenol or forskolin; then, the incubation media is replaced and the released FAs and glycerol of the forthcoming 1 h period are determined.
Figure 10.6. Time course of basal and stimulated lipolysis of adipocytes.

Differentiated 3T3-L1 adipocytes were incubated in DMEM containing 2% BSA (FA-free) in the absence (basal) and presence (stimulated) of isoproterenol (10 μM). After various times, the FA content of incubation media was determined and normalized to cellular protein content. Data are means ± standard deviation of three replicates.
2.6.1 Measurement of basal and stimulated lipolysis in cultured adipocytes
2.6.1.1 Required material
Differentiated adipocytes in 12-well or 24-well plates.
Dulbecco’s modified Eagle’s medium (DMEM, 1 g/l glucose; GIBCO, Life Technologies, Carlsbad, CA).
20% BSA (FA-free) stock solution in PBS (Sigma-Aldrich), sterile.
DPBS, sterile.
NEFA kit and standard solution (cat. no. 999-34691; 995-3479; 991-34891; 993-35191; 276-76491,Wako Chemicals, Neuss, Germany)
Free glycerol reagent and glycerol standard solution (cat. no. F6428; Sigma-Aldrich).
Extraction solution: Chloroform/methanol(2:1, v/v), 1% glacial acetic acid.
Lysis solution: NaOH/SDS (0.3 N/0.1%).
BCA reagent and BSA standard (cat. no. 23227, Thermo Fisher Scientific).
Forskolin or isoproterenol, 10 mM stock solutions in DMSO, stored in aliquots at −20 °C (Sigma-Aldrich).
Triacsin C, 5 mM stock solution in DMSO, stored in aliquots at −20 °C (Triacsin C from Streptomyces sp.; cat. no. T4540, Sigma-Aldrich).
2.6.1.2 Procedure
For measurement of stimulated lipolysis, preincubate differentiated adipocytes (i.e., 3T3-L1) in DMEM, containing 2% BSA (FA-free) and forskolin or isoproterenol in the presence or absence of 5 μM triacsin C for 60 min at 37 °C, 5% CO2, and 95% humidified atmosphere. For measurement of basal lipolysis, preincubation is not required.
Replace the medium by an identical fresh medium containing 2% FA-free BSA and incubate for 1 h (=period of measurement). Save media for measurements.
Wash cells 2× with DPBS.
Lyse cells with lysis solution (200–500 μl/well) by shaking the plates for 3 h at room temperature.
Determine protein content of the cell lysate using BCA reagent and BSA as standard.
Determine free FA and glycerol content of the medium using NEFA kit and free glycerol reagent and the appropriate standard solutions, respectively.
2.6.1.3 Calculation
Lipolysis of adipocytes is calculated as nmol FA and/or nmol glycerol per mg cell protein and hour.
2.6.1.4 Limitations
To avoid reesterification of FA and glycerol, it is recommended to incubate cells in the presence of 5 μM triacsin C to inhibit acyl-CoA synthetases. At high lipolytic rates, the capacity of BSA (FA-free) as FA acceptor may become limiting after prolonged incubation time (Fig. 10.6). This will lead to decreased apparent FA release rate and increased reesterification (Paar et al., 2012).
2.6.2 Measurement of basal and stimulated lipolysis of WAT organ explants
2.6.2.1 Required materials
Dulbecco’s modified Eagle’s medium (DMEM, 1 g/l glucose; GIBCO, Life Technologies, Carlsbad, CA).
DPBS, sterile.
Forceps and scissors for organ explant preparations.
20% BSA (FA-free; Sigma-Aldrich) stock solution in PBS, sterile.
96-well plates, sterile.
NEFA kit and standard solution (Wako chemicals).
Free glycerol reagent and glycerol standard solution (Sigma-Aldrich).
Extraction solution: Chloroform/methanol (2:1, v/v), 1% glacial acetic acid.
Lysis solution: NaOH/SDS (0.3 N/0.1%).
BCA reagent and BSA standard (Pierce).
Forskolin or isoproterenol, 10 mM stock solutions in DMSO, stored in aliquots at −20 °C (Sigma-Aldrich).
Triacsin C, ×5 mM stock solution in DMSO, stored in aliquots at −20 °C (Sigma-Aldrich).
2.6.2.2 Procedure
Surgically remove gonadal adipose tissue, wash in DPBS, and incubate in prewarmed (37 °C) DMEM till use (perform measurements the same day).
For measurement of stimulated lipolysis, cut tissue pieces (~20 mg) and preincubate them in 200 μl DMEM containing 2% BSA (FA-free) and 10 μM forskolin/isoproterenol and in the presence or absence of 5 μM triacsin C in 96-well plates at 37 °C, 5% CO2, and 95% humidified atmosphere for 60 min. For measurement of basal lipolysis, pre-incubation is not required.
Transfer fat explants into 200 μl of identical, fresh medium and incubate for further 60 min (=period of measurement) at 37 °C, 5% CO2, and 95% humidified atmosphere. Save incubation media.
Transfer fat explants in 1 ml extraction solution and incubate for 60 min at 37 °C under vigorous shaking on a thermomixer.
Transfer fat explants in 500 μl lysis solution and incubate overnight at 55 °C under vigorous shaking on a thermomixer.
Determine protein content of the fat explant lysates using BCA reagent and BSA as standard.
Determine FA and glycerol content of the incubation media using NEFA kit and free glycerol reagent and appropriate standard solutions, respectively.
2.6.2.3 Calculation
Lipolysis of adipose tissue organ cultures is calculated as nmol FA and/or nmol glycerol per mg/protein and hour.
2.6.2.4 Limitations
To avoid reesterification of FA and glycerol, it is recommended to incubate fat explants in the presence of 5 μM triacsin C to inhibit acyl-CoA synthetases. At high lipolytic rates, the capacity of BSA (FA-free) as FA acceptor may become limiting after prolonged incubation times. This will lead to decreased apparent FA release rate and increased reesterification (Paar et al., 2012).
3. CONCLUSION
During the last decade, the perception of lipolysis has dramatically changed. Research steadily uncovers the complexity of the lipidome, proteome, and interactome, the regulation of the lipolytic process, and its interconnection with other cellular processes such as lipid and energy metabolism. It has now been recognized that the measurement of mRNA or protein expression of key players in lipolysis is often not enough to determine the lipolytic state of cells and tissues. Not a single biochemical estimation but the combination of in vitro, in situ, and in vivo measurements is required to assess lipolytic capacity and the lipolytic state and to unravel the role of lipolysis in energy metabolism, cellular signaling, the maintenance of normophysiology, and the development of pathologies.
ACKNOWLEDGMENTS
This work was supported by the Grants SFB Lipotox and the Wittgenstein Award Z136 (Ru. Ze.), the grants P24294, P18434, and TRP4 (Ro. Zi.), and the Grant P25193 (A. L.), which are funded by the Austrian Science Fund (FWF).
REFERENCES
- Bezaire V, Mairal A, Ribet C, Lefort C, Girousse A, Jocken J, et al. Contribution of adipose triglyceride lipase and hormone-sensitive lipase to lipolysis in hMADS adipocytes. The Journal of Biological Chemistry. 2009;284:18282–18291. doi: 10.1074/jbc.M109.008631. [DOI] [PMC free article] [PubMed] [Google Scholar]
- Clifford GM, Londos C, Kraemer FB, Vernon RG, Yeaman SJ. Translocation of hormone-sensitive lipase and perilipin upon lipolytic stimulation of rat adipocytes. The Journal of Biological Chemistry. 2000;275:5011–5015. doi: 10.1074/jbc.275.7.5011. [DOI] [PubMed] [Google Scholar]
- Ebdrup S, Sørensen LG, Olsen OH, Jacobsen P. Synthesis and structure-activity relationship for a novel class of potent and selective carbamoyl-triazole based inhibitors of hormone sensitive lipase. Journal of Medicinal Chemistry. 2004;47:400–410. doi: 10.1021/jm031004s. [DOI] [PubMed] [Google Scholar]
- Egan JJ, Greenberg AS, Chang MK, Wek SA, Moos MCJ, Londos C. Mechanism of hormone-stimulated lipolysis in adipocytes: Translocation of hormone-sensitive lipase to the lipid storage droplet. Proceedings of the National Academy of Sciences of the United States of America. 1992;89:8537–8541. doi: 10.1073/pnas.89.18.8537. [DOI] [PMC free article] [PubMed] [Google Scholar]
- Granneman JG, Moore HP, Granneman RL, Greenberg AS, Obin MS, Zhu Z. Analysis of lipolytic protein trafficking and interactions in adipocytes. Journal of Biological Chemistry. 2006;282:5726–5735. doi: 10.1074/jbc.M610580200. [DOI] [PubMed] [Google Scholar]
- Haemmerle G, Lass A, Zimmermann R, Gorkiewicz G, Meyer C, Rozman J, et al. Defective lipolysis and altered energy metabolism in mice lacking adipose triglyceride lipase. Science. 2006;312:734–737. doi: 10.1126/science.1123965. [DOI] [PubMed] [Google Scholar]
- Holm C, Olivecrona G, Ottosson M. Assays of lipolytic enzymes. Methods in Molecular Biology (Clifton, N.J.) 2001;155:97–119. doi: 10.1385/1-59259-231-7:097. [DOI] [PubMed] [Google Scholar]
- Huijsman E, Van de Par C, Economou C, Van der Poel C, Lynch GS, Schoiswohl G, et al. Adipose triacylglycerol lipase deletion alters whole body energy metabolism and impairs exercise performance in mice. American Journal of Physiology Endocrinology and Metabolism. 2009;297:E505–E513. doi: 10.1152/ajpendo.00190.2009. [DOI] [PubMed] [Google Scholar]
- Kliewer SA, Sundseth SS, Jones SA, Brown PJ, Wisely GB, Koble CS, et al. Fatty acids and eicosanoids regulate gene expression through direct interactions with peroxisome proliferator-activated receptors alpha and gamma. Proceedings of the National Academy of Sciences of the United States of America. 1997;94:4318–4323. doi: 10.1073/pnas.94.9.4318. [DOI] [PMC free article] [PubMed] [Google Scholar]
- Kralisch S, Klein J, Lossner U, Bluher M, Paschke R, Stumvoll M, et al. Isoproterenol, TNFalpha, and insulin downregulate adipose triglyceride lipase in 3T3-L1 adipocytes. Molecular and Cellular Endocrinology. 2005;240:43–49. doi: 10.1016/j.mce.2005.06.002. [DOI] [PubMed] [Google Scholar]
- Lass A, Zimmermann R, Haemmerle G, Riederer M, Schoiswohl G, Schweiger M, et al. Adipose triglyceride lipase-mediated lipolysis of cellular fat stores is activated by CGI-58 and defective in Chanarin-Dorfman syndrome. Cell Metabolism. 2006;3:309–319. doi: 10.1016/j.cmet.2006.03.005. [DOI] [PubMed] [Google Scholar]
- Long JZ, Nomura DK, Cravatt BF. Characterization of monoacylglycerol lipase inhibition reveals differences in central and peripheral endocannabinoid metabolism. Chemistry & Biology. 2009;16:744–753. doi: 10.1016/j.chembiol.2009.05.009. [DOI] [PMC free article] [PubMed] [Google Scholar]
- Lowe DB, Magnuson S, Qi N, Campbell A-M, Cook J, Hong Z, et al. In vitro SAR of (5-(2H)-isoxazolonyl) ureas, potent inhibitors of hormone-sensitive lipase. Bioorganic & Medicinal Chemistry Letters. 2004;14:3155–3159. doi: 10.1016/j.bmcl.2004.04.015. [DOI] [PubMed] [Google Scholar]
- Mayer N, Schweiger M, Romauch M, Grabner GF, Eichmann TO, Fuchs E, et al. Development of small molecule inhibitors targeting adipose triglyceride lipase. Nature Chemical Biology. 2013;9:785–787. doi: 10.1038/nchembio.1359. [DOI] [PMC free article] [PubMed] [Google Scholar]
- Nielsen TS, Vendelbo MH, Jessen N, Pedersen SB, Jørgensen JO, Lund S, et al. Fasting, but not exercise, increases adipose triglyceride lipase (ATGL) protein and reduces G(0)/G(1) switch gene 2 (G0S2) protein and mRNA content in human adipose tissue. The Journal of Clinical Endocrinology and Metabolism. 2011;96:E1293–E1297. doi: 10.1210/jc.2011-0149. [DOI] [PubMed] [Google Scholar]
- Paar M, Jüngst C, Steiner N. a., Magnes C, Sinner F, Kolb D, et al. Remodeling of lipid droplets during lipolysis and growth in adipocytes. The Journal of Biological Chemistry. 2012;287:11164–11173. doi: 10.1074/jbc.M111.316794. [DOI] [PMC free article] [PubMed] [Google Scholar]
- Schweiger M, Schreiber R, Haemmerle G, Lass A, Fledelius C, Jacobsen P, et al. Adipose triglyceride lipase and hormone-sensitive lipase are the major enzymes in adipose tissue triacylglycerol catabolism. Journal of Biological Chemistry. 2006;281:40236–40241. doi: 10.1074/jbc.M608048200. [DOI] [PubMed] [Google Scholar]
- Vaughan M, Berger JE, Steinberg D. Hormone-sensitive lipase and monoglyceride lipase activities in adipose tissue. The Journal of Biological Chemistry. 1964;239:401–409. [PubMed] [Google Scholar]
- Yamaguchi T. Crucial role of CGI-58/alpha/beta hydrolase domain-containing protein 5 in lipid metabolism. Biological & Pharmaceutical Bulletin. 2010;33:342–345. doi: 10.1248/bpb.33.342. [DOI] [PubMed] [Google Scholar]
- Yamaguchi T, Osumi T. Chanarin-Dorfman syndrome: Deficiency in CGI-58, a lipid droplet-bound coactivator of lipase. Biochimica et Biophysica Acta. 2009;1791:519–523. doi: 10.1016/j.bbalip.2008.10.012. [DOI] [PubMed] [Google Scholar]
- Yang X>, Lu X, Lombes M, Rha GB, Chi YI, Guerin TM, et al. The G(0)/G(1) switch gene 2 regulates adipose lipolysis through association with adipose triglyceride lipase. Cell Metabolism. 2010;11:194–205. doi: 10.1016/j.cmet.2010.02.003. [DOI] [PMC free article] [PubMed] [Google Scholar]
- Yang X, Zhang X, Heckmann BL, Lu X, Liu J. Relative contribution of adipose triglyceride lipase and hormone-sensitive lipase to tumor necrosis factor-alpha (TNF-alpha)-induced lipolysis in adipocytes. The Journal of Biological Chemistry. 2011;286:40477–40485. doi: 10.1074/jbc.M111.257923. [DOI] [PMC free article] [PubMed] [Google Scholar]
- Zhang X, Xie X, Heckmann BL, Saarinen AM, Czyzyk TA, Liu J. Target disruption of G0/G1 switch gene 2 enhances adipose lipolysis, alters hepatic energy balance, and alleviates high fat diet-induced liver steatosis. Diabetes. 2014;63:934–946. doi: 10.2337/db13-1422. [DOI] [PMC free article] [PubMed] [Google Scholar]
- Zechner R, Kienesberger PC, Haemmerle G, Zimmermann R, Lass A. Adipose triglyceride lipase and the lipolytic catabolism of cellular fat stores. Journal of Lipid Research. 2009;50:3–21. doi: 10.1194/jlr.R800031-JLR200. [DOI] [PubMed] [Google Scholar]
- Zimmermann R, Strauss JG, Haemmerle G, Schoiswohl G, Birner-Gruenberger R, Riederer M, et al. Fat mobilization in adipose tissue is promoted by adipose triglyceride lipase. Science. 2004;306:1383–1386. doi: 10.1126/science.1100747. [DOI] [PubMed] [Google Scholar]