Abstract
Radiation dose to the brain and subsequent lifetime risk of diagnosis of radiation-related brain tumors were estimated for pediatric patients undergoing intracranial embolization. Average dose to the whole brain was calculated using dosimetric data from the Radiation Doses in Interventional Radiology Study for 49 pediatric patients who underwent neuroradiological procedures, and lifetime risk of developing radiation-related brain tumors was estimated using published algorithms based on A-bomb survivor data. The distribution of absorbed dose within the brain can vary significantly depending on field size and movement during procedures. Depending on the exposure conditions and age of the patient, organ-averaged brain dose was estimated to vary from 6 to 1600 mGy. The lifetime risk of brain tumor diagnosis was estimated to be increased over the normal background rates (57 cases per 10,000) by 3 to 40% depending on the dose received, age at exposure, and gender. While significant uncertainties are associated with these estimates, we have quantified the range of possible dose and propagated the uncertainty to derive a credible range of estimated lifetime risk for each subject. Collimation and limiting fluoroscopy time and dose rate are the most effective means to minimize dose and risk of future induction of radiation-related tumors.
INTRODUCTION
Interventional fluoroscopy, in which fluoroscopy is used to provide real-time guidance for performance of a medical procedure, was first used by radiologists and cardiologists, and cardiovascular applications still constitute the majority of interventional fluoroscopy procedures (1). In the past two decades, both the number and the complexity of interventional fluoroscopy procedures have also increased in other specialties (2). These procedures require extensive fluoroscopic guidance and large numbers of radiographic images, and the medical and radiation protection communities have become concerned not only because of possible stochastic effects such as cancer induction but also because the level of dose may be large enough to produce deterministic effects (3–7).
Interventional fluoroscopy procedures are not commonly performed on pediatric patients, and special care is required because children are more sensitive to the detrimental effects of radiation and have a longer remaining life span during which radiation-related cancers could develop (8). Investigations of patient doses from cardiac procedures have been conducted since the early 1980s (9–22). However, there are very few published data on radiation doses from non-cardiac pediatric interventional fluoroscopy procedures (23–27). In two studies (24, 27), entrance dose or dose to the skin was assessed after neuroradiological procedures, but in neither study was dose to the brain estimated. To provide estimates of brain doses in pediatric patients who have had interventional neuroradiology procedures, we analyzed dosimetric data from pediatric patients included in the Radiation Doses in Interventional Radiology Study (RAD-IR) over a period of 3 years in seven U.S. medical centers (28–30). The purpose of RAD-IR was to assess skin dose to patients undergoing interventional fluoroscopy procedures performed by interventional radiologists. Demographic and radiation dose data were collected prospectively during the period from April 1999–January 2002. A total of 85 procedures (4% of the total RAD-IR study cohort of 2142 cases) were performed on children. The subset of pediatric patients who underwent cerebral embolization is of particular interest, because these patients tended to receive more radiation exposure than pediatric patients who underwent other types of interventions. These patients were treated mainly in two of the seven centers included in the RAD-IR study, the Hyman Newman Institute of Neurology and Neurosurgery, Center for Endovascular Surgery, Beth Israel Medical Center, and the Department of Radiology, Feinberg School of Medicine, Northwestern University. The information collected on these patients, which we used to develop a strategy to estimate radiation doses received by the brains of these children, represents one of the largest sets of dosimetric data available on pediatric neuroradiology cases. Based on the estimated absorbed doses, we estimated the lifetime risk of developing radiation-related benign and malignant central nervous system tumors. This report is an enhancement of our earlier simplified analysis (31), which focused only on cases with the highest and lowest estimated doses.
MATERIALS AND METHODS
This study is a retrospective analysis of data on pediatric patients collected in the RAD-IR study (28–30). The RAD-IR study was performed with the approval of the Institutional Review Board (IRB) at each participating institution, and informed consent was obtained as directed by each IRB. The data set used for the secondary analysis performed here was stripped of all protected health information by the principal investigator of the RAD-IR study (DLM) prior to the secondary analysis and was compliant with the Health Insurance Portability and Accountability Act (HIPAA). The study protocol for the secondary analysis was approved by the NIH IRB, and separate informed consent was not required.
Subjects
There were 85 cases in the RAD-IR study less than 18 years old. The current study is focused on the 49 pediatric cases in which intracranial neuroembolization was conducted. This group comprised 21 girls and 28 boys treated at ages between birth and 17 years, with an average age at exposure of 8 years. There were 43 cases of arteriovenous malformations, five of tumors, and one aneurysm case.
Estimates of Absorbed Dose to the Brain
All of the fluoroscopic units used for intracranial embolization in the RAD-IR study were from a single manufacturer and were equipped with built-in dosimeters and a system designed to estimate skin dose (CareGraph; Siemens Medical Systems, Malvern, PA). CareGraph, a skin dose mapping software program, incorporates a mathematical model of patient location and surface shape to calculate the X-ray entrance field size, location and air kerma incident on the skin. The measured dose-area product (DAP), collimator position, tabletop position and C-arm angulation are used to monitor skin irradiation in real time. The peak air kerma level (PSD) and spatial distribution of the dose on the skin (skin dose map) are displayed on a graphical representation of the skin surface. The software also indicates the size of the skin area exposed to dose levels greater than the 95th percentile of dose for that patient (95% area load) (32). Comprehensive evaluation and consistency checks were performed regularly on each fluoroscopy unit to assess the performance of dosimeters (30). While settings could have differed at different institutions, they were likely to have been similar.
Information necessary for dose calculations included patient age, which is correlated with brain size and the degree of attenuation in the brain from self-shielding. Number of images, fluoroscopy time, DAP, and peak skin dose were also recorded at the end of each procedure. Peak skin dose was defined in the RAD-IR study as the maximum air kerma (without backscatter) on any portion of the skin during a procedure (28). Our estimation of dose received by the brain was based on the recorded maximum skin dose (MSD). We converted the recorded values of peak skin dose to MSD by modifying the peak skin dose to include backscatter radiation using correction factors determined from measurements on an anthropomorphic phantom.2 The conversion from peak skin dose to MSD also corrected for systemic inaccuracies in dose estimation of the CareGraph software, requiring a 3% increase of the peak skin dose for the frontal plane and a 67% increase for the lateral plane.2
1. Brain modeling
Calculation of brain dose was based on an age-dependent mathematical model of the brain developed by the Medical Internal Radiation Dose Committee of the Society of Nuclear Medicine (see http://www.snm.org). This model is a description of the size, composition and density of the cranium and brain (considered as two half-ellipsoids) at 0, 1, 5, 10 and 15 years of age and for adults. Bouchet et al. (33–35) provide dimensions and elemental composition of the cranium and the brain as defined by the model. In our study, the brain itself was modeled as a homogeneous soft tissue structure, without differentiation of cerebellum, white matter, cerebral cortex and basal ganglia structures but using the dimensions and skull thickness provided by the Bouchet model (33–35).
The slices in the lowest layers are truncated from full ellipsoids to simulate the region of the brain stem and cerebellum. For the purposes of our dosimetry, the volume of the model, as defined by Bouchet et al. (33–34) for each age, was divided into 1-cm-thick layers, each composed of an array of 1-cm3 cubic volume elements, or voxels, as shown in Fig. 1.
FIG. 1.

Diagram of brain model based on MIRD phantom (35) showing division into layers and volume elements (voxels) for dose calculations. Reprinted with permission from the Society of Nuclear Medicine from: L. G. Bouchet, W. E. Bolch, D. A. Weber, H. L. Atkins, J. W. Poston, Sr., and in collaboration with the MIRD committee: W. E. Bolch (Task Group Leader), A. B. Brill, N. D. Charkes, D. R. Fisher, M. T. Hays, R. W. Howell, J. S. Robertson, J. A. Seigel, S. R. Thomas, E. E. Watson (Chair) and B. W. Wessels, MIRD Phamphlet No. 15: Radionuclide S Values in a Revised Dosimetric Model of the Adult Head and Brain.
2. Simulation of radiation fields
The fluence distribution of photons of different energies emitted by fluoroscopy machines is determined by tube potential (kVp, peak kilovoltage) and beam filtration. Potential and beam filtration are set automatically by modern equipment to optimize image quality but are not automatically or routinely recorded; hence some assumptions were necessary for our dose estimation. From measurements using a RANDO phantom and a fluoroscopy unit used in the RAD-IR study, a range of tube potential and beam filtration values likely to have been used during the pediatric procedures was obtained for children of various ages.3 For each phantom age, values of tube potential and beam filtration were selected within the specified range to generate representative photon spectra (derived from IPEM 1997) that were subsequently used for derivation of dose functions (Table 1).
TABLE 1.
Characteristics of Cranium by Age (36), X-Ray Generation Parameters, by Age, for Posterior-Anterior (PA) and Lateral (LAT) Projections, and Fitted Regression Parameters for Depth-Dose Functions, by Age and Projection
| Phantom age (years): | <1 | 1 | 5 | 10 | 15 | Adult | ||||||
|---|---|---|---|---|---|---|---|---|---|---|---|---|
| Cranium thickness (mm): | 0.12 | 0.18 | 0.33 | 0.41 | 0.45 | 0.53 | ||||||
| Cranium density (gm/cm3): | 1.65
|
1.66
|
1.70
|
1.75
|
1.80
|
1.85
|
||||||
| Projection: | PA | LAT | PA | LAT | PA | LAT | PA | LAT | PA | LAT | PA | LAT |
| X-ray generation parameters: Tube potential (kV), 1 mm aluminum + X mm copper | ||||||||||||
| Tube potential (kV) | 67 | 67 | 67 | 67 | 67 | 67 | 70 | 70 | 72 | 72 | 72 | 72 |
| Filtration (mm copper) | 0.3 | 0.6 | 0.3 | 0.6 | 0.3 | 0.6 | 0.2 | 0.3 | 0.2 | 0.3 | 0.2 | 0.3 |
| Mean energy (keV) | 46.6 | 50.4 | 46.6 | 50.4 | 46.6 | 50.4 | 45.8 | 47.9 | 46.6 | 48.8 | 46.6 | 48.8 |
| Equivalent HVL (mm aluminum) | 5 | 6.3 | 5 | 6.3 | 5 | 6.3 | 4.4 | 5.2 | 4.6 | 5.8 | 4.6 | 5.8 |
| Regression fitted parameters for depth-dose functions | ||||||||||||
| a1 | 0.871 | 0.900 | 0.818 | 0.857 | 0.694 | 0.754 | 0.596 | 0.643 | 0.570 | 0.618 | 0.513 | 0.563 |
| a2 | 0.206 | 0.183 | 0.204 | 0.183 | 0.200 | 0.181 | 0.207 | 0.195 | 0.203 | 0.192 | 0.200 | 0.190 |
| a3 | −0.045 | −0.045 | −0.043 | −0.043 | −0.036 | −0.038 | −0.031 | −0.033 | −0.029 | −0.031 | −0.026 | −0.028 |
| a4 | 0.033 | 0.027 | 0.033 | 0.027 | 0.032 | 0.027 | 0.033 | 0.030 | 0.032 | 0.029 | 0.031 | 0.028 |
In this retrospective study, information on disease location in the brain and on the X-ray field size was not available. To simulate the possible range of exposure conditions and the related brain doses, we assumed the most probable field sizes but also allowed for the less likely possibility of larger field sizes based on extensive clinical experience by one of us (DLM). Field sizes were estimated to vary from a few square centimeters to the size of the entire brain.
As an extreme case, the posterior-anterior (PA) and lateral (LAT) fields were considered to be uniform and as large as the patient’s entire brain. “Uniform” implies that the entrance dose is nearly constant over the area of the field. This extreme case is unlikely in most clinical procedures since radiation fields are generally focused on the lesion.
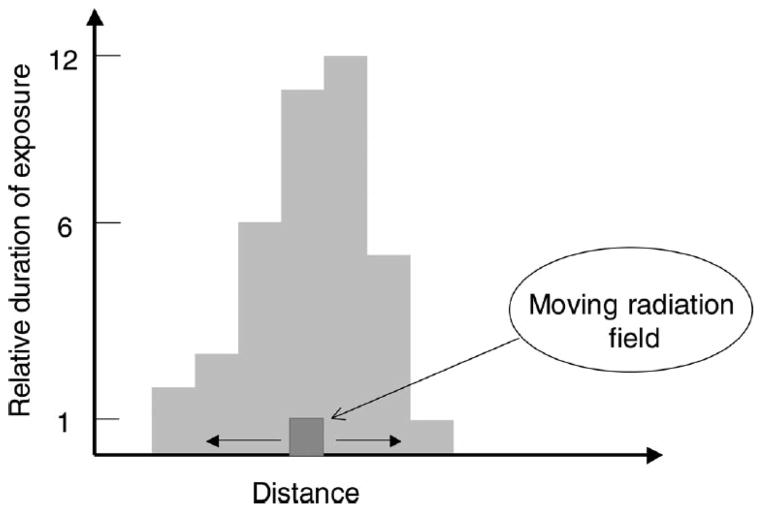
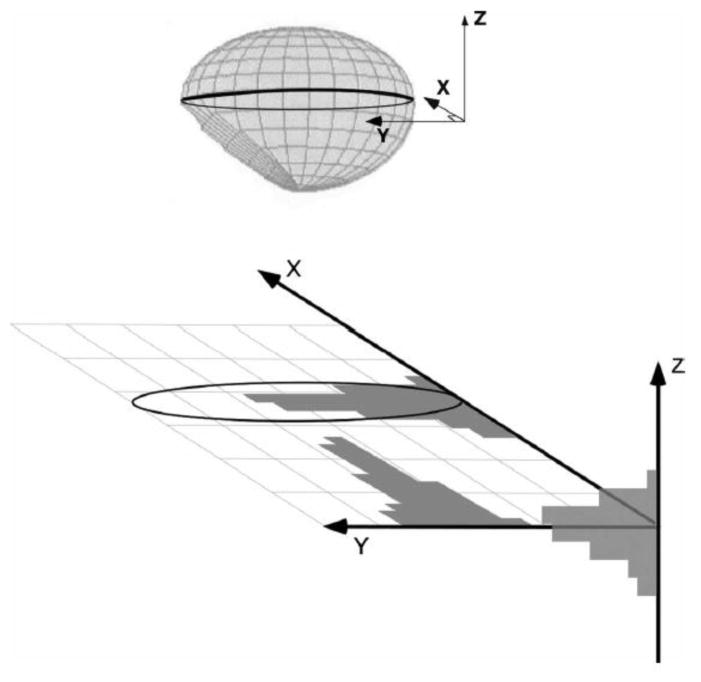
Radiation fields in interventional procedures usually are not fixed; they move in real time to track the movements of the catheter and guidewire. We investigated a variety of possible field sizes, tube orientations and movements, including large and small static and moving fields, as well as combinations, termed non-uniform or composite fields. A non-uniform field implies that the entrance dose varies considerably over the area exposed directly by the small moving field. Non-uniformity is a consequence of variations in the amount of time that the small field remains at each position (Fig. 2). Clinical experience was used to assess the likely exposure conditions for the actual cases analyzed here. Fields are usually collimated on the diseased part of the brain so that the entire brain is not irradiated. We considered two possible locations for a lesion, one at the center of the brain and the other at the edge of the brain, and applied similar composite fields in three dimensions with the highest exposure time focused at the lesion position (Fig. 3).
FIG. 2.
Simulation of a hypothetical composite non-uniform field. The x axis indicates the location of the collimated radiation field along a line from anterior to posterior (for a lateral field) or left to right (for a frontal field). The y axis indicates the beam-on time and by extension the relative radiation dose. If the radiation beam is directed at various locations along the x axis for the times indicated on the y axis, the histogram (in Gy) represents the relative dose distribution along the line.
FIG. 3.
Simulation of irradiation with composite non-uniform radiation fields in three dimensions for a lesion located at the center of the brain. Histograms along each axis represent the relative amount of time the small field is focused on the lesion or, equivalently, the relative amount of dose received at that position.
3. Estimation of absorbed dose to the brain
The average absorbed dose to the brain (absorbed energy per gram of tissue) and the spatial pattern of absorbed dose within the brain were estimated for each age model and for various conditions of exposure. For each exposure condition, average brain dose was normalized to 1 unit entrance dose to allow rescaling of the tissue absorbed dose based on the recorded MSD for each of the study subjects.
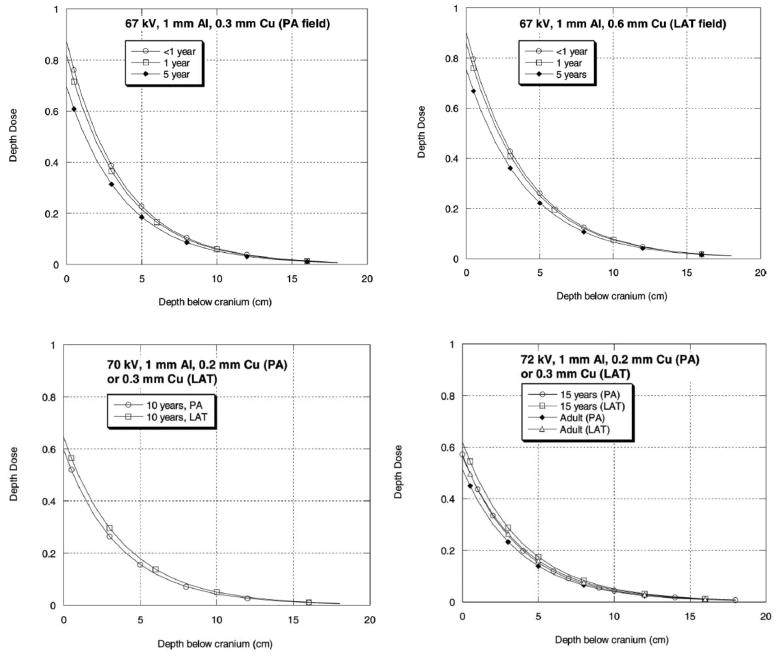
Attenuation of the energy fluence entering the head occurs due to interactions between the incident photons and the bone (cranium), followed by interactions in the soft tissue, resulting in a decrease in absorbed dose with increasing depth in the brain. Radiation absorbed dose was calculated within each voxel of the soft tissue of the brain using published data on the thickness and density of the cranium with age (36) and depth-dose curves derived for the selected tube potential and filtration combinations. Depth-dose curves were derived by calculating the photon fluence as a function of energy at successive 1-cm increments in cranial depth, calculating the kerma at each depth increment, normalizing the data to the cranium entrance point, and fitting a function to the data. We fitted a parametric function of the form
| (1) |
where d is tissue depth (cm) and a1, a2, a3 and a4 are regression coefficients specific for the tube potential and filtration combinations (see Table 1) assigned to each age.
We found the mathematical form of Eq. (1) to be a consistently good fit to the calculated depth-dose values that were based on transmitted energy fluence. For our purposes, this strategy satisfactorily addressed the problem associated with the often inadequate specification of depth dose from low-energy X rays by the first half-value layer (HVL), as discussed by Harrison (37). Absorbed dose to each voxel within the brain (specified by its x, y, z location; see Fig. 3 for definition of coordinate system) was derived from the product of the MSD, the correction for backscatter, and the depth-dose function (see Fig. 4) at the voxel depth, d:
| (2) |
FIG. 4.
Calculated depth-dose curves (depth below cranium) for X-ray generation parameters (see Table 1) for six age groups and PA and LAT projections (also see Table 1 for depth-dose regression parameters).
The spatially averaged absorbed dose to the brain was obtained as the sum of doses in all voxels divided by their total number:
| (3) |
where Dx,y,z is the dose at voxel position x, y, z within the brain model.
4. Validation of dose estimates
A Monte Carlo-based computer dosimetry program [PCXMC; see ref. (38)] for X-ray exposures developed by STUK, the Finnish Radiation Protection Authority, was used for comparison calculations and to validate the dose estimates made here. The phantoms used in PCXMC were those specified by Cristy (39) but further modified as described by Jones and Wall (40) and Zankl et al. (41). Modifications were (1) to include the esophagus, (2) to modify the anterior half of the neck of the phantom to improve the depth of the thyroid and esophagus, (3) to allow for the arms to be removed, and (4) to consider breast material to be a 50:50 mixture of fat and water. PCXMC is generally used to simulate exposure from static diagnostic X-ray examinations; it therefore was not possible to simulate narrow non-uniform (i.e. moving) fields. Only simulations of large uniform fields were compared to PCXMC. We considered two different geometric configurations: (1) the beam originating only from posterior to the patient (i.e. 100% PA), and (2) the beam originating only from the lateral tube (i.e. 100% LAT). They were then combined to provide results for a scenario that is reasonable for actual examinations (50% PA and 50% LAT).
5. Dose to the brain of each subject
Absorbed dose, averaged over the entire brain, was estimated for each subject from the MSD and from our calculations of brain dose per unit entrance dose. For each child, mean dose to the brain was obtained assuming a tube potential and a beam filtration determined as the most likely conditions for their specific age (Table 1). The conditions of exposures simulated for each child were (1) irradiation by two large uniform fields (providing an upper value for the average dose) and (2) irradiation by narrow non-uniform moving fields with the lesion at the center or at the edge of the brain. The proportion of entrance kerma coming for each direction (PA and LAT) was estimated for each child from DAP values recorded for each plane. Because measurements of head size were not available on an individual basis, in this analysis, we assumed that the phantom for the nearest age to the child’s age at time of exposure was the best representation.
6. Sensitivity analyses and evaluation of uncertainties
The most important sources of uncertainties were identified and quantified to assess the sensitivity of our dose calculation to their influence. Sensitivity analyses were performed by varying individual parameters and tabulating the deviance in estimated brain dose from the nominal conditions. These parameters included tube potential and filtration, application of a particular phantom to a specific age, backscatter dependence on depth (42) and spatial resolution (i.e. voxel size).
Six primary sources of uncertainty were described quantitatively in terms of subjective probability density functions (see Table 2). The calculations to propagate uncertainty used Monte Carlo simulation, as discussed in many references on error propagation [see e.g. ref. (43)]. The Monte Carlo calculations for each brain dose calculation were run using commercial software4 that allows for independent combinations of each variable. The distributions of possible true doses were developed from those computations to be used as input for the individual risk calculations (see below).
TABLE 2.
Definition of Parameters used to Quantify Dose Uncertainty (example of a child younger than the phantom, exposed to narrow fields)
| Uncertainty parameters | Distribution type | Distribution parameters | |
|---|---|---|---|
| Accuracy of peak skin dose | Uniform | [0.85, 1.15] | (minimum, maximum) |
| Lack of knowledge of X-ray generation parameters | Normal | [1, 0.1] | (mean, SD) |
| Bias correction for smaller subject cranium | Triangular | [1.0, 1.1, 1.15] | (minimum, mode, maximum) |
| Size of cranium: lack of information on subject | Normal | [1.0, 1.1] | (mean, SD) |
| Backscatter | Triangular | [0.88, 0.94, 1.0] | (minimum, mode, maximum) |
| Spatial resolution | Triangular | [0.80, 0.9, 1.0] | (minimum, mode, maximum) |
| Total uncertainty, UTot | Lognormal | [0.91, 1.21] | (geometric mean, geometric standard deviation) |
We derived an estimate of uncertainty for each absorbed dose based on a multiplicative model of the absorbed dose with uncertain parameters that, depending on the values selected in the simulation, could increase or decrease the estimated brain absorbed dose from the point estimate value. The factors which can substantially affect the accuracy of the estimated dose include the accuracy of measured peak skin dose (and MSD), correctness of our assumptions about the X-ray machine settings (tube potential and beam filtration) that were not recorded at the time of the procedure, variations in the field size and degree of movement from those assumed, as well as the true agreement between the patient head and brain size and the models assumed for each age-dependent phantom. Each of these uncertain additional parameters were modeled subjectively using a probability density function either of uniform, normal or triangular form (Table 2).
The model to determine the distribution of possible true doses for each subject from the point estimate of dose was
| (4) |
where each Ui is a variable representing a source of uncertainty and is numerically defined in Table 2, for a child younger than the phantom and exposure to narrow fields. Note that the overall product of U1 through U6 (termed UTot) is distributed approximately lognormally with geometric mean and geometric standard deviation of 0.91 and 1.21, respectively. In our example case, the simulated geometric mean is 0.91, but in other cases it varied from 0.71 to 0.91, depending on the age-appropriate phantom used to represent the child and conditions of exposure. The geometric standard deviation in our example is 1.21, but in other cases it varied from 1.17 to 1.26.
Risk Projection Methods
Based on the estimated distribution of possible true average brain doses for each subject, the risk for developing brain tumors during the remainder of the subject’s life span5 was derived for each exposure scenario, using a research adaptation of the Interactive RadioEpidemiological Program (IREP) for estimating the likelihood that a given cancer occurrence might be attributed to a given history of radiation exposure (45). Details of the approach are given in the Appendix.
RESULTS
Data used for estimation of dose to the brain are summarized in Table 3 by age interval. The MSD among all patients varied from 240 to 6610 mGy and fluoroscopy time varied from 13 to 314 min. Fluoroscopy time, DAP and MSD all increased with increasing age at treatment. On average, about 60% of the DAP was from the frontal plane and 40% from the lateral plane.
TABLE 3.
Summary of Data on the Pediatric Neuroradiological Cases Used for Dose Calculations
| Age, years (reference age for specifying phantom) | Number of cases | Weight (kg) | Height (cm) | MSDa, mGy (range) | Combined fluoroscopy time, minutes (range) | Total DAP, Gy·cm2 for PA + LAT (range) | Percentage DAP from frontal plane (range) |
|---|---|---|---|---|---|---|---|
| <1 (0) | 3 | 4.5 (1.8–3.6) | 48 (30–64) | 910 (380–1400) | 69 (50–94) | 5.9 (4.3–8.1) | 53 (46–60) |
| 1–2 (1) | 12 | 10.5 (7.7–14.5) | 75 (70–84) | 910(240–1810) | 42 (15–132) | 11.4 (2.5–28.2) | 59 (28–78) |
| 3–7 (5) | 10 | 20.5 (14.5–29.5) | 110 (97–122) | 1640 (400–3190) | 55 (13–132) | 14.3 (2.9–28.5) | 66 (51–81) |
| 8–12 (10) | 5 | 42.3 (34–51.3) | 150 (137–163) | 2370 (1500–3810) | 98 (37–138) | 27.8 (13.9–47.4) | 59 (54–65) |
| 13–17 (15) | 19 | 56.6 (20–88.4) | 163 (122–180) | 2290 (600–6610) | 110 (44–314) | 31.3 (7.2–89.8) | 63 (47–100) |
| Overall | 49 | 33 (1.8–88.4) | 122 (30–180) | 1740 (240–6610) | 79 (13–314) | 20.8 (2.5–89.8) | 62 (28–100) |
Maximum skin dose.
Estimates of Absorbed Dose to the Brain
1. Irradiation by two large uniform fields
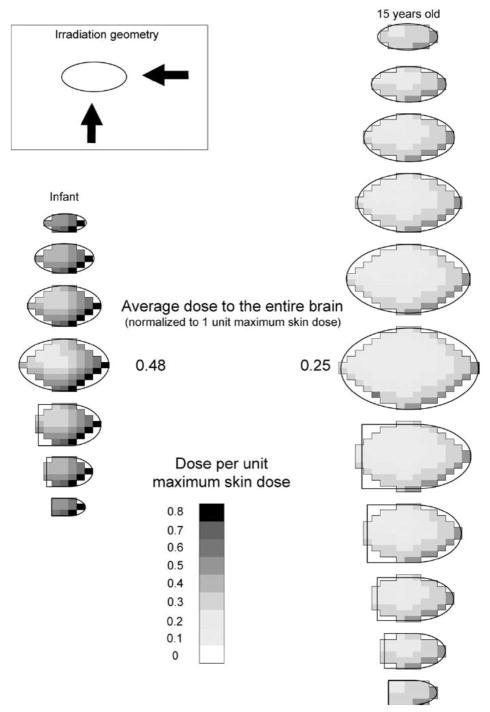
We simulated irradiation of the brain by two large uniform fields (PA + LAT) for each age-specific brain model. Absorbed dose was calculated in all voxels of the brain mass to visualize the approximate spatial pattern of absorbed dose within each layer (Fig. 1). Figure 5 shows the spatial pattern of absorbed radiation dose in several layers of the infant’s and adolescent’s brain (15 years old) with 50% PA and 50% lateral exposure.
FIG. 5.
Spatial pattern of dose in the layers constituting the brain: irradiation by two large uniform fields.
The adolescent cranium is much thicker than the infant’s, resulting in greater radiation attenuation. The highest dose per unit MSD in any voxel of the adolescent brain is therefore less than that for the infant brain (0.56 for the adolescent compared to 0.78 for the infant). When normalized absorbed doses in all voxels are averaged, the average dose to the adolescent brain per unit MSD is also lower than the corresponding value for the infant patient (0.25 compared to 0.48).
2. Irradiation by narrow non-uniform (composite) fields
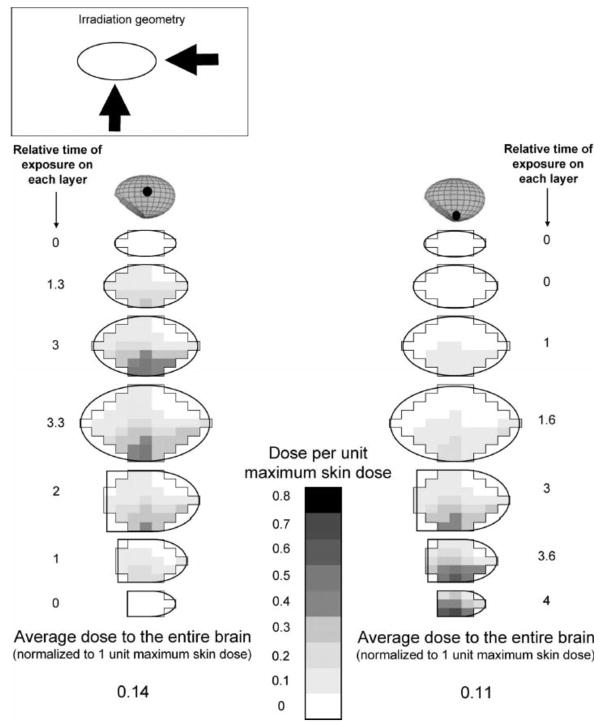
Figure 6 shows the spatial pattern of absorbed dose in all layers of the infant’s brain, normalized to MSD, when typical composite fields are applied for a lesion located in the middle (Fig. 3) or at the lower edge of the brain. It also shows the proportion of time the small field is centered on each layer. Because there is less overlap between the two small fields compared to large uniform fields, the average dose (per unit MSD) is reduced for the infant to 0.14 if the lesion is at the center or to 0.11 if it is at the edge of the brain. In the latter case, overlapping of the two fields in the bottom-most layer is likely, and some voxels in this region will demonstrate high doses. Similarly, radiation absorbed dose to the adolescent brain per unit MSD (not shown) is reduced to 0.03 and 0.01 in the center and bottom-most layer, respectively, as much of the brain is not exposed.
FIG. 6.
Spatial pattern of dose in brain of infant from irradiation by narrow non-uniform fields (black dot indicates location of lesion and center of examination field).
3. Validation of dose estimates
The relative difference between the calculated brain dose (per unit MSD) from our calculations and from PCXMC (38), averaged over all ages, was less than 10% for 100% PA, less than 15% for 100% LAT, and less than 10% for a 50% PA-50% LAT distribution. The close agreement between estimates by these different methods supports the validity of the presented dose estimation strategy and the average brain doses presented here.
4. Average dose to the entire brain in RAD-IR patients
Absorbed doses for each case were estimated for the tube potential-filtration combination selected for each age (Table 1) and for various combinations of field sizes and orientations. Histograms of estimated mean doses to the brain are provided in Figs. 7A, 8A and 9A for various possible exposure conditions: (1) if the brain is irradiated by two uniform fields and (2) if the brain is irradiated by narrow non-uniform moving fields with the pathologic focus (a) at the center of the brain or (b) at the bottom of the brain.
FIG. 7.
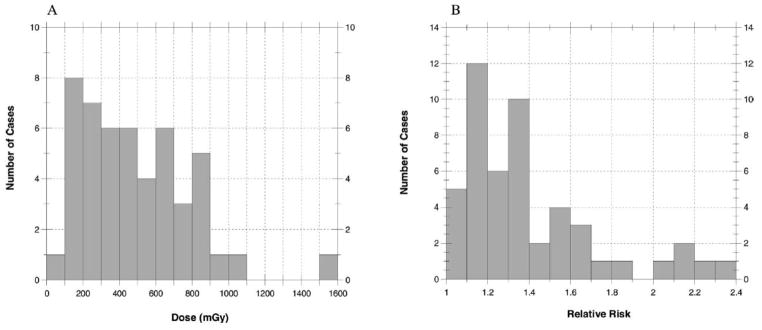
Average absorbed doses (mGy) to the brain (panel A) and relative risk of brain tumor (panel B) for 49 cases when exposed to large uniform fields. The maximum dose is 1600 mGy and the maximum relative risk is 2.4
FIG. 8.
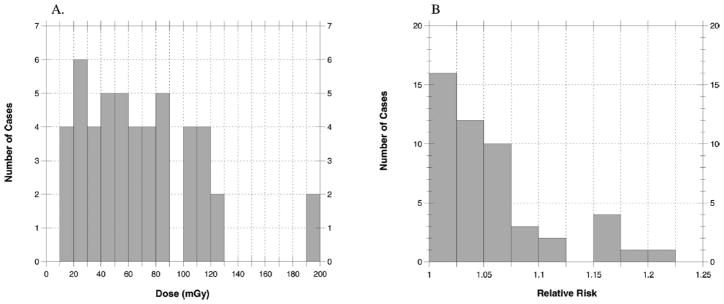
Average absorbed doses (mGy) to the brain (panel A) and relative risk of brain tumor (panel B) for 49 cases when exposed to narrow nonuniform fields with pathologic focus in the center of the brain. The maximum dose is 200 mGy and the maximum relative risk is 1.25.
FIG. 9.
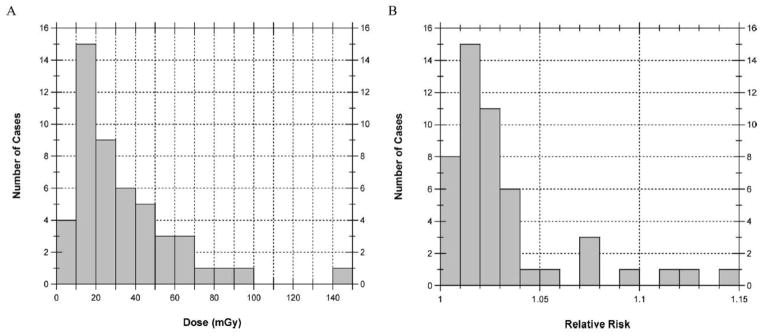
Average absorbed doses (mGy) to the brain (panel A) and relative risk of brain tumor (panel B) for 49 cases when exposed to narrow nonuniform fields with pathologic focus at the inferior margin of the brain. The maximum dose is 150 mGy and the maximum relative risk is 1.15.
Statistical summaries of these distributions are provided in Table 4. When the irradiated area is at the superior portion of the brain, doses were very similar to those shown for irradiation at the inferior portion of the brain (data not shown). For our 49 cases, the median of the individual absorbed doses, each averaged over the entire brain, was 440 mGy (range 50–2700 mGy) assuming large uniform fields. Assuming collimated fields focused near the center of the brain, the median dose was estimated to be 60 mGy (range 8–310 mGy). Absorbed doses averaged over the brain from a collimated field focused near the inferior margin of the brain were even lower, with a median of 25 mGy (range 3–200 mGy). In that case, the absorbed dose averaged over the brain was less because the superior layers received little if any exposure.
TABLE 4.
Statistical Summary of Estimated Doses (mGy) Averaged over the Entire Brain for the 49 Cases Assuming Large Uniform Fields and Narrow Non-uniform Fields with the Pathologic Focus at One of Two Sites (center and bottom of brain)
| Condition of exposure | n | Minimum (range) | Maximum (range) | Arithmetic mean (range) | Median (range) | Standard deviation (range) |
|---|---|---|---|---|---|---|
| Large uniform fields | 49 | 90 (50–900) | 1590 (140–2740) | 490 (240–760) | 440 (210–660) | 300 (150–490) |
| Narrow non-uniform composite fields | ||||||
| Pathologic focus: Center of the brain | 49 | 15 (8–24) | 191 (111–314) | 68 (33–102) | 61 (28–89) | 42 (21–62) |
| Pathologic focus: Bottom of the brain | 49 | 6 (3–9) | 149 (70–200) | 33 (16–50) | 25 (12–36) | 27 (13–37) |
Overall, we found that patient dose is dramatically reduced if the brain is irradiated with narrow nonuniform moving fields (Figs. 8A and 9A) compared to irradiation by two large uniform fields (Fig. 7A). Since actual procedures can combine all three theoretical exposure conditions in differing proportions, one patient’s dose can vary substantially from that of other patients of similar age.
5. Assessment of uncertainties and dose distribution
Because the median value of the overall uncertainty distribution, UTot, varied between 0.71 and 0.91, the median value of the mean brain dose after accounting for uncertainties (where Dose = Dest × UTot) was about 9% to 29% lower than the point estimates (Dest) originally calculated. However, because the geometric standard deviation of UTot was about 1.20 (1.17–1.26), the 90% confidence interval about the median dose ranged from about 70% to about 130% of the median value. While some reductions in uncertainty of individual doses could be achieved with more precise input data, the uncertainty of individual doses was almost always a minor contributor of the total uncertainty of the predicted brain tumor risks.
Lifetime Tumor Risk in RAD-IR Patients
Lifetime relative risks (RR) estimated for the 49 cases in our study population are summarized in histograms for non-collimated fields (Fig. 7B), for collimated fields with a focus near the center of the brain (Fig. 8B), and for collimated fields with a focus near the inferior margin of the brain (Fig. 9B). The mean, minimum and maximum RR values tabulated in Table 5 for the three different exposure scenarios can be compared in relative terms using the average lifetime, gender-averaged baseline rate of 57 cases per 10,000 in the absence of radiation exposure (46). For example, the mean RR of 1.40 for two uniform fields corresponds to a lifetime tumor rate of 80 per 10,000, and the mean RR values of 1.06 and 1.03 for collimated exposures with central and peripheral focus, respectively, correspond to lifetime tumor rates of 60 and 59 per 10,000.
TABLE 5.
Statistical Summary of Estimated Relative Risks of Brain Tumors for the 49 Cases Assuming Large Uniform Fields and Narrow Non-uniform Fields with the Pathologic Focus at One of Two Sites (center and bottom of brain)
| Condition of exposure | Minimum | Maximum | Arithmetic mean | Median | Standard deviation |
|---|---|---|---|---|---|
| Large uniform fields | 1.06 | 2.38 | 1.40 | 1.30 | 0.32 |
| Narrow non-uniform composite fields | |||||
| Pathologic focus: Center of the brain | 1.01 | 1.20 | 1.06 | 1.04 | 0.05 |
| Pathologic focus: Bottom of the brain | 1.00 | 1.14 | 1.03 | 1.02 | 0.03 |
Individual relative risk estimates and their uncertainty intervals are shown separately by sex in Fig. 10. Reflecting data from the RERF Tumor Registry (47), dose-specific relative risks for CNS tumors are about twice as high for females compared to males, and their uncertainty limits are correspondingly wider. There are significant uncertainties associated with the estimated RRs, particularly for exposure to large uniform fields. The 90% confidence interval of RR for uniform fields is 1.00 to 9.81, with a central value of 1.40. If the brain is irradiated by narrow collimated fields focused at the center or at the edge of the organ, the 90% confidence intervals of RR are 1.00 to 2.31 and 1.00 to 1.99, respectively, with central values of 1.06 and 1.03.
FIG. 10.
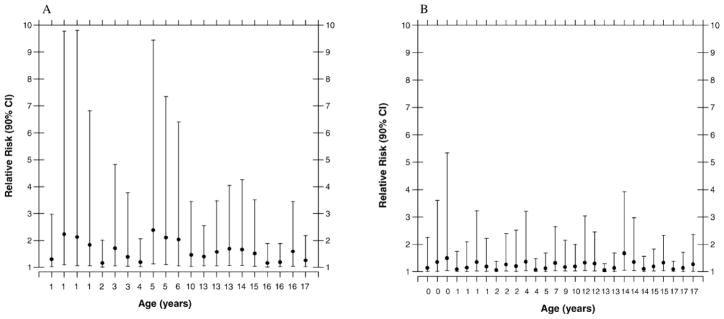
Estimated relative risk (central estimate and 90% confidence interval) of radiation-related brain tumor for (panel A) females, n = 21, and (panel B) males, n = 28, when exposed to non-collimated uniform fields.
DISCUSSION
There is no standard method for calculating absorbed dose to the brain from interventional neuroradiology procedures in children. Hence we developed a dose calculation strategy to estimate the spatial pattern as well as average dose to the organ. This strategy can be used to estimate the lifetime risk of developing radiogenic tumors if the patient’s age at exposure, the proportion of exposure from each field, and the MSD are reasonably well known. Four variables have a substantial impact on average brain dose: age (related to size, density and thickness of the brain and cranium), duration of fluoroscopy, portion of the brain irradiated, and degree of overlap of radiation fields.
Maximum skin doses are lower for smaller children, as shown in Table 6, summarizing our dose results. However, the highest average absorbed dose to the brain per unit MSD is likely for the youngest patients because of low attenuation by the infant cranium. As shown, the ratio between dose to the brain and maximum skin dose for newborns is twice that for teenagers.
TABLE 6.
Comparison of Maximum Skin Dose and Dose to the Brain for the 49 Cases, Grouped by Age, Assuming Large Uniform Fields
| Age, years (reference age for specifying phantom) | Number of cases | MSDa, mGy (SD) | Average dose to the brain two uniform fields (SD) | Ratio dose to the brain/MSD |
|---|---|---|---|---|
| <1 (0) | 3 | 910 (510) | 430 (240) | 0.48 |
| 1–2 (1) | 12 | 910 (570) | 350 (220) | 0.38 |
| 3–7 (5) | 10 | 1640 (1040) | 500 (330) | 0.30 |
| 8–12 (10) | 5 | 2370 (990) | 600 (250) | 0.25 |
| 13–17 (15) | 19 | 2290 (1400) | 550 (340) | 0.24 |
Maximum skin dose.
Irradiation of the brain by two large uniform fields is an unusual case that provides an extreme value of the average dose to the brain and hence an extreme estimate of the lifetime risk of developing brain tumor. If radiation procedures are conducted with care to limit exposure, the lifetime risk of developing a radiation-related brain tumor does not appear to be greatly enhanced compared to the baseline risk for nonexposed children. Collimating radiation fields tightly around the lesion can reduce average dose to the brain by 70% for the infant and 90% for the adolescent. It is highly desirable, if possible, that PA and lateral fields do not overlap on the skin surface during the course of the procedure to reduce the risk of acute skin effects and to reduce the likelihood of reaching high radiation doses in any part of the brain that could increase the long-term risk of cancer or benign tumors.
Our dose calculation method provides a range of possible true doses for each of the conditions modeled. These have been verified against another well-tested program, but specific and precise information from a specific case is necessary to accurately determine the true organ dose per patient. The certainty of individual dose estimates could be improved with better knowledge of the irradiated portion of the brain, the distribution of the dose at the skin of the patient, and the settings of the fluoroscopy equipment. This information is not normally recorded and was not available for the cohort we studied. Records of anthropomorphic data such as head circumference could also improve individual estimation of brain dose. Dose results could also be improved by a better determination of entrance skin dose from, for example, dosimetric films placed under the patient or thermoluminescence and optically simulated luminescence dosimeters on strategic locations around the head (48). These methods are occasionally used clinically but are expensive and generally intrusive during clinical procedures. Maps of skin dose, which can be provided by software, e.g. CareGraph (32), would have eliminated the need to consider various theoretical exposure simulations. Unfortunately, these maps could not be obtained retrospectively.
In the present work, major sources of uncertainty bearing on doses were quantified by deriving probability distributions based on the best information available. Other sources of uncertainty were evaluated but were not quantified because their overall impact on the average brain dose is believed to be negligible. Those sources include the impact of penumbra and beam divergence, which are not explicitly accounted for in the calculations. In our dose estimation, the incident radiation beam is considered completely uniform from edge to edge, without a penumbra. In actuality, dose decreases slightly from the flat central region of the field to the edge, with a sigmoid shape. Penumbra width is usually small in comparison to typical field width; it depends on beam energy, source size, source–skin distance, source–collimator distance and depth. The penumbra would tend to blur the spatial pattern only but would not affect the average estimate of brain dose.
Another simplification used to derive patterns of absorbed dose in the brain is the assumption that the irradiated volume remains constant in size between the entrance point on one side of the brain and the exit point on the opposite side. In reality, there is some beam divergence, though the degree of divergence should be small from the entrance side of the skull to the exit side since the source-to-skin distance is much larger than the head dimensions. Possible divergence in field size from one side of the head to the other is greatest for the adult brain because it is the widest of the patient studied. Beam divergence was estimated to increase field size at the exit point by 10 to 20%. Divergence tends to reduce assessed dose per voxel for those voxels within the field because of beam spread, but it does not reduce the average brain dose. Penumbra and beam divergence therefore were not quantified. Though our estimates could be improved modestly by more detailed modeling, they are reasonable given the level of information available. The comparison calculations we made using PCXMC which implicitly included in-tissue scattering, beam divergence, etc. were within about 10% of our average brain absorbed dose estimates.
We also explored the implications of these typical brain doses on lifetime risk of developing a brain tumor using a particular risk estimation algorithm, IREP (45), which is widely used for radiation exposure compensation-claims adjudication. While the IREP algorithm is due to be revised in the future based on newer data (49, 50), the current IREP estimates are in use today and serve to illustrate the health implications of the estimated doses.
As an indication of some changes that may be expected with the incorporation of newer data, radiation-related CNS tumor risks estimated by Preston et al. (49) are somewhat higher than the previous estimates of Thompson et al. (47) that were the basis of the present IREP risk factors. Also, there is evidence of differential radiation susceptibility for different types of brain tumors, such as schwannomas, gliomas and meningiomas (49), which tend to occur in different parts of the brain. Thus estimating risk as a function of dose averaged over the entire brain may not be the ideal predictor of specific health outcomes. A relatively minor consideration is that the IREP program estimates pertain to all central nervous system (CNS) tumors, given that only 5% of such tumors occur outside the brain (51).
The uncertainty limits for individual lifetime risk estimates reflect uncertainties in organ-averaged absorbed doses, statistical uncertainties and other sources of uncertainty inherent in the IREP algorithm. The most important of those sources are statistical uncertainty of the risk estimates (the database for radiation-related CNS tumor risk among A-bomb survivors is of modest size) and uncertainty about the effectiveness of medical X rays at energies of a few tens of keV compared to the high-energy γ radiation (hundreds of keV) from atomic bombs (reflected in the error bars on the individual point estimates in Fig. 10).
CONCLUSION
Interventional fluoroscopy is a valuable treatment modality for a wide variety of diseases and disorders, but it requires ionizing radiation to provide real-time imaging guidance. If procedures are long and complex, imaging may result in doses sufficiently high to induce damaging skin effects. The present study shows the impact of optimizing radiation dose on the risk of tumor induction. Patients who undergo interventional neuroradiology procedures often require multiple interventional fluoroscopy procedures and radiological imaging studies. Our work provided an estimate of dose and risk for a single procedure. Due to the limitations of the data collection strategy in the RAD-IR study, we were not able to estimate precisely the true cumulative dose to each patient from all procedures they might have received. It would be of interest to follow these patients to estimate the total dose received by their brain over several years of treatment as well as any detrimental health outcomes that might result. However, doses remain lower than radiotherapy doses and risks are not highly enhanced.
Supplementary Material
References
- 1.ICRP. Annals of the ICRP. 2. Vol. 30. Pergamon Press; Oxford: 2000. Avoidance of Radiation Injuries from Medical Interventional Procedures. Publication 85. [DOI] [PubMed] [Google Scholar]
- 2.Cousins C, Sharp C. Medical interventional procedures-reducing the radiation risks. Clin Radiol. 2004;59:468–473. doi: 10.1016/j.crad.2003.11.014. [DOI] [PubMed] [Google Scholar]
- 3.Koenig TR, Wolff D, Mettler FA, Wagner LK. Skin injuries from fluoroscopically guided procedures: part 1, characteristics of radiation injury. Am J Roentgenol. 2001;177:3–11. doi: 10.2214/ajr.177.1.1770003. [DOI] [PubMed] [Google Scholar]
- 4.Koenig TR, Mettler FA, Wagner LK. Skin injuries from fluoroscopically guided procedures: part 2, review of 73 cases and recommendations for minimizing dose delivered to patient. Am J Roentgenol. 2001;177:13–20. doi: 10.2214/ajr.177.1.1770013. [DOI] [PubMed] [Google Scholar]
- 5.Miller DL, Balter S, Noonan PT, Georgia JD. Minimizing radiation-induced skin injury in interventional radiology procedures. Radiology. 2002;225:329–336. doi: 10.1148/radiol.2252011414. [DOI] [PubMed] [Google Scholar]
- 6.Vaño E, Goicolea J, Galvan C, Gonzalez L, Meiggs L, Ten JI, Macaya C. Skin radiation injuries in patients following repeated coronary angioplasty procedures. Br J Radiol. 2001;74:1023–1031. doi: 10.1259/bjr.74.887.741023. [DOI] [PubMed] [Google Scholar]
- 7.Vaño E, Gonzalez L, Ten JI, Fernandez JM, Guibelalde E, Macaya C. Skin dose and dose-area product values for interventional cardiology procedures. Br J Radiol. 2001;74:48–55. doi: 10.1259/bjr.74.877.740048. [DOI] [PubMed] [Google Scholar]
- 8.United Nations Scientific Committee on the Energy of Atomic Radiation. Sources and Effects of Ionizing Radiation, Volume II, Effects. United Nations; New York: 2000. [Google Scholar]
- 9.Axelsson B, Khalil C, Lidegran M, Schuwert P, Mortensson W. Estimating the effective dose to children undergoing heart investigations—a phantom study. Br J Radiol. 1999;72:378–383. doi: 10.1259/bjr.72.856.10474499. [DOI] [PubMed] [Google Scholar]
- 10.Bacher K, Bogaert E, Lapere R, De WD, Thierens H. Patient-specific dose and radiation risk estimation in pediatric cardiac catheterization. Circulation. 2005;111:83–89. doi: 10.1161/01.CIR.0000151098.52656.3A. [DOI] [PubMed] [Google Scholar]
- 11.Boothroyd A, McDonald E, Moores BM, Sluming V, Carty H. Radiation exposure to children during cardiac catheterization. Br J Radiol. 1997;70:180–185. doi: 10.1259/bjr.70.830.9135445. [DOI] [PubMed] [Google Scholar]
- 12.Callisen HH, Norman A, Adams FH. Absorbed dose in the presence of contrast agents during pediatric cardiac catheterization. Med Phys. 1979;6:504–509. doi: 10.1118/1.594613. [DOI] [PubMed] [Google Scholar]
- 13.Campbell RM, Strieper MJ, Frias PA, Jeager G, Balfour G, Costello L, Sullivan KM. Quantifying and minimizing radiation exposure during pediatric cardiac catheterization. Pediatr Cardiol. 2005;26:29–33. doi: 10.1007/s00246-004-0353-x. [DOI] [PubMed] [Google Scholar]
- 14.Geise RA, Peters NE, Dunnigan A, Milstein S. Radiation doses during pediatric radiofrequency catheter ablation procedures. Pacing Clin Electrophysiol. 1996;19:1605–1611. doi: 10.1111/j.1540-8159.1996.tb03187.x. [DOI] [PubMed] [Google Scholar]
- 15.Leibovic SJ, Fellows KE. Patient radiation exposure during pediatric cardiac catheterization. Cardiovasc Intervent Radiol. 1983;6:150–153. doi: 10.1007/BF02552767. [DOI] [PubMed] [Google Scholar]
- 16.Li LB, Kai M, Kusama T. Radiation exposure to patients during paediatric cardiac catheterisation. Radiat Prot Dosimetry. 2001;94:323–327. doi: 10.1093/oxfordjournals.rpd.a006506. [DOI] [PubMed] [Google Scholar]
- 17.Martin EC, Olson A. Radiation exposure to the paediatric patient from cardiac catheterization and angiocardiography. Br J Radiol. 1980;53:100–106. doi: 10.1259/0007-1285-53-626-100. [DOI] [PubMed] [Google Scholar]
- 18.Moore JD, Shim D, Sweet J, Arheart KL, Beekman RH., III Radiation exposure to children during coil occlusion of the patent ductus arteriosus. Catheter Cardiovasc Interv. 1999;47:449–454. doi: 10.1002/(SICI)1522-726X(199908)47:4<449::AID-CCD13>3.0.CO;2-H. [DOI] [PubMed] [Google Scholar]
- 19.Rassow J, Schmaltz AA, Hentrich F, Streffer C. Effective doses to patients from paediatric cardiac catheterization. Br J Radiol. 2000;73:172–183. doi: 10.1259/bjr.73.866.10884731. [DOI] [PubMed] [Google Scholar]
- 20.Shim D, Kimball TR, Michelfelder EC, Koons L, Beekman RH., III Exposure to ionizing radiation in children undergoing Amplatzer device placement to close atrial septal defects. Catheter Cardiovasc Interv. 2000;51:451–454. doi: 10.1002/1522-726x(200012)51:4<451::aid-ccd16>3.0.co;2-l. [DOI] [PubMed] [Google Scholar]
- 21.Waldman JD, Rummerfield PS, Gilpin EA, Kirkpatrick SE. Radiation exposure to the child during cardiac catheterization. Circulation. 1981;64:158–163. doi: 10.1161/01.cir.64.1.158. [DOI] [PubMed] [Google Scholar]
- 22.Wu JR, Huang TY, Wu DK, Hsu PC, Weng PS. Radiation exposure of pediatric patients and physicians during cardiac catheterization and balloon pulmonary valvuloplasty. Am J Cardiol. 1991;68:221–225. doi: 10.1016/0002-9149(91)90747-9. [DOI] [PubMed] [Google Scholar]
- 23.Bolch WE, Pomije BD, Sessions JB, Arreola MM, Williams JL, Pazik FD. A video analysis technique for organ dose assessment in pediatric fluoroscopy: applications to voiding cystourethrograms (VCUG) Med Phys. 2003;30:667–680. doi: 10.1118/1.1561624. [DOI] [PubMed] [Google Scholar]
- 24.Hentschel F, Habermaas I, Bien S, Seeger W. Estimation of radiation exposure in interventional neuroradiology of the head in children compared to exposure of adult patients. Rofo. 1996;165:176–180. doi: 10.1055/s-2007-1015735. in German. [DOI] [PubMed] [Google Scholar]
- 25.Pettersson HB, Falth-Magnusson K, Persliden J, Scott M. Radiation risk and cost-benefit analysis of a paediatric radiology procedure: results from a national study. Br J Radiol. 2005;78:34–38. doi: 10.1259/bjr/79694026. [DOI] [PubMed] [Google Scholar]
- 26.Rose SC, Andre MP, Roberts AC, Kinney TB, Valji K, Ronaghi AH, Hassanein TI, Lavine JE, Hart ME, Khanna A. Integral role of interventional radiology in the development of a pediatric liver transplantation program. Pediatr Transplant. 2001;5:331–338. doi: 10.1034/j.1399-3046.2001.00013.x. [DOI] [PubMed] [Google Scholar]
- 27.Swoboda NA, Armstrong DG, Smith J, Charkot E, Connolly BL. Pediatric patient surface doses in neuroangiography. Pediatr Radiol. 2005;35:859–866. doi: 10.1007/s00247-005-1496-5. [DOI] [PubMed] [Google Scholar]
- 28.Miller DL, Balter S, Cole PE, Lu HT, Schueler BA, Geisinger M, Berenstein A, Albert R, Georgia JD, Anderson J. Radiation doses in interventional radiology procedures: the RAD-IR study: part I: overall measures of dose. J Vasc Interv Radiol. 2003;14:711–727. doi: 10.1097/01.rvi.0000079980.80153.4b. [DOI] [PubMed] [Google Scholar]
- 29.Miller DL, Balter S, Cole PE, Lu HT, Berenstein A, Albert R, Schueler BA, Georgia JD, Noonan PT, Anderson J. Radiation doses in interventional radiology procedures: the RAD-IR study: part II: skin dose. J Vasc Interv Radiol. 2003;14:977–990. doi: 10.1097/01.rvi.0000084601.43811.cb. [DOI] [PubMed] [Google Scholar]
- 30.Balter S, Schueler BA, Miller DL, Cole PE, Lu HT, Berenstein A, Albert R, Georgia JD, Noonan PT, Anderson J. Radiation doses in interventional radiology procedures: the RAD-IR Study. Part III: Dosimetric performance of the interventional fluoroscopy units. J Vasc Interv Radiol. 2004;15:919–926. doi: 10.1097/01.RVI.0000130864.68139.08. [DOI] [PubMed] [Google Scholar]
- 31.Thierry-Chef I, Simon SL, Miller DL. Radiation dose and cancer risk among pediatric patients undergoing interventional neuroradiology procedures. Pediatr Radiol. 2006;36(Suppl 14):159–162. doi: 10.1007/s00247-006-0206-2. [DOI] [PMC free article] [PubMed] [Google Scholar]
- 32.Den BA, de Feijter PJ, Serruys PW, Roelandt JR. Real-time quantification and display of skin radiation during coronary angiography and intervention. Circulation. 2001;104:1779–1784. doi: 10.1161/hc4001.097057. [DOI] [PubMed] [Google Scholar]
- 33.Bouchet LG, Bolch WE, Weber DA, Atkins HL, Poston JW., Sr MIRD Pamphlet No. 15: Radionuclide S values in a revised dosimetric model of the adult head and brain. Medical Internal Radiation Dose. J Nucl Med. 1999;40:62S–101S. [PubMed] [Google Scholar]
- 34.Bouchet LG, Bolch WE. Five pediatric head and brain mathematical models for use in internal dosimetry. J Nucl Med. 1999;40:1327–1336. [PubMed] [Google Scholar]
- 35.Bouchet LG, Bolch WE, Wessels BW, Weber DA. MIRD Head and Brain Dosimetry. Society of Nuclear Medicine; Reston, VA: 1999. [Google Scholar]
- 36.ICRP. Basic Anatomical and Physiological Data for use in Radiological Protection: The Skeleton. Pergamon Press; Oxford: 1995. Report 70. [PubMed] [Google Scholar]
- 37.Harrison RM. Low energy X-ray depth dose data for use in radiotherapy—comments on the review of BJR Supplement 17. Br J Radiol. 1997;70:946–949. doi: 10.1259/bjr.70.837.9498916. [DOI] [PubMed] [Google Scholar]
- 38.Tapiovaara M. A PC-Based Monte Carlo Program for Calculating Patient Dose in Medical X-Rays Examinations. Finnish Centre for Radiation and Nuclear Safety; Helsinki: 1997. [Google Scholar]
- 39.Cristy M. Mathematical Phantoms Representing Children of Various Ages for Use in Estimates of Internal Dose. Oak Ridge National Laboratory; Oak Ridge, TN: 1980. Report NUREG/CR-1159, ORNL/NUREG/TM-367. [Google Scholar]
- 40.Jones DG, Wall BF. Organ Doses from Medical X-Ray Examinations Calculated Using Monte Carlo Techniques. HMSO; London: 1985. Report NRPB-R186. [Google Scholar]
- 41.Zankl M, Petoussi N, Drexler G. Effective dose and effective dose equivalent—the impact of the new ICRP definition for external photon irradiation. Health Phys. 1992;62:395–399. doi: 10.1097/00004032-199205000-00002. [DOI] [PubMed] [Google Scholar]
- 42.Klevenhagen SC. The build-up of backscatter in the energy range 1 mm Al to 8 mm Al HVT. Phys Med Biol. 1982;27:1035–1043. [Google Scholar]
- 43.NCRP. A Guide for Uncertainty Analysis in Dose and Risk Assessments Related to Environmental Contamination. National Council on Radiation Protection and Measurements; Bethesda, MD: 1996. Commentary No. 14. [Google Scholar]
- 44.Arias E. National Vital Statistics Reports. 14. Vol. 54. National Center for Health Statistics; Hyattsville, MD: 2006. United States Life Tables, 2003. [PubMed] [Google Scholar]
- 45.NIH Radioepidemiological Tables. National Institutes of Health; Bethesda, MD: 2003. Report of the NCI-CDC Working Group to Revise the 1985. Publication no. 03-5387. [Google Scholar]
- 46.Ries LAG, Eisner MP, Kosary CL. SEER Cancer Statistics Review, 1975–2002. National Cancer Institute; Bethesda, MD: 2005. [Google Scholar]
- 47.Thompson DE, Mabuchi K, Ron E, Soda M, Tokunaga M, Ochikubo S, Sugimoto S, Ikeda T, Terasaki M, Izumi S. Cancer incidence in atomic bomb survivors. Part II: Solid tumors, 1958–1987. Radiat Res. 1994;137(Suppl):S17–S67. [PubMed] [Google Scholar]
- 48.Mooney RB, McKinstry CS, Kamel HA. Absorbed dose and deterministic effects to patients from interventional neuroradiology. Br J Radiol. 2000;73:745–751. doi: 10.1259/bjr.73.871.11089467. [DOI] [PubMed] [Google Scholar]
- 49.Preston DL, Ron E, Yonehara S, Kobuke T, Fujii H, Kishikawa M, Tokunaga M, Tokuoka S, Mabuchi K. Tumors of the nervous system and pituitary gland associated with atomic bomb radiation exposure. J Natl Cancer Inst. 2002;94:1555–1563. doi: 10.1093/jnci/94.20.1555. [DOI] [PubMed] [Google Scholar]
- 50.National Research Council, Committee on the Biological Effects of Ionizing Radiation. Heath Risk from Exposure to Low Level of Ionizing Radiation (BEIR V) National Academy Press; Washington, DC: 2005. [Google Scholar]
- 51.Preston-Martin SS, Mack WJ. Neoplasms of nervous system. In: Schottenfeld D, Fraumeni JF Jr, editors. Cancer Epidemiology and Prevention. Oxford University Press; New York: 1996. pp. 1231–1281. [Google Scholar]
Associated Data
This section collects any data citations, data availability statements, or supplementary materials included in this article.


