Abstract
Background:
Finding new tolerable methods in weight loss has largely been an issue of interest for specialists. Present study compared a novel method of calorie shifting diet (CSD) with classic calorie restriction (CR) on weight loss in overweight and obese subjects.
Methods:
Seventy-four subjects (body mass index ≥25; 37) were randomized to 4 weeks control diet, 6 weeks CSD or CR diets, and 4 weeks follow-up period. CSD consisted of three phases each lasts for 2 weeks, 11 days calorie restriction which included four meals every day, and 4 h fasting between meals follow with 3 days self-selecting diet. CR subjects receive determined low calorie diet. Anthropometric and metabolic measures were assessed at different time points in the study.
Results:
Four weeks after treatment, significant weight, and fat loss started (6.02 and 5.15 kg) and continued for 1 month of follow-up (5.24 and 4.3 kg), which was correlated to the restricted energy intake (P < 0.05). During three CSD phases, resting metabolic rate tended to remain unchanged. The decrease in plasma glucose, total cholesterol, and triacylglycerol were greater among subjects on the CSD diet (P < 0.05). Feeling of hunger decreased and satisfaction increased among those on the CSD diet after 4 weeks (P < 0.05).
Conclusions:
The CSD diet was associated with a greater improvement in some anthropometric measures, Adherence was better among CSD subjects. Longer and larger studies are required to determine the long-term safety and efficacy of CSD diet.
Keywords: Calorie shifting diet, calorie restriction diet, obesity, resting metabolic rate, weight loss
INTRODUCTION
One major medical problem for developed countries is the high incidence of obesity that has grown rapidly during recent decades.[1] The current prevalence of obesity is estimated in approximately 400 million people worldwide.[2] Recent descriptive studies suggest that Iran has geared in the nutrition and epidemiological transition processes. Therefore, while the problems of undernutrition (e.g., growth retardation and micronutrient deficiencies) still exist, the burden of overweight/obesity and diet-related chronic diseases is increasing. The prevalence of overweight (body mass index ≥85th reference percentiles) among urban 15-39- and 40-69-year-old is estimated at about 22 and 40%, respectively.[3] Some of major causes of obesity include a low resting metabolic rate, environmental factors, family behavior patterns, and poorly developed satiety response;[4] while for obese individuals, successful weight loss and maintenance are often difficult.[5]
Increased daily energy expenditure is composed of three major components: (1) Resting metabolic rate (RMR), (2) the thermic effect of feeding (TEF), and (3) the thermic effect of activity (TEA).[6] RMR constitutes 60-75% of daily energy expenditure and is the energy associated with the maintenance of major body functions.[7,8] In fact the changes in body weight are the function of energy balance; meaning that weight gain will happen if energy expenditure is less than intake, and it will be lost if energy expenditure would be more than intake.[9]
The results of weight loss treatments not only help obese subjects to have fit body, but also they can decrease obesity related disorders, such as type 2 diabetes, hypertension, and cardiovascular disease.[10,11] Dietary interventions, especially low calorie diets, have been considered as the first line treatment for obesity and overweight, which lead to decrease energy metabolism through lowering resting metabolic rate, reduction of thermic effect of food and decreasing the energy cost.[12]
However, there are some important limitations for calorie restriction diets. The important restrictions among them include the modest weight loss (often less than 5-10 kg after 52 weeks), their difficulty for obese patients to follow because of limited food intake.[13,14,15] Researchers at the Pennington Biomedical Research Center in Baton Rouge, LA, have shown that when people significantly reduce their calorie intake, they undergo a metabolic adaptation that results in a slower metabolic rate. The slower metabolic rate results in a behavioral adaptation in which individuals become less physically active.[12] In present study, we want to know how calorie intake in irregular amounts (different phases of high and low calorie intake) can affect the RMR, body weight, and adaptation of subjects compared to constant calorie restriction.
METHODS
Ethics statement
This study was done in accordance to the Declaration of Helsinki, and was approved by the ethics committee of Shahid Beheshty University of Medical Sciences, Tehran, Iran. All participants received required information about study and after signing written consent, were introduced into the study.
Design and participants
The study was conducted on female subjects who were selected from two clinics related to Weight Loss and Weight Gain Unit, Shohaday Tajrish Hospital and Private Clinic in Esfahan between April 2010 and September 2012. One hundred and six female subjects were screened for the study; 32 were excluded at the first step because of being outside of inclusion criteria, 74 patients were randomly allocated to each arm of study using a random numbers table, so that the half of the patients of each clinic was assigned and alternate diet [Figure 1]. Obese and overweight (BMI ≥ 25), nonsmoking adult (age 26-50 years) subjects were entered to the study and required instructions were provided by a registered dietitian. The factors that considered as exclusion criteria were included; pregnancy, lactating or postmenopausal women, diabetes, cardiovascular disease, eating disorders, psychological disorders, substance abuse, or regularly used medications except contraceptives. Subjects who had participated in an exercise class or took weight loss program, lipid or glucose lowering medications for 3 months before study, and whose activity for 3 months prior to the study was more than lightly (i.e., >3 h/week of light intensity exercise at 2.5-4.0 metabolic equivalents were also excluded.
Figure 1.
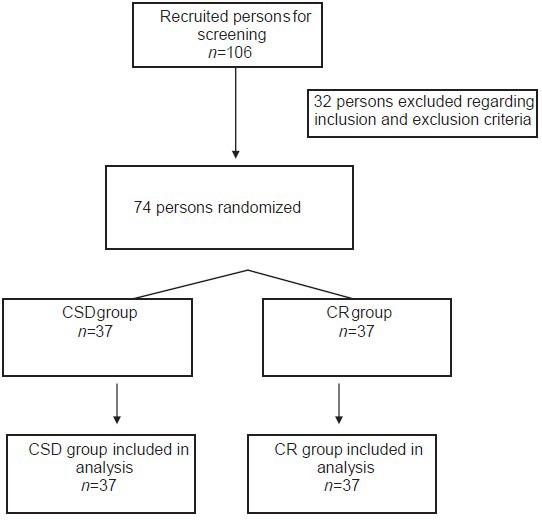
Flow diagram
Interventions
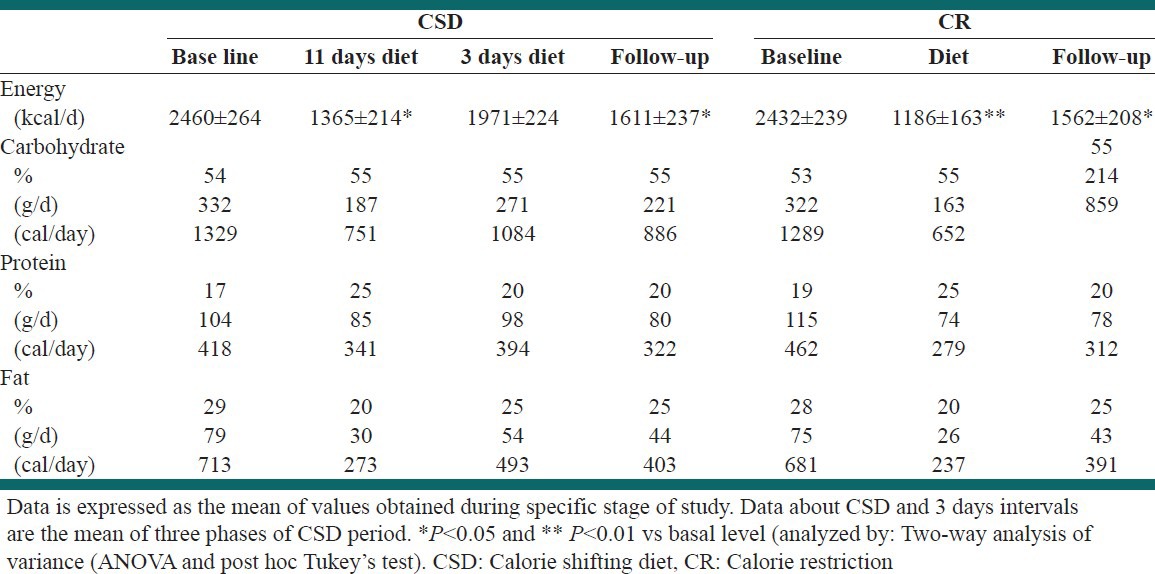
Selected subjects were randomly entered to one of the groups (CR or CSD) and reached determined diet (each group encompassed 37 subjects). Subjects were asked by food frequency questionnaire for 1 month and recall questionnaire for last 5 days to give information about their diet patterns and routine daily calorie intake during last month. The basal calorie intake for every subject was calculated as the mean of calorie intakes per day during last month and used as a start point to calculate their required calorie in accordance to the present study. The required calorie per day was calculated by subtracting 45% of baseline intake for CSD group and 55% of baseline value for CR subjects [Table 1]. In all cases, if the value of calculated calorie was less than 1,100; it rounded as 1,100; then all subjects received at least 1,100 calorie per day during study. All subjects were instructed to consume their meals (containing determined calorie) in accordance to their group of study: CR subjects were trained to review determined amount of calorie per day and determined percent of carbohydrate, protein, or fats. CSD subjects were instructed to eat only at four set of meals per day and avoid any other intake at 4 h intervals between these meals. The time for each of these meals was optional and they let free to consume in any hour, but the time interval between meals should not been less than 4 h (e.g., 8-12-4-8). This diet was ordered for 11 consecutive days after which 3 days of self-selecting calorie and diet was started. The 11-3 days phases were repeated for three times (for 42 days) and finally 1 month follow-up period was started. During follow-up period, subjects received weight maintenance calorie intake in accordance to their required energy intake at the end of CSD or CR regimen.
Table 1.
Composition of CSD and CR diets
Evaluations and tests
Anthropometric assays
Body weight (electronic weighing scale; Mettler Toledo IDL Plus, Eichfahig, Germany), and height (Stadiometer; Holtain Ltd., Crymych, UK) were measured and BMI was calculated as weight (kg)/height (m2).
Body composition
Body composition was measured after 20 min of rest. Bioelectrical impedance analysis (BIA 101, Akern Bioresearch, Florence, Italy) was used to calculate the fat mass and percentage in each subject. A current (800 mA) with 50 kHz frequency was applied through two electrodes which had been placed on the surface of the right hand and right foot. Guidelines of National Institutes of Health,[16] and method of Lukaski used to perform measurements.[17] Fat free mass (FFM), FM, and FM percentage as (FM/body weight) × 100, all were calculated.
RMR
RMR measurements were carried out at baseline and the end of each week during diet or follow-up period in both groups. Indirect calorimetry using a Deltatrac II Metabolic cart (Datex-Ohmeda, Helsinki, Finland) applied to calculate the value of RMR over a 60-min for each subject. After 20 min of resting in quiet conditions, plastic hood was placed over the head of the subject. Constant air flow (40 L/min) generated by the metabolic system was conducted via afferent canola to the plastic hood. O2 and CO2 concentrations were measured at exhalation stream to calculate consumption of O2 and production of CO2 by which the RMR was determined. Subjects were instructed to remain motionless and awake during the test, and RMR was calculated by 30 min of the continuous measurement.
Subjects completed a validated visual analog scale (VAS) at the baseline and at the end of each week through the study. In summary, the VAS consisted of 100 mm lines, and subjects were asked to make a vertical mark across the line corresponding to their feelings from 0 (not at all) to 100 (extremely) for hunger, satisfaction with diet, or fullness.
Blood glucose and lipid profile assay
Blood samples were collected for the measurement of lipids and glucose. Plasma was isolated by centrifugation at 2,000 × g for 10 min at 5°C and frozen at -20°C. Biochemical analysis was performed at the end of the study for all samples. Plasma glucose, total cholesterol, triacylglycerol, and high density lipoprotein ( HDL)-cholesterol concentrations were measured with a Cobas Bio-centrifugal-analyzer (Roche).
Data analysis and statistics
All data were expressed as mean ± standard error of the mean. The main variables tested included body weight, body fat, BMI, RMR, nutrient intake, hunger, satisfaction, and fullness. Two-way analysis of variance (ANOVA) and then post hoc Tukey's test was performed to assess significance. Between groups comparisons were performed by independent sample t-test for each time interval during study. A P ≤ 0.05 was considered significant. For each week of study, the results have compared with baseline value. Analyses were run with Statistical Packages for Social Sciences 14.0 for Windows (SPSS Inc, Chicago, IL).
RESULTS
Seventy-four subjects (BMI ≥ 25; 37) were randomized to 4 weeks control diet, 6 weeks CSD or CR diets, and 4 weeks follow-up period. Subjects who completed the study were middle aged (37.1 ± 5.73 and 35.23 ± 4.84 years, 29-54 years), obese (BMI = 33.53 ± 0.86 and 33.30 ± 0.8 kg/m2, 30 - 39.9 kg/m2) in groups with calorie shifting diet and calorie restricted diet, respectively. All subjects had sedentary life style [Table 2]. Fourteen subjects from CR group and six subjects from CSD.
Table 2.
Physical properties and weight loss during different stages of study at two groups
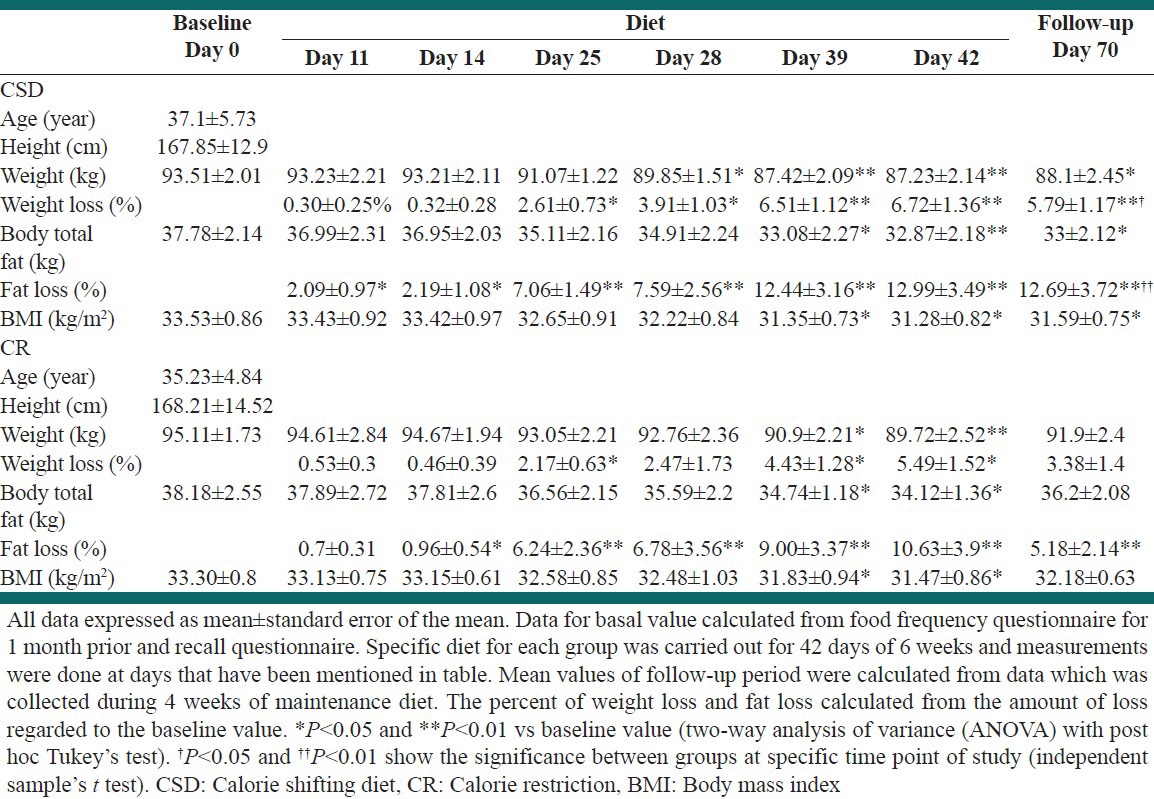
The effects of two different diets on weight, fat mass and BMI
Weight loss
The mean value of basal weight was 93.51 ± 2.01 and 95.11 ± 1.73 kg for CSD and CR groups, respectively. At day 28 total weight loss of 3.66 kg was attained by CSD regimen (−3.91 ± 1.03%; P < 0.05) with reached to 6.28 kg at day 42 (−6.72 ± 1.36%; P < 0.01) and remained significant to the end of follow-up period (−5.41 kg, P < 0.01). CR led to significant weight loss from day 39 (−4.21 kg, 4.43 ± 1.28%; P < 0.05) that reached to −5.39 kg at day 42 (P < 0.01), and −3.21 kg at the end of follow-up period (P = 0.056). There was no significant difference in weight loss percent between groups CSD and CR during regimen days; however, at day 70 in which the study was finished, weight loss percent in group CSD was more than CR (5.79 ± 1.17 and 3.38 ± 1.4%, respectively; P < 0.05).
Body fat
The significant decrease in body FM has been seen after day 39 (−4.7 and −3.44 kg in CSD and CR groups, respectively; P < 0.05) and reached to −4.91 and −4.06 at day 42 (P < 0.05), respectively. At the end of follow-up period reduction in body, FM was significant in CSD group (−4.78, P < 0.05) but not in CR subjects (−1.98, P = 0.08). Percent of fat loss increased significantly from day 11 at both groups (P < 0.05) and remained significant to the end of study (P < 0.01). Between group, comparisons did not show significant difference in fat loss percent at all stages except the follow-up period in which CSD had more potent effect than CR (−17.21 ± 3.72 vs −7.03 ± 2.14, P < 0.01).
BMI
Although BMI decreased in both groups during the study, the significant decrease has been initiated from day 39 study (−2.18 in CSD and −1.48 in CR groups, P < 0.05), which remained significant to the end of study in CSD group and to day 42, but not in follow-up period, in CR subjects [Table 2]. There was no significant difference in BMI of two groups all over the study.
Energy intake
Energy intake and energy restriction at baseline were determined from food record data in accordance to the FFQ, intake patterns of each subjects during the past month before the study, and recalled diet for 5 days before study. There was no difference in baseline energy intakes of CSD and CR subjects (2,460 ± 264 and 2,432 ± 239, respectively) [Table 1]. During study and at follow-up period, energy intake was determined by estimating energy expenditure per day for each subject at sedentary life style and subtracting desired calorie from her intake in accordance to the group. In CSD subjects for 11 days of energy restriction, calorie intake reduced 44% (P < 0.01) and for CR group it was deceased 51% (P < 0.01). The details for components of diet in each stage of study were mentioned in Table 1.
Changes in RMR followed by CSD or CR regimens
Baseline RMR was 1479 ± 21 and 1506 ± 22 kcal/day for CSD and CR groups [Figure 2]. In CSD treated subjects, RMR tended to decrease during each 11 days of energy restriction and then increased by 3 days of self-selecting diet. As shown in Figure 2, although RMR showed different changes in CSD subjects during study; however, the rate of decrease was low and not significant even at weeks 5 and 6 (1,437 ± 23 and 1,442 ± 15), respectively. While in CR group RMR decreased significantly after week 3 (1,459 ± 18, P < 0.05), reached to its lowest levels at week 6 (1,397 ± 16, P < 0.01), and then started to increase in follow-up period, but yet was significantly lower than baseline value to the end of study (P < 0.05 at weeks 8-10). At baseline and in first 5 weeks of study, there was no significant differences in amount of RMR between CR and CSD groups; however, RMR of CSD group remained in significantly higher levels than CR subjects for the rest of study (P < 0.05) except week 8 (P = 0.06) [Figure 2].
Figure 2.
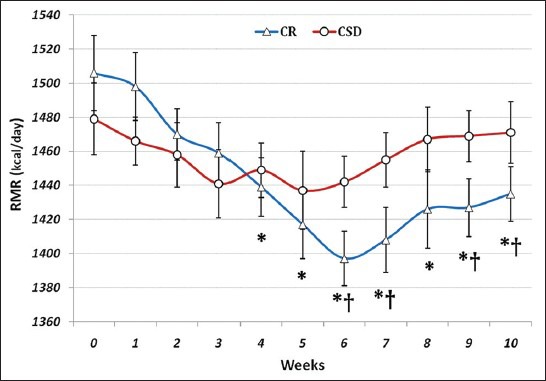
Changes in resting metabolic rate due to calorie shifting diet and calorie restriction regimen. In CR group, RMR decreased significantly after week 3 and it was lower than baseline value to the end of study. RMR of CSD group remained in significantly higher levels than CR subjects in 6, 7, 9, and 10 weeks. *P < 0.05, CR vs baseline and †P < 0.05, CR vs CSD (two-way analysis of variance (ANOVA) with post hoc Tukey's test)
Changes in biochemical factors in response to CSD
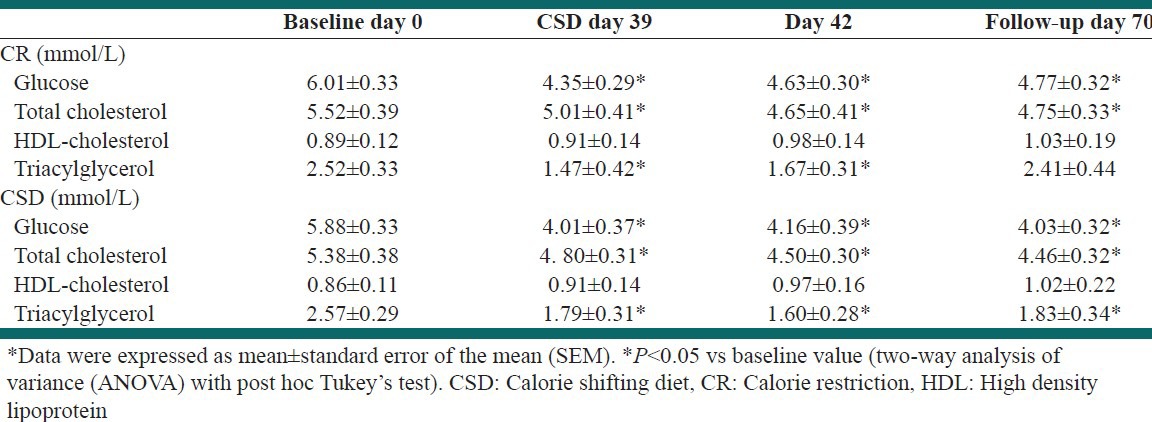
Table 3 summarizes the values for fasting plasma glucose, total-cholesterol, HDL-cholesterol, and triacylglycerol concentrations in CSD and CR groups. These evaluations showed that CSD or CR regimens after 39 days significantly decreased plasma glucose, total-cholesterol, and triacylglycerol levels (P < 0.05 vs baseline values). Similar decrease was seen after 3 days of self-selecting diet at day 42 (P < 0.05). After 4 weeks of maintenance regimen during follow-up period, the levels of plasma glucose and total-cholesterol remained at significantly low levels compared to baseline value (P < 0.05), while triacylglycerol levels returned to levels near the baseline values in CSD and CR groups (P = 0.1), but the difference remains significant in CSD group (P < 0.05 vs baseline values). There was no significant difference in levels of plasma HDL-cholesterol between different stages of study [Table 3].
Table 3.
Biochemical factors before and after treatment in plasma
VAS evaluations of the effects of CSD on subjects hunger, satisfaction, and fullness
The effects of each regimen on subjects feeling of hunger, satisfaction, and fullness were evaluated every day during the diet and at follow-up period. The mean value for each week was calculated and showed in Figures 3-5. The baseline value for each of VAS variables was not significant between groups. There was no significant difference between groups in all VAS variables during study. The mean value of hunger feeling nonsignificantly increased during first 2 weeks at both groups, but it decreased during rest weeks of diet and remained unchanged at follow-up period [Figure 3]. However, in comparison with first 2 weeks of each diet, the feeling of hunger was significantly less at weeks 3 and 4 in both groups (P < 0.05) and weeks 5 and 6 in CSD subjects (P < 0.05). At both groups, subjects’ satisfaction increased during study and reached significant point in week 4 in CSD group and week 5 in CR group which remained significant to the rest of study, except week 5 in CSD subjects [Figure 4]. During study in CSD and CR groups, fullness remained unchanged compared to baseline value [Figure 5].
Figure 3.
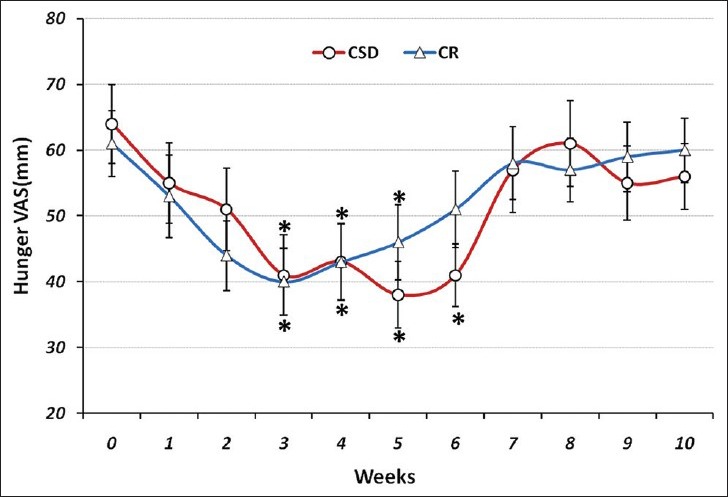
The visual analogue scale (VAS) for hunger during each stage of study at CSD and CR regimen. The graph shows the mean values which was obtained at the end of each week of study. From week 0 to 6 belongs to the CSD and from week 7 to 10 belongs to follow-up periods. *P < 0.05 (two-way ANOVA with post hoc Tukey's test)
Figure 5.
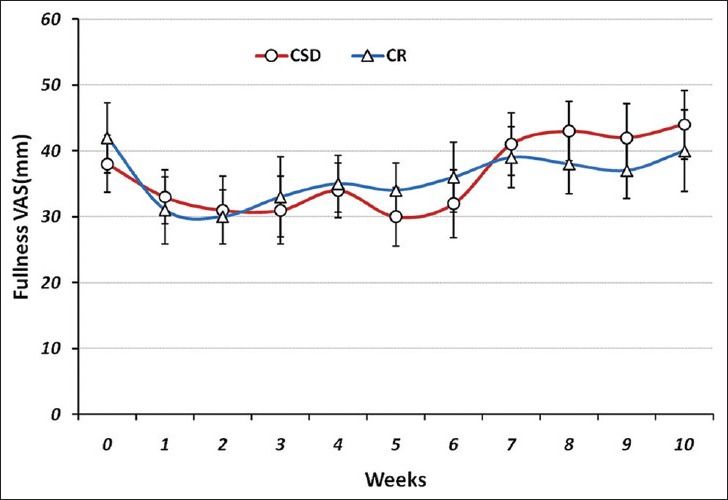
The VAS for fullness during each stage of study at CSD and CR regimen. The graph shows the mean of values which obtained at the end of each week of study. Fullness remained unchanged compared to baseline value (two-way ANOVA with post hoc Tukey's test)
Figure 4.
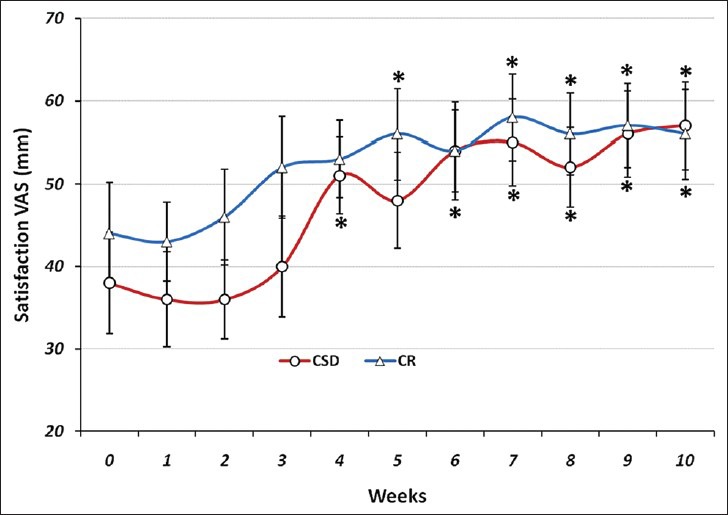
The VAS for satisfaction during each stage of study at CSD and CR regimen. The graph shows the mean values which was obtained at the end of each week of study. *P < 0.05 vs baseline value (two-way ANOVA with post hoc Tukey's test)
DISCUSSION
In the present study, we applied the new method of calorie restriction (CSD) to weight loss and compared its efficacy with routine format of CR. The main theory of CSD is to change intake from high to low calories (e.g., to 11 days) to decrease weight, and then change it from low to high calories (e.g., to 3 consecutive days) to keep the RMR at higher levels. In spite of different shifts in RMR through the study in CSD group, it remained approximately unchanged without significant difference between different time points of study, however in CR group a continuous and significant decrease in RMR was observed. The effect of CSD on RMR was reflected in sustained weight and fat loss and BMI reduction over the follow-up period, something which was not seen in CR treated subjects. Four weeks of CSD caused weight loss in obese subjects by limiting the energy intake to 1,365 calorie per day. CSD helped them approach a significant energy restriction (44.5%) and weight loss (5.4 kg in 6 weeks) with increased satisfaction rate in subjects during study [Figures 2-4].
The routine calorie restriction regimens always induce a quick weight loss at beginning and reach the maximum effect after 6 months, from which moreover weight loss or establishing the current weight is difficult[18,19] and approximately, 30-35% of lost weight is regained during the 1st year after treatment.[20] Calorie restriction diet in present study was successful in weight and fat decrease after 6 weeks of treatment; however, the weight regained after 4 weeks of follow-up period (−2.18 kg compared to week 6 of CR). Weight maintenance after weight loss is always a difficult stage for obese subjects and clinicians to cope with and requires new strategies.
Alternate day modified fasting diet was one of these ways, in which all subjects had to consume 25% of their baseline energy needs on the fast day (24 h), and then they were let to eat freely on the next day.[21] Weight loss (5.6 kg) was resulted from 4 weeks of alternate day modified fasting; and adherence to the alternate day fasting protocol was similar between the controlled food intake phase and the self-selected food intake phase. CSD is similar to the alternate day modified fasting diet in applying the courses of high and low calorie intake, but the advantage of CSD to alternate day modified fasting is that subjects were not required to endure intervals of fasting days.
Calorie restriction diets decreased energy intake (44.5% in CSD subjects and 51.2% in CR group) which tended to decrease RMR at both groups. However, the 3 days interval of higher calorie intake in CSD group reversed the effect of energy restriction on RMR reduction (weeks 4 and 6) [Figure 1]. While the trend of reduction in RMR of CR treated subjects increased to week 6 (P < 0.01). The effect of energy restriction on RMR reduction has been demonstrated in previous studies, which showed that slight or moderate energy restriction for 4 days could decrease basal metabolic rate.[22] From week 6 of study (beginning of follow-up), RMR tended to increase, but the higher RMR of CSD compared to CR group existed through the follow-up period in which there was no significant difference in energy intake of two groups [Table 1 and Figure 2]. Weight regain during 4 weeks of follow-up period for CSD subjects (+0.87 kg) was significantly less than CR group (+2.18 kg), which suggested the key role of RMR in maintenance of weight during follow-up period.
Total cholesterol concentrations decreased by 17.39% after 6 weeks of CSD diet and 16.86% after follow-up period with self-selected diet. Triacylglycerol concentration was also decreased by 32.44% after 42 days of CSD regimen and 20.22% at the end of follow-up period [Table 3]. These modulations in total-cholesterol and triacylglycerol concentrations have been shown previously in a study by Johnson et al., in which they studied the effects of alternate day calorie restriction on clinical findings in overweight adults.[23] Weight loss due to CSD regimen after 6 weeks were correlated to decreased levels of serum cholesterol and triacylglycerol which suggested that the degree of weight loss achieved by this CSD regimen may have contributed to the extent to which these plasma lipids were altered.[24] Although the mean level of HDL-cholesterol concentrations increased after 6 weeks of CSD regimen, however the difference was not significant. This result is in accordance with the findings from the calorie restriction trials which had no effect on HDL cholesterol concentrations after short durations of treatment.[25]
The subjects of two groups showed similar responses to VAS questions by decreased hunger and increased satisfaction during study [Figures 3 and 4]. Although the feeling of hunger increased at first 2 weeks of treatment with CSD regimen like the CR group, but it tended to decrease through the study and showed that subjects could habituate within short time of treatment. Concomitant decrease of hunger and increase of satisfaction with diet within the short period of study (6 weeks) suggested that treatment was well-tolerated and obese subjects could effectively follow such diet for longer periods.[26,27,28]
The percent of subjects who discontinued the study was high in CR group (36.8%) compared to CSD group (15.7%) that confirmed the tolerability of treatment and adherence of subjects to shifting diet. It might be resulted from the slight reduction in calorie intake of CSD subjects (1,365 kcal/day) instead of low calorie intake in CR subjects (1186 kcal/day). However, the results obtained from each of treatments might also be another factor to continue or reject it. The certain results about the adherence of subjects to each treatment may require another study with large number of patients and monitoring for long time period.
CONCLUSIONS
All features of CSD on decreasing weight and FM during treatment were similar to the effects of CR, except RMR which remained unchanged during study in CSD subjects. The effect of CSD on weight loss was more persistent than CR diet, while both group had a 1 month follow-up period with approximately same amounts of calorie intake. Further analysis suggested the involvement of reduced RMR in weight regain of CR subjects during follow-up period, which remained in levels near to the baseline for CSD subjects. Finally, increased satisfaction and low percent of subjects who rejected the study, demonstrated CSD's clinical potentials.
Footnotes
Source of Support: Nil
Conflict of Interest: None declared
REFERENCES
- 1.Martins C, Robertson MD, Morgan LM. Effects of exercise and restrained eating behaviour on appetite control. Proc Nutr Soc. 2008;67:28–41. doi: 10.1017/S0029665108005995. [DOI] [PubMed] [Google Scholar]
- 2.Garaulet M, Pérez de Heredia F. Behavioural therapy in the treatment of obesity (II): Role of the Mediterranean diet. Nutr Hosp. 2010;25:9–17. [PubMed] [Google Scholar]
- 3.Rashidi A, Mohammadpour-Ahranjani B, Vafa MR, Karandish M. Prevalence of obesity in Iran. Obes Rev. 2005;6:191–2. doi: 10.1111/j.1467-789X.2005.00174.x. [DOI] [PubMed] [Google Scholar]
- 4.Willard MD. Obesity: Types and treatments. Am Fam Physician. 1991;43:2099–108. [PubMed] [Google Scholar]
- 5.Varo JJ, Martinez-Gonzalez MA, De Irala-Estevez J, Kearney J, Gibney M, Martinez JA. Distribution and determinants of sedentary lifestyles in the European Union. Int J Epidemiol. 2003;32:138–46. doi: 10.1093/ije/dyg116. [DOI] [PubMed] [Google Scholar]
- 6.Sims EA, Danforth E., Jr Expenditure and storage of energy in man. J Clin Invest. 1987;79:1019–25. doi: 10.1172/JCI112913. [DOI] [PMC free article] [PubMed] [Google Scholar]
- 7.Van Gaal LF, Vansant GA, De Leeuw IH. Factors determining energy expenditure during very-low-calorie diets. Am J Clin Nutr. 1992;56(Suppl 1):224–9S. doi: 10.1093/ajcn/56.1.224S. [DOI] [PubMed] [Google Scholar]
- 8.Ravussin E, Burnand B, Schutz Y, Jéquier E. Twenty-four hour energy expenditure and resting metabolic rate in obese, moderately obese, and control subjects. Am J Clin Nutr. 1982;35:566–73. doi: 10.1093/ajcn/35.3.566. [DOI] [PubMed] [Google Scholar]
- 9.Martin CK, Heilbronn LK, de Jonge L, DeLany JP, Volaufova J, Anton SD, et al. Effect of calorie restriction on resting metabolic rate and spontaneous physical activity. Obesity (Silver Spring) 2007;15:2964–73. doi: 10.1038/oby.2007.354. [DOI] [PubMed] [Google Scholar]
- 10.Lavie CJ, Milani RV, Ventura HO. Obesity and cardiovascular disease: Risk factor, paradox, and impact of weight loss. J Am Coll Cardiol. 2009;53:1925–32. doi: 10.1016/j.jacc.2008.12.068. [DOI] [PubMed] [Google Scholar]
- 11.Drolet B, Simard C, Poirier P. Impact of weight-loss medications on the cardiovascular system: Focus on current and future anti-obesity drugs. Am J Cardiovasc Drugs. 2007;7:273–88. doi: 10.2165/00129784-200707040-00005. [DOI] [PubMed] [Google Scholar]
- 12.Redman LM, Heilbronn LK, Martin CK, de Jonge L, Williamson DA, Delany JP, et al. Pennington CALERIE Team. Metabolic and behavioral compensations in response to caloric restriction: Implications for the maintenance of weight loss. PLoS One. 2009;4:e4377. doi: 10.1371/journal.pone.0004377. [DOI] [PMC free article] [PubMed] [Google Scholar]
- 13.Das SK, Gilhooly CH, Golden JK, Pittas AG, Fuss PJ, Cheatham RA, et al. Long-term effects of 2 energyrestricted diets differing in glycemic load on dietary adherence, body composition, and metabolism in CALERIE: A 1-y randomized controlled trial. Am J Clin Nutr. 2007;85:1023–30. doi: 10.1093/ajcn/85.4.1023. [DOI] [PubMed] [Google Scholar]
- 14.Fardet L, Flahault A, Kettaneh A, Tiev KP, Toledano C, Lebbe C, et al. Systemic corticosteroid therapy: Patients’ adherence to dietary advice and relationship between food intake and corticosteroid-induced lipodystrophy. Rev Med Interne. 2007;28:284–8. doi: 10.1016/j.revmed.2006.12.013. [DOI] [PubMed] [Google Scholar]
- 15.Avenell A, Broom J, Brown TJ, Poobalan A, Aucott L, Stearns SC, et al. Systematic review of the long-term effects and economic consequences of treatments for obesity and implications for health improvement. Health Technol Assess. 2004;8:1–182. doi: 10.3310/hta8210. [DOI] [PubMed] [Google Scholar]
- 16.Bioelectrical impedance analysis in body composition measurement: National Institutes of Health Technology Assessment Conference Statement. Am J Clin Nutr. 1996;64(Suppl 3):524–32S. doi: 10.1093/ajcn/64.3.524S. [DOI] [PubMed] [Google Scholar]
- 17.Lukaski HC, Bolonchuk WW, Hall CB, Siders WA. Validation of tetrapolar bioelectrical impedance method to assess human body composition. J Appl Physiol. 1986;60:1327–32. doi: 10.1152/jappl.1986.60.4.1327. [DOI] [PubMed] [Google Scholar]
- 18.Turk MW, Yang K, Hravnak M, Sereika SM, Ewing LJ, Burke LE. Randomized clinical trials of weight loss maintenance: A review. J Cardiovasc Nurs. 2009;24:58–80. doi: 10.1097/01.JCN.0000317471.58048.32. [DOI] [PMC free article] [PubMed] [Google Scholar]
- 19.Jeffery RW, Drewnowski A, Epstein LH, Stunkard AJ, Wilson GT, Wing RR, et al. Long-term maintenance of weight loss: Current status. Health Psychol. 2000;19(Suppl 1):5–16. doi: 10.1037/0278-6133.19.suppl1.5. [DOI] [PubMed] [Google Scholar]
- 20.Wadden TA, Butryn ML, Byrne KJ. Efficacy of lifestyle modification for long-term weight control. Obes Res. 2004;12(Suppl):151–62S. doi: 10.1038/oby.2004.282. [DOI] [PubMed] [Google Scholar]
- 21.Klempel MC, Bhutani S, Fitzgibbon M, Freels S, Varady KA. Dietary and physical activity adaptations to alternate day modified fasting: Implications for optimal weight loss. Nutr J. 2010;9:35. doi: 10.1186/1475-2891-9-35. [DOI] [PMC free article] [PubMed] [Google Scholar]
- 22.Kouda K, Nakamura H, Kohno H, Okuda T, Higashine Y, Hisamori K, et al. Metabolic response to short-term 4-day energy restriction in a controlled study. Environ Health Prev Med. 2006;11:89–92. doi: 10.1007/BF02898148. [DOI] [PMC free article] [PubMed] [Google Scholar]
- 23.Johnson JB, Summer W, Cutler RG, Martin B, Hyun DH, Dixit VD, et al. Alternate day calorie restriction improves clinical findings and reduces markers of oxidative stress and inflammation in overweight adults with moderate asthma. Free Radic Biol Med. 2007;43:665–74. doi: 10.1016/j.freeradbiomed.2006.12.005. [DOI] [PMC free article] [PubMed] [Google Scholar]
- 24.Dattilo AM, Kris-Etherton PM. Effects of weight reduction on blood lipids and lipoproteins: A meta-analysis. Am J Clin Nutr. 1992;56:320–8. doi: 10.1093/ajcn/56.2.320. [DOI] [PubMed] [Google Scholar]
- 25.Tapsell L, Batterham M, Huang XF, Tan SY, Teuss G, Charlton K, et al. Short term effects of energy restriction and dietary fat sub-type on weight loss and disease risk factors. Nutr Metab Cardiovasc Dis. 2010;20:317–25. doi: 10.1016/j.numecd.2009.04.007. [DOI] [PubMed] [Google Scholar]
- 26.Anton SD, Han H, York E, Martin CK, Ravussin E, Williamson DA. Effect of calorie restriction on subjective ratings of appetite. J Hum Nutr Diet. 2009;22:141–7. doi: 10.1111/j.1365-277X.2008.00943.x. [DOI] [PMC free article] [PubMed] [Google Scholar]
- 27.Drapeau V, King N, Hetherington M, Doucet E, Blundell J, Tremblay A. Appetite sensations and satiety quotient: Predictors of energy intake and weight loss. Appetite. 2007;48:159–66. doi: 10.1016/j.appet.2006.08.002. [DOI] [PubMed] [Google Scholar]
- 28.Drapeau V, Blundell J, Therrien F, Lawton C, Richard D, Tremblay A. Appetite sensations as a marker of overall intake. Br J Nutr. 2005;93:273–80. doi: 10.1079/bjn20041312. [DOI] [PubMed] [Google Scholar]


