

Abstract
In this report, we show that expression of a NUP98-PHF23 (NP23) fusion, associated with acute myeloid leukemia (AML) in humans, leads to myeloid, erythroid, T-cell, and B-cell leukemia in mice. The leukemic and pre-leukemic tissues display a stem cell-like expression signature including Hoxa, Hoxb, and Meis1 genes. The PHF23 PHD domain is known to bind H3K4me3 residues, and chromatin immunoprecipitation experiments demonstrated that the NP23 protein bound chromatin at a specific subset of H3K4me3 sites, including Hoxa, Hoxb, and Meis1. Treatment of NP23 cells with disulfiram, which inhibits the binding of PHD domains to H3K4me3 residues, rapidly and selectively killed NP23 myeloblasts; cell death was preceded by decreased expression of Hoxa, Hoxb, and Meis1. Furthermore, AML driven by a related fusion gene, NUP98-JARID1A (NJL), was also sensitive to disulfiram. Thus, the NP23 mouse provides a platform to evaluate compounds that disrupt binding of oncogenic PHD proteins to H3K4me3.
Keywords: NUP98-PHF23, AML, HOXA9, disulfiram, BAHCC1, NUP98-JARID1A, epigenetic therapy
INTRODUCTION
Nucleoporin 98kDa (NUP98) gene fusions are associated with a wide range of hematologic malignancies including de-novo and therapy-related acute myeloid leukemia (AML), chronic myeloid leukemia in blast crisis (CML-bc), acute lymphoid leukemia (ALL), and myelodysplastic syndrome (MDS); at least 29 different NUP98 partner genes have been identified (1, 2). Although NUP98-fusions were initially considered to be infrequent events, the use of high resolution technologies such as fluorescent in-situ hybridization (FISH), array comparative genomic hybridization (aCGH) and single-nucleotide polymorphism arrays (SNP-A), has led to the detection of cryptic rearrangements of NUP98 with increasing frequency. In fact, a single NUP98 gene fusion (NUP98-NDS1) was recently found in 16.1% of pediatric cytogenetic normal (CN) AML and in 2.3% of adult CN-AML (3).
Many NUP98-fusions have been shown to alter normal hematopoietic stem and precursor cell (HSPC) gene expression programs, characterized by overexpression of Hoxa7, a9 and a10 (1, 4, 5). Overexpression of HOXA genes, particularly HOXA5, A7, A9 and A10, has been identified in a large subset of AML, pre-B ALL, and precursor T-cell lymphoblastic lymphoma/leukemia (pre-T LBL) patients and is associated with a poor prognosis (2, 3, 6-9). Regulation of HOXA gene expression, is achieved in part via activating and silencing epigenetic processes, including histone modifications, at specific developmental stages. Abnormal expression caused by aberrant application (“writing”) or “reading” of histone modifications is associated with malignant transformation in a number of settings (10, 11). Indeed, one of the best-studied examples of this phenomenon are the aberrant histone modification and resultant changes in Hoxa gene expression in leukemias associated with MLL-gene fusions (12, 13).
A recurrent t(11;17)(p15;p13) translocation in AML patients, leads to the production of a NUP98-PHF23 (hereafter NP23) fusion gene, which encodes a chimeric protein that juxtaposes the amino-terminal portion of NUP98 to the carboxy-terminal portion of PHF23 (plant homeodomain (PHD) finger 23) ((14) and Ning unpublished). The PHF23 PHD domain is retained in the fusion and is similar to the JARID1A PHD domain, which is known to bind H3K4me3 (15), identifying the NP23 fusion as a putative aberrant chromatin modifier. In addition, expression of NP23 in wild type mouse bone marrow cells stimulates Hoxa9 expression and myeloid progenitor cell proliferation in vitro (15).
We generated transgenic mice that expressed the NP23 fusion gene in hematopoietic tissues; using Vav1 regulatory elements to direct NP23 expression to all hematopoietic tissues, in order to determine the spectrum of hematopoietic cell types that could be transformed by the NP23 fusion. We performed global gene expression assays and genome-wide chromatin immunoprecipitation followed by next generation sequencing (ChIP-seq) to identify aberrant gene expression signatures and chromatin modifications associated with the NUP98-PHF23 fusion.
RESULTS
In-vivo expression of NP23-PHF23 (NP23) in hematopoietic cells results in decreased survival and leukemic transformation
We generated transgenic mice that expressed NP23 in mouse hematopoietic tissues (Fig. 1 A-C, Fig. S1A), and studied progeny from two NP23 founders (B10 and C10). Complete blood counts (CBCs) were obtained every two months. Offspring of the B10 and C10 founders appeared healthy for the first five months of life, with only modestly altered CBCs. The NP23 mice showed a non-significant trend toward anemia, an increase in mean corpuscular volume (MCV), and no difference in the absolute neutrophil count compared to WT littermates (Fig. S1B). Although no consistent differences were observed in the absolute lymphocyte count between the B10 line and WT mice, mice from the C10 line showed an absolute lymphopenia at 6-12 months of age.
Figure 1. The NUP98-PHF23 (NP23) fusion protein is a multi-lineage oncoprotein.
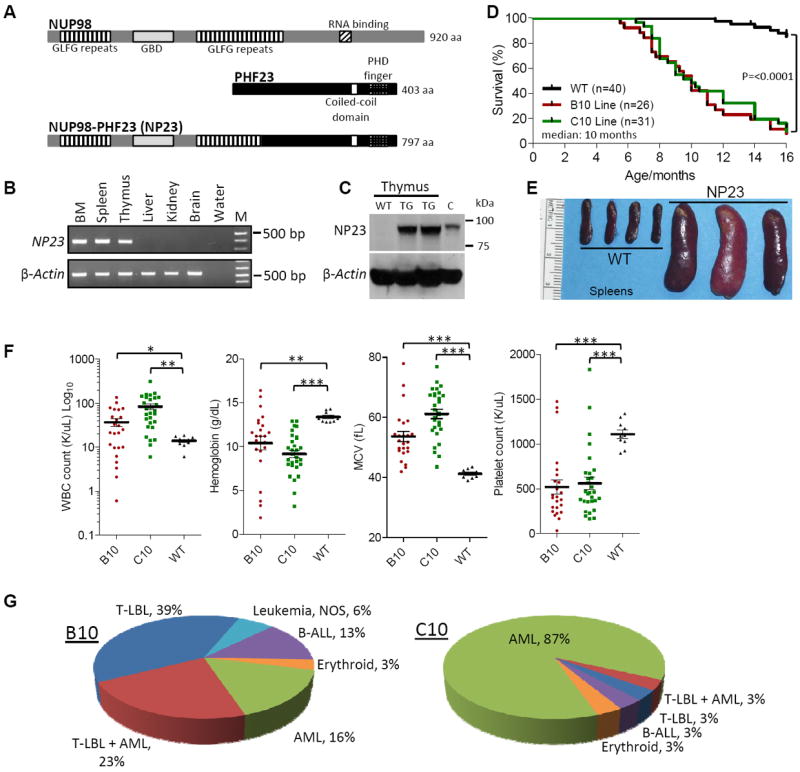
(A) Germline NUP98 (upper) and PHF23 (middle), and the aberrant NUP98-PHF23 fusion protein (lower). (B) Expression of the NP23 transgene in bone marrow (BM), spleen and thymus. (C) Immunoblot of NP23 protein in NP23 transgenic (TG) thymus. WT, wild type. C, positive control. (D) Survival curves of B10, C10 and WT littermate controls. (E) Representative necropsy images of splenomegaly in NP23 leukemia. (F) WBC, hemoglobin, MCV and platelet counts at disease presentation. Note the log10 scale on WBC graph. (G) Frequency of leukemia subtypes by founder line. Some mice found dead with evidence of leukemia could not be further evaluated and are designated “leukemia, not otherwise specified (NOS)”. T-test p values; *<0.05, **<0.01, ***<0.001.
The B10 and C10 transgenic mice showed markedly (p <0.0001) decreased survival compared to that of their WT littermates (Fig. 1D). Median survival of both B10 and C10 progeny was 10 months, and onset of disease was quite variable, ranging from 5-18 months of age. Signs of disease included weight loss, lethargy, kyphosis, dyspnea, visible lymphadenopathy, and abnormal CBCs. Necropsy of sick NP23 mice typically revealed hepatomegaly, splenomegaly (Fig. 1E), and lymphadenopathy; thymoma was present in most cases of pre-T LBL. At disease presentation, CBCs typically revealed elevated WBC counts, macrocytic anemia and thrombocytopenia (Fig. 1F). A wide spectrum of leukemic subtypes was identified, including AML, pre-T LBL, B-lineage ALL, erythroleukemia and bi-clonal leukemia with concurrent pre-T LBL and AML (Fig. 1G, Table S1).
AMLs showed a Mac1+/Gr1+ population that infiltrated the BM, spleen, lymph nodes (not shown), thymus, and liver (Fig. 2A). The Gr1+ staining was relatively dim (Fig. 2Ai), as has previously been noted with immature granulocytes compared to mature granulocytes. A subpopulation of the AML cells were also B220+ (Fig. 2Ai), a phenomenon previously recognized in AMLs that express NUP98-HOXD13 (16) or CALM-AF10 (17, 18) fusions. These cells were negative for CD19 and sIgM (surface IgM, red arrows Fig. 2A), demonstrating that they are not typical B220+/CD19+ B-cells. To further investigate B-lymphoid characteristics, we assayed 26 Mac1+/B220+ AMLs for evidence of clonal Igh gene rearrangements and identified four samples with clonal DJ rearrangements (Fig. S2A); none had evidence of a complete VDJ rearrangement. Histologic analysis showed extensive infiltration of the spleen and thymus, and a characteristic perivascular infiltration of the liver, with MPO+ cells (Fig. 2Aii). Leukemic tissues were negative for T-cell markers CD3, CD4, and CD8 (not shown). We established an immortal, cytokine independent Mac1+/B220+ cell line (designated 961C) from the BM of a mouse with AML; this cell line has now been passaged continuously for greater than 24 months. Most of the cells show a myeloblast morphology, however a minor population of cells shows a lower nuclear:cytoplasmic ratio, and/or formation of ringed nuclei, morphologic findings suggestive of myeloid or monocytic differentiation (Fig. S2B).
Figure 2. NP23 AML.
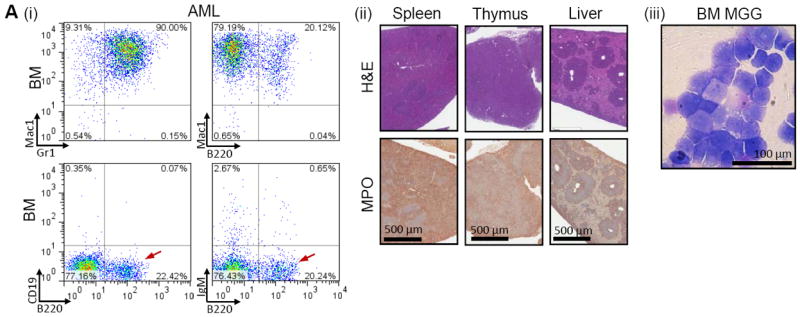
(A) AML from mouse 820; (i) FACS profiles show Mac1+/Gr1+ and Mac1+/B220dim cells in the bone marrow. The B220+ cells are CD19 and sIgM negative (red arrows) and are therefore not typical B-cells. (ii) H&E and MPO IHC of spleen, thymus and liver showing loss of normal organ architecture and infiltration of MPO+ malignant cells. (iii) May-Grunwald Giemsa (MGG) stained BM myeloblasts.
Pre-T LBLs were defined based on the Bethesda proposals for classification of lymphoid neoplasm (19) and were typically CD4+/8+ (Table S1; Fig. S2C), with clonal Tcrb gene rearrangements (Fig. S2D); expression of the NP23 fusion protein was documented by immunoblot (Fig. S2E). The Pre-T-LBLs were invariably positive for cytoplasmic CD3+ (cyCD3) by IHC, but were not consistently surface CD3+ by FACS (Table S1), suggesting that some of the pre-T LBL were at the early cortical stage. Given that NOTCH1 mutations are common in both human and mouse pre-T LBL, we evaluated ten pre-T LBL samples for Notch1 mutation. Seven had acquired spontaneous mutations of the PEST, heterodimerization, or transmembrane domains (Table S2). In addition, three of the seven also had a 5’ deletion of Notch1, which leads to production of a truncated Notch1 protein and ligand-independent activation (20). Hes1, a target of Notch1, was consistently over-expressed in the pre-T LBLs but not in premalignant NP23 thymus (Fig. S2F).
Many leukemias from the B10 line had both T-cell and myeloid features, suggesting that the leukemia was bi-clonal or bi-phenotypic. Varying proportions of discrete Mac1+/Gr1+ and CD4+/CD8+ populations were seen in BM, spleen, lymph node, and thymus (Fig. S3Ai), suggesting that the leukemia was bi-clonal rather than bi-phenotypic. IHC staining of the leukemic BM and liver suggests that the two populations are mutually exclusive, supporting the contention that the leukemia was bi-clonal (Fig. S3Aii).
Five leukemic mice developed clonal CD19+ B-cell malignancies (Fig. S3B and C), and two mice developed erythroleukemia. Mouse 807 had erythroleukemia, and presented with a markedly abnormal CBC (Hgb 1.9 g/dL, MCV 77.9 fL, WBC 0.6 K/μL, platelets 31 K/μL) and a near complete absence of myeloid cells in the BM (Fig. S3D). The spleen showed replacement of B and T cells with immature Ter119dim/CD71+ erythroblasts and a less prevalent population of more mature Ter119+/CD71dim cells, while the lymph node was infiltrated with immature Ter119 and a larger population of more mature nucleated red blood cells (NRBC) (not shown). Histologic sections show an effaced spleen infiltrated with Ter119+ cells (Fig. S3D).
In addition to the B10 and C10 lines, four additional founder mice developed leukemia (founders E6, G8, I2 and J5, Table S1), demonstrating that the leukemias were not caused by a unique integration site effect in the B10 and C10 lines. To investigate why the C10 line primarily developed AML, whereas the B10 mice showed a wider array of leukemic subtypes, we assessed the age at diagnosis of leukemia, as well as the expression level of the transgene in different tissue types. The age of onset for the two major forms of leukemia observed in the NP23 mice (AML and pre-T LBL) was not significantly different (data not shown). RQ-PCR showed NP23 mRNA levels to be modestly higher in the C10 line in both the BM and thymus (Fig. S3E), excluding the hypothesis that higher NP23 expression levels in B10 thymus or in C10 BM might account for the variance in subtype frequency between the two founder lines.
NP23 mice show decreased levels of hematopoietic stem and progenitor cells (HSPC), and impaired differentiation
To determine whether the onset of leukemia was preceded by aberrant hematopoietic development, we compared HSPC from four month old healthy NP23 mice (with no signs of hematologic disease) to those from WT littermate controls. FACS analysis demonstrated that the lineage negative (Linneg) compartment of the NP23 mice contained approximately half the absolute number of cells compared to WT BM (Fig. S4Ai,iii). The Linneg/Sca1+/cKit+ (LSK) compartment, composed of functionally distinct LT-HSC, ST-HSC and multipotent progenitors (MPP), was dramatically reduced in the NP23 mice (Fig. S4Aii,iv), and the absolute number of common myeloid progenitor (CMP), granulocyte-macrophage progenitor (GMP) and megakaryocyte-erythroid progenitors (MEP) were also decreased (Fig. S4Aiv). Despite the marked (>80%) reduction in BM LSK cell numbers and reduced early myeloid progenitors, a functional CFC assay showed no decrease in the re-plating potential of the NP23 BM compared with WT or in the types of progenitor colonies formed (Fig. S4Av, vi). In addition, NP23 BM showed a 2-fold increase in the unusual Mac1+/B220+ population (Fig. S4Avii).
NP23 thymi were smaller and contained 5-fold fewer thymocytes than WT controls (Fig. S4B). Although FACS suggested a relative increase in CD4/CD8 double negative cells (DN) in the NP23 mice (Fig. S4Bii), there was actually an absolute decrease in DN, SP, and most markedly, in the CD4/CD8 double positive (DP) thymocytes (Fig. S4Biv). Further fractionation of the NP23 DN cells revealed a marked increase in the proportion of DN2 cells, reflecting a dramatic accumulation of cells in both the DN2a and DN2b populations, and a significant decrease in the DN3 and DN4 populations (Fig. S4Biii,v). Taken together, these findings reflect a significant defect in normal thymocyte differentiation at the DN2 to DN3 transition, which likely contributes to the reduction of DP and SP thymocytes.
NP23 leukemias overexpress Hoxa and Hoxb genes
Gene expression profiles revealed that Hoxa5/7/9 were among the most highly overexpressed genes in all three leukemic subtypes (Fig. 3A, Tables S3-S4), along with Hoxb2/4/5/6/7/9, Meis1, Gpnmb, Nkx2-3, and Bahcc1 in AMLs; Gm525, Gpnmb and Bahcc1 in pre-T LBL; and Vpreb1, Vpreb3, and Bahcc1 in B-ALL. The gene expression signatures found in the NP23 leukemic cells reflect abnormal regulation caused directly by the NP23 fusion, as well as any dysregulation caused by undefined, collaborative mutations that arise spontaneously as the cell transforms. Therefore, to identify a gene expression signature caused solely by NP23 expression, we compared tissues from clinically healthy NP23 mice, which showed no evidence of malignancy, to those from WT littermates. NP23 BM, thymus and spleen showed fewer differentially expressed genes than did the leukemias (Table S6). Only five loci, Hoxa5/7/9, Meis1 and Bahcc1, were consistently overexpressed, suggesting that these were direct targets of the NP23 fusion protein, irrespective of hematopoietic cell type (Fig. 3B).
Figure 3. NP23 leukemias exhibit Hox/Meis1 stem cell-like gene expression signatures that are enriched in human HSPC and AML genesets.
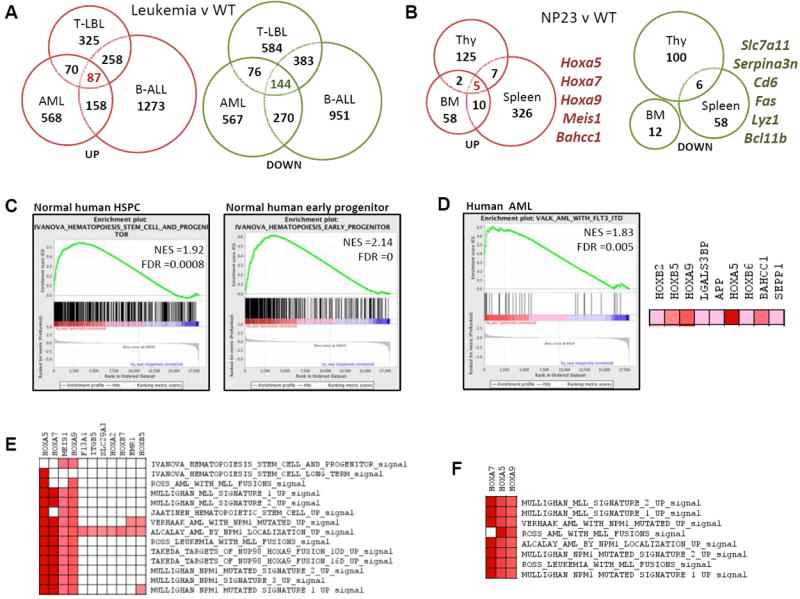
(A) Genes >1.5-fold overexpressed (red) or underexpressed (green) in AML, pre-T LBL and pre-B1 ALL compared to WT BM, thymus or spleen (Table S3). Eighty seven genes were overexpressed and 144 decreased independent of tissue type (Tables S4-S5). (B) Genes >1.5-fold overexpressed (red) or underexpressed (green) in NP23 BM, thymus or spleen compared to WT controls. Note a core set of only five genes are overexpressed irrespective of tissue type (Table S6). (C) Enrichment profiles of NP23 AML overexpressed genes in (A) human HSPC and early progenitor genesets, and (D) human AML with FLT3-ITD. Right, a subset of leading edge genes from the FLT3-ITD geneset. A subset of GSEA leading edge genes overexpressed in (E) NP23 AML and enriched in human HSPC, early progenitor and AML genesets; and (F) NP23 pre-T LBL and enriched in human leukemic genesets.
We validated overexpression of Hoxa5/7/9/10 (hereafter referred to as the “Hoxa cluster”) by RQ-PCR. The more differentiated lineage positive (Linpos) WT BM cells showed a clear decrease of Hoxa cluster expression compared to undifferentiated WT Linneg cells (Fig. S5A). Importantly, this decrease was not seen in the NP23 Linpos cells or AMLs. Overexpression of Nkx2-3, Meis1, Hoxb5 and Mir196b, a microRNA located between Hoxa9 and Hoxa10, was likewise verified (Fig. S5B). We also confirmed overexpression (3 to 76,000-fold) of the Hoxa cluster, Mir196b and Gm525 in the NP23 thymi, and pre-T LBLs (Fig. S5C-D). Also consistent with the array data, Meis1 expression was variable and not consistently overexpressed in the pre-T LBLs (Fig. S5D).
NP23 gene expression signatures resemble human HSPC and AML subtypes
Gene set enrichment analysis (GSEA) showed the NP23 AML expression profile to be enriched in human HSPC (21) and AML (22) genesets (Fig. 3C-D). Leading edge genes included HOXA5/A7/A9, HOXB5/6/7 and MEIS1 (Fig. 3D-E). Additional genesets that overlapped with the NP23 AML expression signatures represented genesets associated with highly proliferative cells such as protein-synthesis, -modification and -metabolism, cell cycle, and DNA synthesis (data not shown). The pre-T LBLs similarly overexpressed Hoxa genes and demonstrated similarity with MLL and NPM1 leukemic signatures (Fig. 3F).
BAHCC1 is upregulated in human acute leukemias associated with HOXA cluster overexpression
BAHCC1 (BAH domain and coiled-coil containing 1), overexpressed in NP23 tissues, was also overexpressed in human AML (Fig. 4A). AML patient clusters 2 and 6 (22) showed markedly increased levels of BAHCC1 compared to both normal BM and CD34 cells, whereas HOXA9 and MEIS1 were increased in both CD34 cells and AML samples, suggesting that BAHCC1, more so than MEIS1 and HOXA9, is a specific marker for AML. Further analysis of BAHCC1 expression in this dataset revealed over-expression in multiple patient clusters; interestingly, BAHCC1 overexpression was mutually exclusive with favorable prognosis AML (t(8;21), t(15;17) and inv(16)) (Fig. 4B). Analysis of an independent dataset demonstrated that BAHCC1 was also over-expressed in pre-B ALL samples with MLL translocations (which also overexpress HOXA cluster genes (GSE33315)) (Fig. 4C) (23). Taken together, these findings suggest that BAHCC1 may be a previously unsuspected marker for AML and pre-B ALL associated with HOXA cluster gene expression.
Figure 4. BAHCC1 expression in human AML and pre-B-ALL genesets.
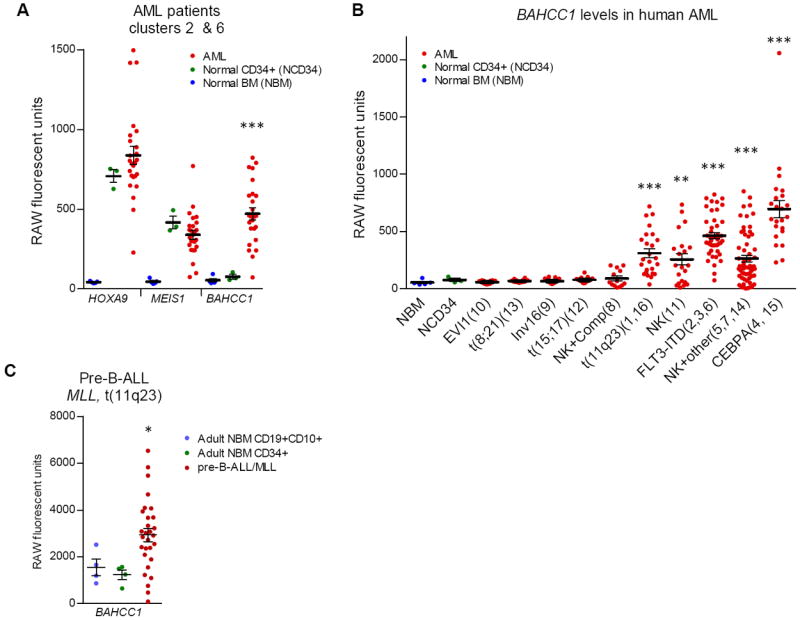
(A) Gene expression levels of HOXA9 (209905_at), MEIS1 (204069_at) and BAHCC1 (219218_at) in human AML, normal CD34+HSCs and normal bone marrow (GSE1159) (22). (B) BAHCC1 (219218_at) expression levels in human AMLs grouped by cytogenetic lesion (patient cluster#) (GSE1159) (22). NK, normal karyotype. Comp, complex karyotype. Other, misc chromosomal aberrations. (C) BAHCC1 expression in human pre-B-ALL with MLL gene rearrangement (GSE33315) (23). T-test p values are relative to normal CD34+ (HSC) samples in (A) and (B), and relative to adult NBM CD19+CD10+ precursor B-cells in (C); *<0.05, **<0.01, ***<0.001.
NP23 directly targets both Hoxa and Hoxb gene clusters
Overexpression of numerous Hox genes in the NP23 transgenic mice and prior evidence of PHD finger binding of H3K4me2/3 active chromatin marks (15), suggest that H3K4me3 may be abnormally abundant at Hox and other genomic loci in the NP23 transgenic mice. We used H3K4me3 ChIP-seq to identify H3K4 methylation specific to NP23 leukemic cells. Comparison of H3K4me3 peaks from two NP23 pre-T LBL cell lines to that of a control non-NP23 pre-T LBL cell line (7298/2) (24), identified 429 H3K4me3 peaks shared by both NP23 pre-T LBL lines, but not the control cell line 7298/2 (Fig. 5A, Table S7). Eighteen of the 429 enriched sites were at gene loci significantly overexpressed in NP23 pre-T LBL, including the highly overexpressed genes Gm525 and Hoxa cluster genes (Fig. 5B, Table S7). The NP23 T-cells demonstrated a striking enrichment of H3K4me3 across the 5’Hoxa locus with a concurrent absence of H3K27me3 marks (Fig. 5C). In contrast, 7298/2 showed an inverse pattern of H3K4me3 and H3K27me3 enrichment.
Figure 5. ChIP-seq identifies NP23-specific H3K4me3 enrichment and direct NP23 targets genome-wide.

(A) H3K4me3 enriched genes in two NP23 pre-T LBL derived cell lines 106A and 748T, compared to H3K4me3 enriched genes in a non-NP23 control pre-T LBL cell line (murine SCL-LMO1, 7298/2). 429 sites were specific to NP23 106A and 748T (Table S7). (B) Overlap of NP23 T-cell H3K4me3 enriched genes and genes overexpressed in pre-T LBL. (C) H3K4me3 and H3K27me3 ChIP-seq at the 5’ Hoxa locus in 106A and 748T, compared to control cell line 7298/2. (D) H3K4me3, H3K27me3 and NP23 ChIP-seq at the 5’ Hoxa locus of NP23 AML-derived myeloblastic cell line 961C. (E) NP23 targets only 160 (1.6%) of the 9863 H3K4me3 enriched sites at annotated genes genome-wide (Table S8). (F) Comparison of genes with dual NP23 and H3K4me3 enrichment, to genes overexpressed in AML and healthy NP23 BM (Table S9). Hoxa7, Hoxa9, Meis1 and Hoxb5 are overexpressed in both healthy NP23 BM and NP23 AML, and are direct targets of NP23. H3K4me3, H3K27me3 and NP23 ChIP-seq at Meis1 (G), the Hoxb locus (H), and at Bahcc1. Note, Bahcc1 is void of NP23.
To determine if these ChIP-Seq results were unique to the T-cells, we performed ChIP-Seq on the 961C myeloblast cell line. Similar H3K4me3 enrichment was identified across the 5’ Hoxa locus in this cell line (Fig. 5D). ChIP-seq using an antibody to the NP23 fusion revealed remarkable co-localization with H3K4me3 marks, as 160 of 181 NP23 enriched loci were concomitantly H3K4me3 enriched (Fig. 5E; Table S8). However, the NP23 protein was highly selective, as only 160 (1.6%) of the 9863 H3K4me3 enriched sites bound NP23 (Fig. 5E; Table S8). Comparison of genes overexpressed in NP23 AML samples with dual NP23+H3K4me3 sites of enrichment showed 18 loci in common (Fig. 5F; Table S9). Four of these 18; Hoxa7, Hoxa9, Meis1 and Hoxb5, were also overexpressed in the healthy NP23 BM, suggesting that these four genes are early, direct targets of NP23, prior to transformation to AML (Fig. 5D, F-H; Table S9). Extensive H3K4me3 enrichment and binding of NP23 at the Hoxb locus, in conjunction with Hoxb4/b5/b6/b7 overexpression in the NP23 BM and/or AMLs, suggests Hoxb gene involvement is almost as extensive as the Hoxa cluster genes in the NP23 AML samples (Fig. 5H).
Of the five genes (Hoxa5, Hoxa7, Hoxa9, Meis1 and Bahcc1) overexpressed independent of lineage prior to transformation, Bahcc1 stands in contrast to the others, as this locus is devoid of NP23 enrichment (Fig. 5I). Combined with the observation that BAHCC1 is overexpressed in a wide array of human AML and pre-B ALL (Fig. 4), it seems reasonable to suggest that BAHCC1 overexpression is associated with Hoxa/b gene expression signatures, but is not a direct target of the NP23 fusion.
A small molecule that inhibits H3K4me3 binding by PHD fingers selectively kills cells that express NUP98-PHD oncoproteins
Given the coordinate upregulation of structurally similar proteins (Hoxa5/7/9/10 and Hoxb4/5/6/7) by NP23, targeting one or two of these proteins may have little effect on the transformed cell. However, inhibiting NP23 binding to H3K4me3 could potentially effect expression of the gene program. We evaluated five compounds (Tegaserod, Amiodarone, Disulfiram, WAG-003 and WAG-004) that have recently been reported to inhibit PHD domain binding to H3K4me3 in vitro (25). All compounds were toxic at 200 μM, the concentration used to demonstrate inhibition of histone reader function in vitro (25), however, only disulfiram was toxic to the NP23 myeloblast and lymphoblast cell lines (961C and 748T, respectively) at the lowest (2 μM) concentration initially tested (Fig. S6A). We focused on the myeloid lineage since NUP98-PHD fusions have been found exclusively in AML patients to date, and next evaluated the ability of lower concentrations of disulfiram to inhibit proliferation of the 961C cell line, treated in parallel with two non-NP23 myeloblast control cell lines, 189E6 and 32D. 961C showed the greatest sensitivity to disulfiram, which selectively killed 961C cells at 2 and 0.66 μM, while controls 189E6 and 32D continued to proliferate (Fig. S6B). As early as 6 hours post-treatment, 961C cells showed apoptotic changes (Fig. 6A), and by 24 hours, 100% of disulfiram treated 961C cells were dead. To extend these observations we evaluated an independent AML cell line (NJLf) driven by the leukemic fusion gene NUP98-JARID1A (NJL), which contains a PHD domain that similarly ‘reads’ H3K4me3 marks. Disulfiram was similarly toxic to NJLf cells (Fig. 6). In contrast, four control myeloid leukemia cell lines (188G3, 189E6, 32D and Ba/F3) showed little or no increase in apoptosis compared to vehicle treated cells (Fig. 6B).
Figure 6. Disulfiram selectively kills leukemic cells driven by H3K4me3 binding NUP98-PHD fusions.
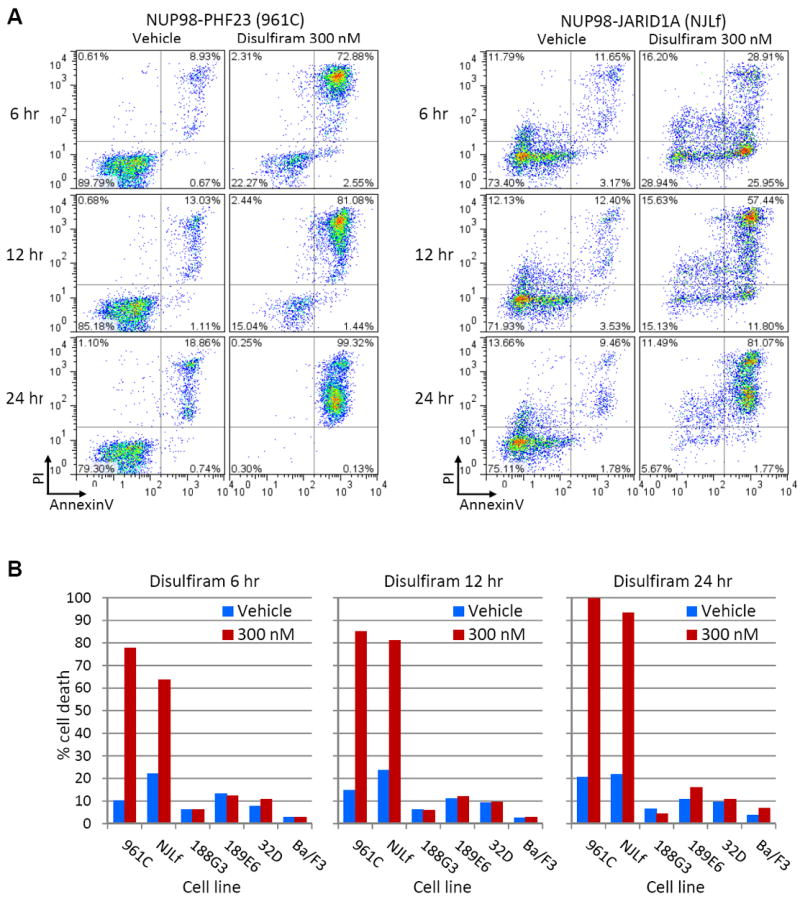
(A) Apoptotic (PI+/AnnexinV+) analysis of NUP98-PHF23 (961C) and NUP98-JARID1A (NJLf) AML cell lines at 6, 12 and 24 hours following treatment with 300 nM disulfiram or vehicle (DMSO). (B) Graphed proportions of apoptotic/dead cells shown in (A). Early apoptotic, late apoptotic and necrotic cell populations are combined to represent “% cell death” in NUP98-PHD cell lines 961C and NJLf, compared to AML control (non-NP23) cell lines 188G3 (NUP98-HOXD13), 189E6 (NUP98-HOXD13), 32D and Ba/F3. Representative of three independent experiments.
We hypothesized that disulfiram would inhibit NP23 binding at critical NP23 target genes (Hoxa cluster, Hoxb cluster, and Meis1), resulting in decreased expression of these genes and subsequent cell death. Following treatment of 961C cells, we observed significant decreases in the binding of NP23 to Hoxa7, Hoxa9, Hoxa10, Meis1, Hoxb5 and Mir196b target genes (Fig. 7A). Gapdh, a non-NP23 target (not bound by NP23 but enriched for H3K4me3) (Table S8), showed little to no enrichment compared to input, as expected. In contrast to decreased NP23 binding, H3K4me3 marks remained stable, as did chromatin bound RNA Polymerase II (Fig.7A), indicating a specific effect of disulfiram on the NP23-chromatin (H3K4me3) interaction. In addition, Hoxa7 mRNA levels decline as early as 3 hours following disulfiram exposure, and by 6 hours post treatment, mRNA levels of all NP23 target genes assayed were decreased (Fig. 7C). Similar reductions in mRNA transcripts were observed in NJLf cells treated with disulfiram (Fig. 7C). We propose that inhibition of NP23 and NJL binding to H3K4me3, via their PHD domains, leads to failure of these NUP98-PHD fusion proteins to ‘read’ and maintain expression of critical target genes, resulting in subsequent silencing of multiple gene targets, and rapid apoptotic cell death.
Figure 7. Disulfiram treatment leads to reduced NP23 chromatin binding and target gene expression.
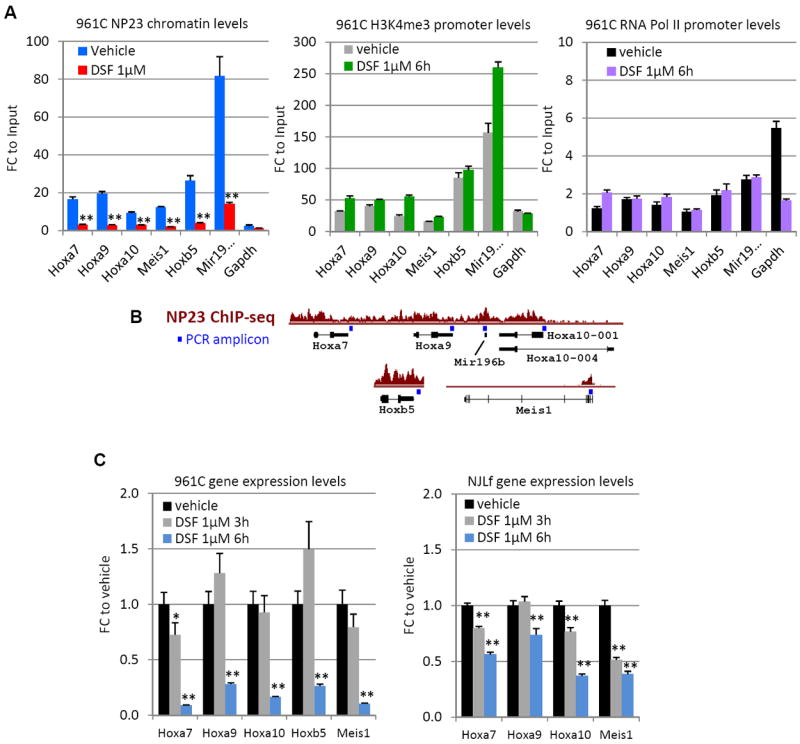
(A) ChIP of promoter-associated NP23 fusion protein at target loci and Gapdh in 961C cells after 6 hours 1μM disulfiram (DSF) treatment. NP23 (left) H3K4me3 (middle) and RNA polymerase II (right) levels. (B) ChIP Q-PCR amplicon locations (blue square) are indicated relative to target gene and NP23 ChIP-seq tracks (as shown in Fig. 5). (C) RQ-PCR quantification of mRNA transcripts of target genes Hoxa7, Hoxa9, Hoxa10, Hoxb5 (not expressed in NJLf) and Meis1, in 961C (left) and NJLf (right) cells treated with disulfiram compared to vehicle (DMSO) treated cells. Ct values were normalized to internal ribosomal controls. P values are relative to vehicle control. Error bars indicate SEM; T-test P values are indicated; p *<0.05, **<0.01.
DISCUSSION
The NUP98-PHF23 fusion is potently oncogenic in-vivo, causing acute leukemias of myeloid, T- and B-lymphocyte, and erythroid origin, with a latency suggesting that collaborative mutations are required for transformation. This range of leukemic subtypes was identified in six founders and their offspring, indicating that the leukemias were not caused by a unique transgene insertion site. The AMLs were typically Mac1+/Gr1+/B220dim, similar to those described for the NUP98-HOXD13 and CALM-AF10 murine models (17, 18, 26). Clonal DJ Igh gene rearrangements were detected in a small proportion (4/26) of the Mac1+/B220+ AMLs, which has also been seen in patients with biphenotypic leukemia (27) and in the CALM-AF10 murine model (18). Pre-T LBLs were typically immature CD4/CD8 DP with clonal Tcrb rearrangements and Notch1 mutations, consistent with previously described murine T-LBL models (28, 29) and human T-ALL (30, 31). Erythroid and B-ALL leukemias were less common and characteristically Ter119+ and CD19+ with clonal Igh rearrangement, respectively.
NP23 mice show evidence of impaired HSPC development and differentiation in multiple hematopoietic lineages prior to the onset of leukemia, consistent with previous studies of NUP98-fusion genes (1). Young, healthy NP23 mice showed dramatic reductions in HSPCs, most notably within the LSK fraction. In addition, there was a clear decrease in thymocyte number in the NP23 mice, at least in part due to a differentiation block at the DN2 stage. However, despite a significant reduction in BM HSPC numbers, there was no decrease in the number of colony forming cells in NP23 BM compared to that of WT BM. Taken together, these observations are consistent with a model in which a sub-population of NP23 hematopoietic cells are endowed with an increased capacity for self-renewal, but are resistant to orderly hematopoietic differentiation.
Impaired differentiation of NP23 hematopoietic cells is consistent with overexpression of the 5’ Hoxa gene cluster (Hoxa5/a7/a9/a10, including Mir196b) and Meis1 in NP23 hematopoietic tissues. Reduction of Hoxa/Meis1 expression is necessary for normal hematopoietic differentiation (32) and persistent expression of these genes maintains a stem cell-like gene expression program that impairs differentiation. Changes in gene expression patterns in hematopoietic tissues from healthy NP23 mice reflect direct effects of the NP23 fusion protein prior to the acquisition of collaborating mutations and malignant transformation. Indeed, we see relatively few alterations in the gene expression signatures of NP23 hematopoietic tissues compared to abnormalities of the NP23 leukemic tissues (Fig. 3A-B), however, the few changes that do occur include marked upregulation of the 5’Hoxa genes, the Hoxa9 co-factor Meis1, and the BAH Domain And Coiled-Coil Containing 1 (Bahcc1) gene. We conclude that an early consequence of the NP23 fusion is the dysregulation of these key genes, and is in keeping with the enhanced self-renewal seen in the NP23 BM despite the reduced progenitor numbers. We propose that the seemingly discordant observations of reduced progenitor numbers and increased self-renewal, could be explained by higher ratios of NP23 progenitors being capable of self-renewal, for more cycles, than the equivalent WT bone marrow progenitors.
The 5’Hoxa stem cell-like gene expression signature and elevated levels of Bahcc1 were maintained in the AML, pre-T LBL and B-ALL malignancies, with additional overexpression of Meis1 and Hoxb genes (b2/b4/b5/b6/b7/b9) in the AML and the B-ALL (Hoxb5/b7/b9). Additional genes overexpressed in the NP23 leukemias, include Stat5a, which is important in HSC self-renewal and differentiation programs and a co-factor of the Hoxa9/Meis1 transcription activation complex (33, 34). Homeobox transcription factors Nkx2-3 and Hhex are significantly elevated, and have been reported to be overexpressed in human AML and pre-T LBL (35, 36). Like the Hox genes, Hhex is normally highly expressed in the HSPC compartment and subsequently downregulated during normal T-cell development (35). Bmi1, which is expressed in normal stem cell gene expression programs and is deregulated in human leukemias (37) was also elevated in the AML, T- and B-cell NP23 leukemias. Tissue specific differences in aberrant gene expression were also detected in leukemic samples from NP23 mice. Notably, Meis1 was markedly increased in the AML samples, but was not elevated in the pre-T LBL samples. Vpreb1 and Vpreb3, which are normally expressed in immature B-cells and human B cell precursor ALL, were increased in the B-ALL samples from the NP23 mice (38).
There were a number of poorly characterized transcripts overexpressed in the NP23 leukemias (1810015a11rik, 2010111i01rik, 4930539e08rik, 4930452B06Rik, 5330431n19rik, Bc003885, Bc025076, E130012a19rik, Eg277333, Gm525, Gm885, Loc65446725), one of which, Gm525, was the single most highly overexpressed gene in the NP23 pre-T LBL. The human homologue, C17orf67, is expressed in normal fetal thymus tissue (GO GDS786), but little more is known about this transcript (39). Additionally a number of gene families were overexpressed in the AML, pre-T LBL and B-ALL. These included Psmb1, Psmb8, Psmb9 (proteosome protein processing), Cenpa, Cenpl, Cenpk, Cenph, Cenpp, Incenp (centromere/kinetochore function), Hist1h2ag, Hist1h2ao, Hist1h2an, Hist2h2ab, Hist2h2ac (replication-dependant histone mRNAs of the H2A histone family) and H2afy (H2A histone family), Kif22, Kif15, Kif18a (Kinesin family proteins - microtubule-associated molecular motors), Chaf1a and Chaf1b (subunits of chromatin assembly factors that assemble histone octamers onto replicating DNA), genes that are typically expressed in rapidly dividing cells.
There were no genes that were consistently downregulated in all three healthy NP23 hematopoietic tissues. Genes downregulated in AML were largely dominated by the loss of transcripts associated with erythropoiesis, reflecting the phenotype of the homogeneous leukemia compared to a mixed population of cells in WT BM. A number of Klf family members were significantly decreased (Klf1, Klf2, Klf4, Klf5, Klf6, Klf7) in the NP23 leukemias. Klf genes encode transcription factors, some of which function in hematopoietic proliferation and differentiation and can act as tumor suppressors (40).
We found NP23 AML expression signatures to be enriched in a number of normal human HSPC and AML gene expression profiles, most notably those with MLL and NPM1 mutations. The pre-T LBL and B-ALL gene profiles were similarly enriched in human HSPC signatures, and showed additional similarity to T-cell, and B-cell signatures, respectively. The unbiased approach taken here to screening gene expression pre- and post-transformation identified Bahcc1 overexpression as an early event, closely associated with aberrant Hoxa gene expression. Of note, this observation was re-capitulated in specific genetically defined subsets of human AML. BAHCC1 was dramatically elevated in a subset of human AML samples, but, in contrast to HOXA9 and MEIS1, was not elevated in immature CD34+ cells, suggesting that BAHCC1 overexpression may be a more specific indicator of leukemic transformation than HOXA9 or MEIS1. Higher levels of BAHCC1 expression were associated with AML that had an MLL rearrangement (t(11q23)), FLT-ITD, CEBPA or normal karyotype; most of these subtypes have previously been associated with HOXA gene overexpression and a poor prognosis. Pre-B ALL with MLL rearrangement similarly showed elevated BAHCC1. Our observations suggest that BAHCC1 overexpression may be a useful early marker for leukemic transformation.
Epigenetic modifications of histones, especially H3K4me3 and H3K27me2/3, are thought to be key regulators of gene expression and have gained increased interest as markers and targets for cancer therapy (11, 41). We identified specific sites of H3K4me3 enrichment in the myeloid and T-cell lines that correlated with the gene expression profiles of the AML and pre-T LBL malignancies. Notably, the Hox loci did not show the ‘bivalent’ pattern described in ES cells (42), thought to facilitate dynamic transcriptional regulation during various stages of development, but showed abundant H3K4me3, not only at promoter regions but also spreading along the length of the gene, and were devoid of H3K27me3, suggesting a more rigid, forced activation of these genes in the NP23 leukemias. Furthermore, we determined genome-wide NP23 binding sites, and discovered NP23 binding to be quite specific, binding only 1.6% of H3K4me3 enriched sites; this specificity suggests the involvement of an unknown co-factor(s) that helps direct NP23 target binding. NP23 was preferentially bound to numerous genes that were over-expressed in the AML samples; these genes included the 5’Hoxa cluster, several Hoxb genes, and Meis1. These observations support the hypothesis that NUP98-PHD fusions impose aberrant chromatin modifications by binding and potentially preserving H3K4me3 marks to maintain and promote active gene transcription. Since the normal targets for PHF23 are currently unknown, it remains unclear whether the NP23 fusion aberrantly activates normal PHF23 targets, or re-targets the PHD domain of PHF23 to an alternate set of target sites. Notably, Bahcc1 was not a direct target of NP23, which is consistent with our observations of elevated BAHCC1 levels in numerous human leukemias, including those without a NUP98-PHF23 fusion. Little is known about BAHCC1, but related bromo adjacent homology (BAH) domain containing proteins have been reported to function in chromatin regulation (protein-protein interactions, histone methyl-lysine binding) (43).
The epigenetic nature of the NP23-imposed stem cell-like gene expression program suggests that direct effects of the fusion protein may be reversible and therefore may represent an attractive target for therapeutic intervention. We evaluated five compounds that have recently been reported to inhibit binding of H3K4me3 PHD domain histone readers. Of these five, disulfiram showed dramatic and selective killing of the NP23 myeloblast cell line, with no evidence of increased cell death in four different control myeloblast cell lines. Disulfiram was originally developed and is FDA-approved for the treatment of alcoholism, However, based on anecdotal reports of anti-tumor activity in cancer patients receiving the drug as treatment for co-existing alcohol addiction, disulfiram is now being investigated as a potential anti-cancer agent (44). Importantly, the concentration used in our studies (300 nM and 1μM) are below clinically achievable peak levels (45).
Disulfiram treatment resulted in a rapid and complete apoptotic death of the NP23 cells, which was preceded by a reduction of NP23 levels at representative target promoters, suggesting disulfiram inhibits NP23 binding of H3K4me3 residues in vivo. Gene expression was decreased as early as 3 hours after treatment, and dramatically reduced by 6 hours post exposure, in both 961C and NJLf cells. We propose that inhibition of NP23 and NJL binding to H3K4me3 via their PHD domains leads to failure of these NUP98-PHD fusions to ‘read’ and maintain expression of their target genes, resulting in rapid downregulation of target genes, and apoptotic cell death. Given that there was no decrease in H3K4me3 and RNA polymerase II levels on target genes after disulfiram treatment, we suggest that the mechanism by which decreased NP23 binding might affect transcription of target genes may be via disruption of transcriptional co-factor recruitment (ie. p300 and CBP) by the NUP98 amino terminus (1, 46). We hypothesize that the rapid and dramatic killing effect is due to the simultaneous downregulation of multiple targets.
We have shown that the NUP98 fusion protein NP23 is oncogenic in multiple cell types, including myeloid, erythroid, T-lymphocyte, and B-lymphocyte. A common theme in all NP23 leukemias was enforced expression of Hoxa cluster genes, and Mir196b, a micro RNA embedded in the Hoxa cluster, suggesting that expression of this gene cluster is a strongly oncogenic, final common pathway in hematopoietic cells, irrespective of specific cell type. Treatment of NP23 cells with a known inhibitor of H3K4me3 PHD domain binding led to reduced chromatin bound NP23 protein, inhibition of Hoxa cluster and Meis1 expression, and rapid apoptosis of NP23 cells. In addition transformed cells containing a related NUP98-PHD fusion (NJL) were likewise selectively killed by disulfiram, and also demonstrated reduction of Hoxa cluster and Meis1 expression. These findings suggest that inhibition of the NP23 PHD domain binding to H3K4me3 may be an effective and specific treatment for NP23 leukemias, and, by extension, other leukemias driven by H3K4me3 “readers”.
EXPERIMENTAL PROCEDURES
Generation of transgenic NUP98-PHF23 (NP23) mice
The NUP98-PHF23 (hereafter NP23) fusion gene has previously been described (14) (Fig. 1A). PCR primers were used to introduce SfiI and NotI restriction sites, as well as a C-terminal V5 epitope tag, into the NP23 transgene construct (Fig. S1A, Table S10). This PCR product was subcloned into the SfiI and NotI sites of the HS21/45-vav vector (47), placing the expression of the fusion gene under the control of hematopoietic specific Vav regulatory elements. Founders were generated by injection of the purified PmeI released fragment from p898/NP23-2 containing Vav1-NP23-V5-vav2, into C57BL/6 zygotes. Positive NP23 founder mice were bred with wild type (WT) C57BL/6, and pups were genotyped for the NP23 transgene by PCR with the forward and reverse primers NUPPHF(C)F and PHF23R1 (Fig. S1A, Table S10). WT controls were age matched littermate controls. Animal studies were approved by the NCI Intramural Animal Care and Use Committee. Evaluation of mouse health is described in supplementary methods.
PCR
PCR was performed using HiFi Taq polymerase mix (Invitrogen) and primers (Invitrogen) as listed in Table S10. Clonal Igh DJ or VDJ segments were identified by PCR (48). Lineage negative cells were purified by negative selection with StemSep Mouse Hematopoietic Progenitor Kit Lineage Positive antibody cocktail (Stem Cell Technologies, Vancouver, Canada) using the manufacturer’s recommended protocol and MACS Separation Columns (Miltenyl Biotec Inc, Auburn, USA). RNA was extracted using Trizol (Invitrogen) or Qiagen RNeasy Kit (Qiagen) using the manufacturer’s recommended protocol. cDNA was generated by RT-PCR using 1μg RNA in 20μl final volume with Superscript III (Invitrogen) and diluted 1:1 with water. Real-time quantitative PCR (RQ-PCR) was performed with Taqman primer-probe sets and ABI Fast Universal PCR Master Mix on an ABI Fast7500 system (Applied Biosystems/Life Technologies). Samples were normalized to endogenous 18S rRNA using TaqMan Ribosomal RNA Control Reagents. The NUP98-PHF23 fusion gene was quantified using ABI Power SYBR Green Master Mix (ABI/Life Technologies) and PHF23 R2 and NUPPHF(C)F primers.
Southern blot analyses of Tcrb and Igh gene rearrangements
High molecular weight genomic DNA for Southern blots was extracted by standard salting out procedures (24) or Qiagen Blood and Tissue DNA extraction kit (Qiagen). Tcrb and Igh Southern hybridization procedures were performed as described previously (17).
Flow cytometry, Immunohistochemistry (IHC) and Immunoblotting
Flow assisted cell sorting (FACS) was performed as described elsewhere (16) with the following conjugated antibodies; Mac1 PE, Gr1 FITC, B220 APC, B220 FITC, CD19 PE, surface IgM PE, CD43 FITC, CD3 PE, CD4 APC, CD8 FITC, CD71 PE, Ter119 FITC, Sca-1 PE, cKit FITC, cKit APC-Cy7, IL7Ra PECy7, CD34 FITC, CD16/32 PE (eBiosciences or BD Biosciences). StemSep Mouse Hematopoietic Progenitor Kit Lineage Positive antibody cocktail (Stem Cell Technologies, Vancouver, Canada) was used to detect lineage positive bone marrow cells, stained as previously described (16). Apoptosis assays were conducted using AnnexinV-FITC Apoptosis Detection Kit I following the manufacturer’s recommended protocol. IHC and immunoblotting were performed as previously described (49). Formalin-fixed paraffin embedded sections were stained with hematoxylin and eosin (H&E), myeloperoxidase (MPO) (A0398, DAKO), CD3 (MCA1477, AbD Serotec), B220 (553086, BD), Ter119 (116201, BioLegend). Stained slides were scanned and imaged as described elsewhere (49). For immunoblots, primary antibodies used were anti-V5 (ab9116, Abcam or R960-25, Life Technologies), and beta-actin (Cell Signaling Technology). Protein was visualized using Pierce ECL Western Blotting Substrate (Thermo Scientific, Illinois, USA) and Amersham Hyperfilm ECL (GE Healthcare Ltd, Buckinghamshire, UK).
Cell culture, cell lines and small molecule PHD inhibitor assays
NP23 cell lines (106A, 748T, 1057d, 961C) were established from single cell suspensions prepared from bone marrow (1×10⁶ cells), and maintained in IMDM supplemented with 20% fetal bovine serum (FBS), 100 mM L-glutamine and 100 μg/mL penicillin/streptomycin (Invitrogen). 7298/2 (24) was maintained in the same media. The myeloid leukemia cell line immortalized by NJL (NJLf) was generated as described previously (15) and maintained as for NP23 lines but with cytokines mSCF (10 ng/mL) and mIL-3 (5 ng/mL). 188G3 and 189E6 myeloblastic cell lines were derived from embryonic stem (ES) cells transformed with the NUP98-HOXD13 fusion gene (50) and maintained as for NP23 cell lines with 10ng/ml murine IL-3 (Peprotech, USA). The Ba/F3 and 32D (clone 3) cell lines were purchased from ATCC (Manassas, USA) and maintained in RPMI supplemented with 15% FBS/100 mM L-glutamine/100 μg/mL penicillin/streptomycin, and 10 and 5 ng/ml murine IL-3, respectively. NP23 BM CFU assays were performed using MethoCult® GF M3434 (StemCell Technologies, www.stemcell.com). Small molecule PHD-domain inhibitors tetraethylthiuram disulfide (disulfiram) (Sigma), amiodarone HCL (Sigma), tegaserod maleate (Sigma) and amiodarone analogs WAG-003 and WAG-004 (25) were solubilized in dimethyl sulfoxide (DMSO) (Sigma). Cells were seeded at 2×10⁵/ml for drug treatment assays.
Gene Expression Profiling
Tissues were analyzed using Illumina MouseRef-8 v2.0 Expression BeadChips (Illumina, San Diego, CA). Details are described in supplementary methods. This gene expression dataset can be accessed at NCBI’s Gene Expression Omnibus (GEO) under accession number GSE54787.
Chromatin immunoprecipitation (ChIP) and ChIP-Seq
ChIP was performed using a ChIP-IT kit from Active Motif (Carlsbad, CA), following the manufacturer’s recommended protocol with minor modifications as described in supplementary methods. Antibodies used were: anti-H3K4me3 (17-614, Millipore), anti-H3K27me3 (07-449, Millipore), anti-V5 (R960-25, Life Technologies), anti-FLAG (M2. Sigma Aldrich) and anti RNA Polymerase II (CTD4H8, Santa Cruz). This ChIP-seq dataset can be accessed under GEO accession number GSE54786.
Supplementary Material
STATEMENT OF SIGNIFICANCE.
NP23 and NJL belong to a subset of chromatin-modifying fusion oncoproteins that cause leukemia characterized by overexpression of Hoxa and Meis1 genes. Inhibition of NP23 binding to H3K4me3 at Hoxa and Meis1 loci by disulfiram, an FDA-approved drug, leads to leukemic cell death, demonstrating the feasibility of targeting this subset of oncoproteins.
Acknowledgments
The authors thank Michael Kuehl, Jay Hess, Sandy Morse, and current and former members of the Aplan lab for insightful discussions. We also thank Maria Jorge for expert assistance with animal care and husbandry, the NCI Transgenic Core facility for the generation of the NUP98-PHF23 (NP23) transgenic mice, and the NCI Sequencing core for Sanger sequencing. This work was supported by the Intramural Research Program of the National Cancer Institute, National Institutes of Health (grant numbers ZIA SC 010378 and BC 010983). J.M.D. is a consultant to Sirtris-GlaxoSmithKline.
ABBREVIATIONS LIST
- NP23
NUP98-PHF23
- NJL
NUP98-JARID1A
- PHD
plant homeodomain
- AML
acute myeloid leukemia
- ALL
acute lymphoid leukemia
- BM
bone marrow
- WT
wild type
- CBC
complete blood count
- DSF
disulfiram
Footnotes
SUPPLEMENTAL INFORMATION
Supplemental Information includes Extended Experimental Procedures, six figures and ten tables.
CONFLICTS OF INTEREST STATEMENT: J.M.D. is a consultant to Sirtris-GlaxoSmithKline.
References
- 1.Gough SM, Slape CI, Aplan PD. NUP98 gene fusions and hematopoietic malignancies: common themes and new biological insights. Blood. 2011;118:6247–57. doi: 10.1182/blood-2011-07-328880. [DOI] [PMC free article] [PubMed] [Google Scholar]
- 2.Lisboa S, Cerveira N, Bizarro S, Correia C, Vieira J, Torres L, et al. POU1F1 is a novel fusion partner of NUP98 in acute myeloid leukemia with t(3;11)(p11;p15) Mol Cancer. 2013;12:5. doi: 10.1186/1476-4598-12-5. [DOI] [PMC free article] [PubMed] [Google Scholar]
- 3.Hollink IH, van den Heuvel-Eibrink MM, Arentsen-Peters ST, Pratcorona M, Abbas S, Kuipers JE, et al. NUP98/NSD1 characterizes a novel poor prognostic group in acute myeloid leukemia with a distinct HOX gene expression pattern. Blood. 2011;118:3645–56. doi: 10.1182/blood-2011-04-346643. [DOI] [PubMed] [Google Scholar]
- 4.Pineault N, Buske C, Feuring-Buske M, Abramovich C, Rosten P, Hogge DE, et al. Induction of acute myeloid leukemia in mice by the human leukemia-specific fusion gene NUP98-HOXD13 in concert with Meis1. Blood. 2003;101:4529–38. doi: 10.1182/blood-2002-08-2484. [DOI] [PubMed] [Google Scholar]
- 5.Wang GG, Cai L, Pasillas MP, Kamps MP. NUP98-NSD1 links H3K36 methylation to Hox-A gene activation and leukaemogenesis. Nat Cell Biol. 2007;9:804–12. doi: 10.1038/ncb1608. [DOI] [PubMed] [Google Scholar]
- 6.Ferrando AA, Armstrong SA, Neuberg DS, Sallan SE, Silverman LB, Korsmeyer SJ, et al. Gene expression signatures in MLL-rearranged T-lineage and B-precursor acute leukemias: dominance of HOX dysregulation. Blood. 2003;102:262–8. doi: 10.1182/blood-2002-10-3221. [DOI] [PubMed] [Google Scholar]
- 7.Golub TR, Slonim DK, Tamayo P, Huard C, Gaasenbeek M, Mesirov JP, et al. Molecular classification of cancer: class discovery and class prediction by gene expression monitoring. Science. 1999;286:531–7. doi: 10.1126/science.286.5439.531. [DOI] [PubMed] [Google Scholar]
- 8.Soulier J, Clappier E, Cayuela JM, Regnault A, Garcia-Peydro M, Dombret H, et al. HOXA genes are included in genetic and biologic networks defining human acute T-cell leukemia (T-ALL) Blood. 2005;106:274–86. doi: 10.1182/blood-2004-10-3900. [DOI] [PubMed] [Google Scholar]
- 9.Armstrong SA, Staunton JE, Silverman LB, Pieters R, den Boer ML, Minden MD, et al. MLL translocations specify a distinct gene expression profile that distinguishes a unique leukemia. Nat Genet. 2002;30:41–7. doi: 10.1038/ng765. [DOI] [PubMed] [Google Scholar]
- 10.Wang GG, Allis CD, Chi P. Chromatin remodeling and cancer, Part I: Covalent histone modifications. Trends Mol Med. 2007;13:363–72. doi: 10.1016/j.molmed.2007.07.003. [DOI] [PubMed] [Google Scholar]
- 11.Chi P, Allis CD, Wang GG. Covalent histone modifications--miswritten, misinterpreted and mis-erased in human cancers. Nat Rev Cancer. 2010;10:457–69. doi: 10.1038/nrc2876. [DOI] [PMC free article] [PubMed] [Google Scholar]
- 12.Ayton PM, Cleary ML. Molecular mechanisms of leukemogenesis mediated by MLL fusion proteins. Oncogene. 2001;20:5695–707. doi: 10.1038/sj.onc.1204639. [DOI] [PubMed] [Google Scholar]
- 13.Krivtsov AV, Armstrong SA. MLL translocations, histone modifications and leukaemia stem-cell development. Nat Rev Cancer. 2007;7:823–33. doi: 10.1038/nrc2253. [DOI] [PubMed] [Google Scholar]
- 14.Reader JC, Meekins JS, Gojo I, Ning Y. A novel NUP98-PHF23 fusion resulting from a cryptic translocation t(11;17)(p15;p13) in acute myeloid leukemia. Leukemia. 2007;21:842–4. doi: 10.1038/sj.leu.2404579. [DOI] [PubMed] [Google Scholar]
- 15.Wang GG, Song J, Wang Z, Dormann HL, Casadio F, Li H, et al. Haematopoietic malignancies caused by dysregulation of a chromatin-binding PHD finger. Nature. 2009;459:847–51. doi: 10.1038/nature08036. [DOI] [PMC free article] [PubMed] [Google Scholar]
- 16.Chung YJ, Choi CW, Slape C, Fry T, Aplan PD. Transplantation of a myelodysplastic syndrome by a long-term repopulating hematopoietic cell. Proc Natl Acad Sci U S A. 2008;105:14088–93. doi: 10.1073/pnas.0804507105. [DOI] [PMC free article] [PubMed] [Google Scholar]
- 17.Caudell D, Zhang Z, Chung YJ, Aplan PD. Expression of a CALM-AF10 fusion gene leads to Hoxa cluster overexpression and acute leukemia in transgenic mice. Cancer Res. 2007;67:8022–31. doi: 10.1158/0008-5472.CAN-06-3749. [DOI] [PMC free article] [PubMed] [Google Scholar]
- 18.Deshpande AJ, Cusan M, Rawat VP, Reuter H, Krause A, Pott C, et al. Acute myeloid leukemia is propagated by a leukemic stem cell with lymphoid characteristics in a mouse model of CALM/AF10-positive leukemia. Cancer Cell. 2006;10:363–74. doi: 10.1016/j.ccr.2006.08.023. [DOI] [PubMed] [Google Scholar]
- 19.Morse HC, 3rd, Anver MR, Fredrickson TN, Haines DC, Harris AW, Harris NL, et al. Bethesda proposals for classification of lymphoid neoplasms in mice. Blood. 2002;100:246–58. doi: 10.1182/blood.v100.1.246. [DOI] [PubMed] [Google Scholar]
- 20.Ashworth TD, Pear WS, Chiang MY, Blacklow SC, Mastio J, Xu L, et al. Deletion-based mechanisms of Notch1 activation in T-ALL: key roles for RAG recombinase and a conserved internal translational start site in Notch1. Blood. 2010;116:5455–64. doi: 10.1182/blood-2010-05-286328. [DOI] [PMC free article] [PubMed] [Google Scholar]
- 21.Ivanova NB, Dimos JT, Schaniel C, Hackney JA, Moore KA, Lemischka IR. A stem cell molecular signature. Science. 2002;298:601–4. doi: 10.1126/science.1073823. [DOI] [PubMed] [Google Scholar]
- 22.Valk PJ, Verhaak RG, Beijen MA, Erpelinck CA, Barjesteh van Waalwijk van Doorn-Khosrovani S, Boer JM, et al. Prognostically useful gene-expression profiles in acute myeloid leukemia. N Engl J Med. 2004;350:1617–28. doi: 10.1056/NEJMoa040465. [DOI] [PubMed] [Google Scholar]
- 23.Zhang J, Ding L, Holmfeldt L, Wu G, Heatley SL, Payne-Turner D, et al. The genetic basis of early T-cell precursor acute lymphoblastic leukaemia. Nature. 2012;481:157–63. doi: 10.1038/nature10725. [DOI] [PMC free article] [PubMed] [Google Scholar]
- 24.Chervinsky DS, Lam DH, Zhao XF, Melman MP, Aplan PD. Development and characterization of T cell leukemia cell lines established from SCL/LMO1 double transgenic mice. Leukemia. 2001;15:141–7. doi: 10.1038/sj.leu.2401997. [DOI] [PubMed] [Google Scholar]
- 25.Wagner EK, Nath N, Flemming R, Feltenberger JB, Denu JM. Identification and characterization of small molecule inhibitors of a plant homeodomain finger. Biochemistry. 2012;51:8293–306. doi: 10.1021/bi3009278. [DOI] [PMC free article] [PubMed] [Google Scholar]
- 26.Gough SM, Chung YJ, Aplan PD. Depletion of Cytotoxic T-Cells Does Not Protect NUP98-HOXD13 Mice from Myelodysplastic Syndrome but Reveals a Modest Tumor Immunosurveillance Effect. PLoS One. 2012;7:e36876. doi: 10.1371/journal.pone.0036876. [DOI] [PMC free article] [PubMed] [Google Scholar]
- 27.Matutes E, Morilla R, Farahat N, Carbonell F, Swansbury J, Dyer M, et al. Definition of acute biphenotypic leukemia. Haematologica. 1997;82:64–6. [PubMed] [Google Scholar]
- 28.Chervinsky DS, Zhao XF, Lam DH, Ellsworth M, Gross KW, Aplan PD. Disordered T-cell development and T-cell malignancies in SCL LMO1 double-transgenic mice: parallels with E2A-deficient mice. Mol Cell Biol. 1999;19:5025–35. doi: 10.1128/mcb.19.7.5025. [DOI] [PMC free article] [PubMed] [Google Scholar]
- 29.Lin YW, Nichols RA, Letterio JJ, Aplan PD. Notch1 mutations are important for leukemic transformation in murine models of precursor-T leukemia/lymphoma. Blood. 2006;107:2540–3. doi: 10.1182/blood-2005-07-3013. [DOI] [PMC free article] [PubMed] [Google Scholar]
- 30.Swerdlow SH, C E, Harris NL, et al., editors. WHO Classification of Tumours of Haematopoietic and Lymphoid Tissues. IARC Press; Lyon, France: 2008. [Google Scholar]
- 31.Weng AP, Ferrando AA, Lee W, Morris JPt, Silverman LB, Sanchez-Irizarry C, et al. Activating mutations of NOTCH1 in human T cell acute lymphoblastic leukemia. Science. 2004;306:269–71. doi: 10.1126/science.1102160. [DOI] [PubMed] [Google Scholar]
- 32.Sauvageau G, Lansdorp PM, Eaves CJ, Hogge DE, Dragowska WH, Reid DS, et al. Differential expression of homeobox genes in functionally distinct CD34+ subpopulations of human bone marrow cells. Proc Natl Acad Sci U S A. 1994;91:12223–7. doi: 10.1073/pnas.91.25.12223. [DOI] [PMC free article] [PubMed] [Google Scholar]
- 33.Huang Y, Sitwala K, Bronstein J, Sanders D, Dandekar M, Collins C, et al. Identification and characterization of Hoxa9 binding sites in hematopoietic cells. Blood. 2012;119:388–98. doi: 10.1182/blood-2011-03-341081. [DOI] [PMC free article] [PubMed] [Google Scholar]
- 34.Schuringa JJ, Chung KY, Morrone G, Moore MA. Constitutive activation of STAT5A promotes human hematopoietic stem cell self-renewal and erythroid differentiation. J Exp Med. 2004;200:623–35. doi: 10.1084/jem.20041024. [DOI] [PMC free article] [PubMed] [Google Scholar]
- 35.Homminga I, Pieters R, Meijerink JP. NKL homeobox genes in leukemia. Leukemia. 2012;26:572–81. doi: 10.1038/leu.2011.330. [DOI] [PubMed] [Google Scholar]
- 36.Pabst O, Zweigerdt R, Arnold HH. Targeted disruption of the homeobox transcription factor Nkx2-3 in mice results in postnatal lethality and abnormal development of small intestine and spleen. Development. 1999;126:2215–25. doi: 10.1242/dev.126.10.2215. [DOI] [PubMed] [Google Scholar]
- 37.Siddique HR, Saleem M. Role of BMI1, a stem cell factor, in cancer recurrence and chemoresistance: preclinical and clinical evidences. Stem Cells. 2012;30:372–8. doi: 10.1002/stem.1035. [DOI] [PubMed] [Google Scholar]
- 38.Buitenkamp TD, Pieters R, Gallimore NE, van der Veer A, Meijerink JP, Beverloo HB, et al. Outcome in children with Down’s syndrome and acute lymphoblastic leukemia: role of IKZF1 deletions and CRLF2 aberrations. Leukemia. 2012;26:2204–11. doi: 10.1038/leu.2012.84. [DOI] [PubMed] [Google Scholar]
- 39.Lee MS, Hanspers K, Barker CS, Korn AP, McCune JM. Gene expression profiles during human CD4+ T cell differentiation. Int Immunol. 2004;16:1109–24. doi: 10.1093/intimm/dxh112. [DOI] [PubMed] [Google Scholar]
- 40.Bureau C, Hanoun N, Torrisani J, Vinel JP, Buscail L, Cordelier P. Expression and Function of Kruppel Like-Factors (KLF) in Carcinogenesis. Curr Genomics. 2009;10:353–60. doi: 10.2174/138920209788921010. [DOI] [PMC free article] [PubMed] [Google Scholar]
- 41.Deshpande AJ, Bradner J, Armstrong SA. Chromatin modifications as therapeutic targets in MLL-rearranged leukemia. Trends Immunol. 2012;33:563–70. doi: 10.1016/j.it.2012.06.002. [DOI] [PMC free article] [PubMed] [Google Scholar]
- 42.Bernstein BE, Mikkelsen TS, Xie X, Kamal M, Huebert DJ, Cuff J, et al. A bivalent chromatin structure marks key developmental genes in embryonic stem cells. Cell. 2006;125:315–26. doi: 10.1016/j.cell.2006.02.041. [DOI] [PubMed] [Google Scholar]
- 43.Yang N, Xu RM. Structure and function of the BAH domain in chromatin biology. Crit Rev Biochem Mol Biol. 2012 doi: 10.3109/10409238.2012.742035. [DOI] [PubMed] [Google Scholar]
- 44.Cvek B. Targeting malignancies with disulfiram (Antabuse): multidrug resistance, angiogenesis, and proteasome. Curr Cancer Drug Targets. 2011;11:332–7. doi: 10.2174/156800911794519806. [DOI] [PubMed] [Google Scholar]
- 45.Malcolm MT. Disulfiram blood levels. Br Med J. 1977;2:457. doi: 10.1136/bmj.2.6084.457-d. [DOI] [PMC free article] [PubMed] [Google Scholar]
- 46.Kasper LH, Brindle PK, Schnabel CA, Pritchard CE, Cleary ML, van Deursen JM. CREB binding protein interacts with nucleoporin-specific FG repeats that activate transcription and mediate NUP98-HOXA9 oncogenicity. Mol Cell Biol. 1999;19:764–76. doi: 10.1128/mcb.19.1.764. [DOI] [PMC free article] [PubMed] [Google Scholar]
- 47.Ogilvy S, Metcalf D, Gibson L, Bath ML, Harris AW, Adams JM. Promoter elements of vav drive transgene expression in vivo throughout the hematopoietic compartment. Blood. 1999;94:1855–63. [PubMed] [Google Scholar]
- 48.Schlissel MS, Corcoran LM, Baltimore D. Virus-transformed pre-B cells show ordered activation but not inactivation of immunoglobulin gene rearrangement and transcription. J Exp Med. 1991;173:711–20. doi: 10.1084/jem.173.3.711. [DOI] [PMC free article] [PubMed] [Google Scholar]
- 49.Beachy SH, Onozawa M, Chung YJ, Slape C, Bilke S, Francis P, et al. Enforced expression of Lin28b leads to impaired T-cell development, release of inflammatory cytokines, and peripheral T-cell lymphoma. Blood. 2012;120:1048–59. doi: 10.1182/blood-2012-01-401760. [DOI] [PMC free article] [PubMed] [Google Scholar]
- 50.Slape C, Chung YJ, Soloway PD, Tessarollo L, Aplan PD. Mouse embryonic stem cells that express a NUP98-HOXD13 fusion protein are impaired in their ability to differentiate and can be complemented by BCR-ABL. Leukemia. 2007;21:1239–48. doi: 10.1038/sj.leu.2404648. [DOI] [PMC free article] [PubMed] [Google Scholar]
Associated Data
This section collects any data citations, data availability statements, or supplementary materials included in this article.