

Abstract
Anaerobic digesters rely on the diversity and distribution of parallel metabolic pathways mediated by complex syntrophic microbial communities to maintain robust and optimal performance. Using mesophilic swine waste digesters, we experimented with increased ammonia loading to induce a shift from aceticlastic methanogenesis to an alternative acetate-consuming pathway of syntrophic acetate oxidation. In comparison with control digesters, we observed shifts in bacterial 16S rRNA gene content and in functional gene repertoires over the course of the digesters' 3-year operating period. During the first year, under identical startup conditions, all bioreactors mirrored each other closely in terms of bacterial phylotype content, phylogenetic structure, and evenness. When we perturbed the digesters by increasing the ammonia concentration or temperature, the distribution of bacterial phylotypes became more uneven, followed by a return to more even communities once syntrophic acetate oxidation had allowed the experimental bioreactors to regain stable operation. The emergence of syntrophic acetate oxidation coincided with a partial shift from aceticlastic to hydrogenotrophic methanogens. Our 16S rRNA gene analysis also revealed that acetate-fed enrichment experiments resulted in communities that did not represent the bioreactor community. Analysis of shotgun sequencing of community DNA suggests that syntrophic acetate oxidation was carried out by a heterogeneous community rather than by a specific keystone population with representatives of enriched cultures with this metabolic capacity.
INTRODUCTION
The robustness of open cultures of microbial consortia (microbiomes) in anaerobic bioreactors relies on access to functional diversity (1, 2) and many parallel metabolic pathways (3). In anaerobic methanogenic systems, much of the carbon flux goes through the intermediate acetate, which is often removed by aceticlastic methanogenesis (direct cleavage of acetate to methane and CO2) (4). Engineers have traditionally considered anaerobic digesters to be unsuitable for waste streams with free ammonia concentrations of >0.08 g N liter−1 (5); at higher concentrations, free ammonia routinely inhibits aceticlastic methanogens. However, the functionally diverse microbial communities of anaerobic digesters have at least one alternative pathway for removal of acetate, which may be essential to the stability of anaerobic digestion: syntrophic acetate oxidation, whereby microbes oxidize acetate to CO2 and H2 and hydrogenotrophic methanogens consume these products to generate methane.
If aceticlastic methanogenesis is inhibited during fermentation of higher-order substrates, the potentially accumulating acetate pool can be removed via the alternative pathway of syntrophic acetate oxidation, thus maintaining the stability of anaerobic bioreactors. Enrichment experiments have revealed a number of defined cultures with the metabolic capacity to oxidize acetate syntrophically under anaerobic conditions. Lee and Zinder (6) first isolated an acetate-oxidizing rod-shaped bacterium (taxonomy unknown) and demonstrated that it participated in this syntrophy in coculture with a hydrogenotrophic Methanobacterium sp. Since then, at least four other syntrophic acetate-oxidizing strains have been enriched and cultured: Clostridium ultunense strain BS (7), Thermacetogenium phaeum strain PB (8), Thermotoga lettingae strain TMO (9), and Syntrophaceticus schinkii strain Sp3 (10). TMO belongs to the phylum Thermotogae, and the other three belong to the class Clostridia, located in the phylum Firmicutes. They oxidize acetate to CO2 and H2 by using the reverse Wood-Ljungdahl pathway, which is also known as the oxidative carbon monoxide dehydrogenase/acetyl coenzyme A (CoA) synthetase pathway (11). The Wood-Ljungdahl pathway is represented in many microbial phylogenetic types (phylotypes), and therefore, genes in this pathway are abundant and are broadly distributed across diverse phylogenetic lineages. Thermodynamic calculations have shown the reversibility of the pathway in microbiomes under low H2 partial pressures with the same energy-coupling sites (12). An example of the diversity of microbes that can perform acetate oxidation is the methanogen Methanosarcina sp. (Archaea), which was shown to convert acetate into CO2 and H2 with a sulfate-reducing bacterium as the syntrophic partner (13). Syntrophic acetate-oxidizing microbes rely on partners such as hydrogenotrophic methanogens to maintain a low H2 partial pressure to keep the anaerobic oxidation of acetate energetically favorable. This has been observed as a dominant pathway in high-ammonia anaerobic bioreactors (14, 15). Stress due to high ammonia concentrations inhibits the aceticlastic methanogenic pathway more so than the hydrogenotrophic methanogenic pathway (16), thereby selecting for syntrophic acetate oxidation as a significant pathway for forming methane from acetate (17). Although this selection has been characterized empirically, and individual syntrophic strains have been enriched, it remains elusive whether or not enriched strains represent keystone populations in reactor microbiomes or if syntrophic acetate oxidation is a function of a heterogeneous and dynamic community.
Here, we characterize the dynamics of microbiomes in four swine waste digesters over a 3-year period: two replicate bioreactors (reactor 3 [R3] and R4) in which we increased the total ammonia concentration (i.e., free ammonia plus ammonium) from 1.2 to 5.2 g N liter−1 and two control bioreactors (R1 and R2) in which the total ammonia concentration remained low (1.2 to 1.8 g N liter−1). We hypothesized that after the introduction of ammonia stress, microbiomes would adapt and converge to a new robust community structure reflecting the digester's performance stability. Microbiome organismal and gene contents were compared at different time points by sequencing of bacterial 16S rRNA genes as well as by shotgun sequencing of total community DNA. We found that bioreactor conditions and performance were not correlated with any individual population but were related to broader structural characteristics, including community evenness, phylogenetic structure, and functional gene content.
MATERIALS AND METHODS
Bioreactor operation and sampling.
To test the effect of high ammonia concentrations on the microbial community structure, activity, and performance of anaerobic digesters, we operated four anaerobic sequencing batch reactors (ASBRs) (5 liters) fed swine waste for a period of 3 years, as described previously (18). The inoculum was crushed granular biomass obtained from an upflow anaerobic digester that was treating brewery wastewater. We fed five different batches of swine waste (0.85 to 1.6 g N liter−1 total ammonia) to two replicate control reactors (R1 and R2) for the entire operating period. The other two reactors were operated as replicate experimental systems (R3 and R4). R3 and R4 received the same swine waste substrate and were conditioned identically to the control reactors for 378 days, after which time we began adding ammonium chloride to the feed of R3 and R4 to achieve concentrations of 4.4 to 5.2 g N liter−1 throughout the rest of the operating period. At around operating day 420 (total ammonia, 4.4 g N liter−1; free ammonia, 0.08 g N liter−1), R3 and R4 showed signs of stress, including elevated volatile fatty acid (VFA) concentrations (n-butyrate, ∼0.1 g/liter) and decreased biogas production rates. After further deterioration of their performance, we performed two steps to regain bioreactor performance (18). First, we reduced the solids loading rate (SLR) from 4.0 to 2.2 g volatile solids (VS) liter−1 day−1 in all four bioreactors on operating day 584. Second, we increased the temperature of all four bioreactors from 25°C to 35°C on operating day 746. Even though this temperature increase elevated the inhibiting free ammonia concentrations in R3 and R4 from 0.08 to ∼0.2 g N liter−1, it resulted in better bioreactor performance due to kinetic advantages for methanogenesis (18). We increased the ammonium chloride addition to R3 and R4 on day 836 to increase the total ammonia concentration in the reactors from ∼4.4 to ∼4.8 g N liter−1 to initiate syntrophic acetate oxidation. We collected sludge samples from each bioreactor periodically throughout the 3-year experiment for comparative metagenomic studies (see Table S1 in the supplemental material).
Serum bottle assays.
To assay acetate enrichment and syntrophic acetate oxidation activity as a fraction of the total biogas production, biomass samples (3 ml) from bioreactors were added into 250-ml serum bottles in duplicate. Serum bottles included (i) 1 ml liter−1 trace element solution (FeCl2·4H2O at 10 g/liter, CoCl2·6H2O at 2 g/liter, EDTA at 1 g/liter, MnCl2·4H2O at 0.5 g liter−1, resazurin at 0.2 g liter−1, NiCl2·6H2O at 0.15 g liter−1, Na2SeO3 at 0.12 g liter−1, AlCl3·H2O at 90 mg liter−1, H3BO3 at 50 mg liter−1, ZnCl2 at 50 mg liter−1, NH4 6Mo7O24·4H2O at 50 mg liter−1, and CuCl2·2H2O at 38 mg liter−1) (19), (ii) HCl (1 ml liter−1 of a 37.7% solution), and (iii) 1 ml liter−1 nutrient stock solution (NaH2PO4·H2O at 7.95 g liter−1, K2HPO4 at 6 g liter−1, NH4Cl at 2.8 g liter−1, MgSO4·7H2O at 1 g liter−1, yeast extract at 1 g liter−1, and CaCl2·2H2O at 0.1 g liter−1) (pH 7.6; temperature [T] = 35°C). Methyl-labeled [13C]acetate and [12C]acetate (13CH312COOH and 12CH312COOH at a ratio of 10:1; total, ∼2 g liter−1) were added to the serum bottles as the sole carbon source, after which a 2-day incubation was performed. For acetate enrichment, samples from R4 were assayed on operating days 563, 626, and 982. For syntrophic acetate oxidation activity, samples from R1 and R3/R4 on days 738, 797, and 911 and from R1 to R4 on days 933, 964, and 982 (Fig. 1) were assayed, after which the biogas formed in the headspace of the serum bottles was collected into 12-ml evacuated tubes. Biogas components of 13CO2 and 12CO2 were quantified by gas chromatography-isotope ratio mass spectrometry (GC-IRMS) (Delta+XL-IRMS; Finnigan, Bremen, Germany). Prior to the 13C-enriched tests, a 100% 12C treatment was performed and measured for 13CO2 background enrichment, which was subtracted from the experimental data. Seven readings for each injection were made via an in-line loop. The resultant ratio of 13CO2 to 12CO2 in sample biogas was used to calculate the acetate oxidation pathway stoichiometrically, as a fraction of total CO2 production. In doing so, the aceticlastic methanogenesis pathway was assumed to produce CO2 only from the carboxyl carbon and methane only from the methyl carbon, while syntrophic acetate oxidation followed by hydrogenotrophic methanogenesis was assumed to produce CO2 and methane equally from both the methyl and carboxyl carbons. 13C biogas data are not available for R4 on days 797 and 911.
FIG 1.
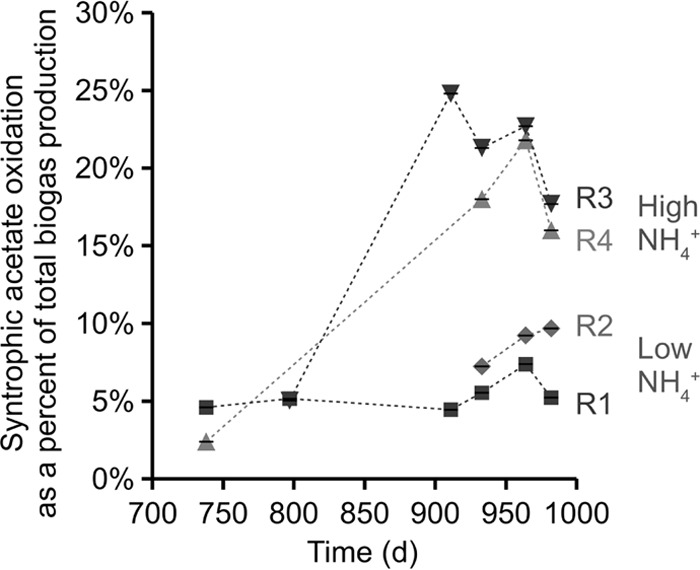
Syntrophic acetate oxidation for operating days 738, 797, 911, 933, 964, and 982. Low-ammonia reactors (R1 and R2) (1.8 g N liter−1 total ammonia) maintained activity at or near the baseline level of 5% syntrophic acetate oxidation (95% acetate cleavage to produce methane and CO2 from acetate), while high-ammonium reactors (R3 and R4) (4.4 to 4.8 g N liter−1 total ammonia) shifted to 20 to 25% syntrophic acetate oxidation (75 to 80% acetate cleavage) between days 809 and 914. Operating conditions within this time period remained constant. Error bars (smaller than the points themselves) represent the ranges from replicate instrument analyses.
DNA-SIP and FISH-NanoSIMS assays.
The R4 sample from operating day 982 in the serum bottle assay was used for DNA-SIP (20–22). With fixed-biomass samples from the same serum bottle, we utilized fluorescence in situ hybridization–nanometer-scale secondary-ion mass spectrometry (FISH-NanoSIMS) (23) to compare the spatial localization of 13C to the spatial localization of a 127I-labeled Pseudomonas species probe, GAM489 (3′-AGC*C*GGTGC*TTATTC*TGTTG-5′ [asterisks indicate cytosines labeled with 127I]) (24). Details on the DNA-SIP and NanoSIMS methods can be found in the supplemental material.
Bacterial 16S rRNA gene survey.
DNA was extracted, as described previously (25), from an anaerobic bioreactor inoculum, from a swine waste substrate (four out of five batches), from reactor microbiomes at various time points, and from the acetate enrichment serum bottles. R1 to R4 were sampled as a function of time, temperature, and shift in biochemical activity, i.e., (i) on day 360, just before the increase in ammonia loading for R3 and R4; (ii) on day 700, ∼11 months after the increase in ammonia loading for R3 and R4; (iii) on day 809, after the increase in temperature from 25°C to 35°C; and (iv) on day 914, after the shift to syntrophic acetate oxidation was observed. R4 was sampled on operating day 982 to perform a comparative analysis with acetate enrichment assays that were performed for that day. In addition, enrichments from serum bottles were utilized for R4 samples that were assayed on operating days 563, 626, and 982. For day 982, we also sequenced the DNA after partitioning 13C (DNA-SIP). Bacterial 16S rRNA genes were amplified by using universal primers 8F (5′-AGAGTTTGATCCTGGCTCAG-3′) and 1391R (5′-GACGGGCGGTGWGTRCA-3′) in a 25-μl PCR mix consisting of 2.5 pmol Promega GoTaq, 10 pmol forward and reverse primers, 0.5 nmol MgCl2, 5 nmol deoxynucleoside triphosphates (dNTPs), 20 μg bovine serum albumin (BSA), 125 μg acetamide, PCR buffer, and 1 μl template. PCR was performed under the following conditions: a 2-min initial denaturation step at 94°C followed by 29 cycles of 94°C (1.5 min), 55°C (55 s), and 72°C (2 min) and then a 15-min incubation at 72°C. PCR amplicons were subsequently gel purified, subcloned, and subjected to Sanger sequencing.
The resulting bacterial 16S rRNA gene sequences were edited and assembled into consensus sequences by using PHRED and PHRAP in XplorSeq (26), after which they were aligned to the Greengenes core (27) by using PyNAST (28). Chimeric sequences were detected and removed by using Bellerophon (29). We obtained 7,382 useful, near-full-length 16S rRNA gene sequences. Operational taxonomic units (OTUs) were clustered at 97% pairwise identity (ID) by using the furthest-neighbor algorithm in mothur 1.17 (30). Taxonomy was assigned to representative OTU sequences by using the naive Bayesian classifier (31) implemented in mothur and a training set built by using the Greengenes database and taxonomy clustered at 97% ID (32). Aligned representative OTU sequences were filtered by using the Greengenes Lane mask (27), and an approximately maximum likelihood phylogenetic tree was constructed by using FastTree (33). Alpha- and beta-diversity calculations, including richness, Chao1, equitability, Faith's phylogenetic diversity (34), weighted and unweighted UniFrac distances (35), and principal-coordinates analysis (PCoA), were produced by using QIIME 1.2.1 (36), using 100 rarefactions of 100 sequences per sample.
Comparative shotgun sequencing assay.
Genomic DNA was extracted for shotgun sequencing as described above. We performed shotgun pyrosequencing (454 FLX chemistry) of community DNA samples from R1 to R4 prepared at time points before (day 809) and after (day 914) the measured increase in syntrophic acetate oxidation. Each sample was allocated to a quarter-plate region using standard four-region gaskets for two 454 pyrosequencing runs (mean number of reads ± standard deviation [SD] of 2.01 × 10⁵ ± 3.2 × 10⁴ per time point; average read length of 350 ± 110 bp). The resulting sequence data were submitted to MG-RAST (37), which was used to identify clusters of orthologous groups (COGs) based on a minimum alignment length threshold of 40 bp and an E value cutoff of 10−5. Pearson distances between samples based on COG relative abundance data, and corresponding jackknifed unweighted-pair group method using average linkages (UPGMA) cladograms, were calculated by using 100 rarefactions of 8,000 sequences per sample in QIIME 1.2.1. For consensus taxonomy data, shotgun sequences were searched against the NCBI-nr database by using BLASTX, and the BLAST hits (top 100 hits) and corresponding bit scores were processed by using MEGAN 3 (38). Reads were assigned to genes with assigned enzyme classifications (ECs) in KEGG (version 58.0), using a BLASTX search against the KEGG reference sequence set. KEGG enzyme-specific taxonomic distributions were determined by parsing the BLASTX/NCBI-nr hit results for MEGAN using the read IDs of subsets of KEGG EC hits; we recomputed consensus taxonomies in MEGAN for each KEGG EC, with the modified parameter that only one confirmation hit was required per taxonomic bin (due to the high taxonomic diversity and low total read count for each EC).
Accession numbers.
Sanger 16S rRNA gene sequence data sets and shotgun community pyrosequencing reads have been deposited in GenBank under accession numbers GQ132191 to GQ135376, GQ135510 to GQ139199, and EF515481 to EF515734 and in MG-RAST under accession numbers 4444124, 4444183, 4444185 to 4444188, 4444190, and 4444194, respectively (see Table S1 in the supplemental material).
RESULTS
Bioreactors with high ammonia concentrations shifted to syntrophic acetate oxidation.
Our overall goal was to test the dynamics of the microbial community during a shift from aceticlastic methanogenesis to the alternative pathway of syntrophic acetate oxidation. We induced this functional shift using an NH4Cl-amended substrate in replicate experimental reactors (R3 and R4) with total and free ammonia concentrations of 4.8 and 0.2 g N liter−1, respectively (compared to the unamended R1 and R2) (see Table S1 in the supplemental material). We verified the relative acetate degradation pathways via [13C]acetate serum bottle assays and gas chromatography-mass spectrometry (GC-MS) quantification of 13C/12C isotope ratios in the produced biogas (Fig. 1). The results of these assays indicated that the level of syntrophic acetate oxidation increased significantly in R3 (high ammonia concentrations) between operating days 797 and 911, from 5% to 25%. Throughout the remainder of the operating period, R3 and R4 achieved 16 to 23% syntrophic acetate oxidation, compared to 5 to 10% in the controls (Fig. 1). This isotope-labeled activity test typically includes a baseline measurement of ∼5% acetate oxidation during exclusively aceticlastic methanogenesis due to basal levels of acetate oxidation by Methanosarcina spp. (39) and Methanosaeta spp. (19). Therefore, we interpret the data in Fig. 1 to indicate that control R1 and R2 effectively operated at nearly 100% aceticlastic methanogenesis as the pathway for acetate conversion to methane and CO2.
Bacterial community evenness decreases following disturbances.
To observe shifts in community structure throughout the 3-year operating period, we sequenced full-length bacterial 16S rRNA gene amplicons from each of the four bioreactors. Although Chao1 and Faith's phylogenetic diversity indices showed no significant patterns (see Fig. S1a and S1b in the supplemental material), community evenness, measured via the Gini coefficient, shifted concurrently with the perturbations in operating conditions (Fig. 2; see also Fig. S1c in the supplemental material). The Gini coefficient is calculated on a normalized scale from 0 (perfectly even) to 1 (one dominant OTU and many singlets); a robust community will lie somewhere in between. Figure 2 illustrates the dramatic decrease in evenness (increase in Gini coefficient) following the introduction of ammonia stress (R3 and R4 at day 700) as well as following an increase in temperature (R1 to R4 at day 809). Bacterial community evenness increased significantly in R2, R3, and R4 during the final acclimation period between days 809 and 914 (Fig. 2). Notably, R4 returned to a Gini coefficient of 0.15 after the initiation of syntrophic acetation during this period, which is similar to the samples at day 360 (Fig. 2). The greater evenness of the more functionally stable microbial communities agrees with previously reported examples of denitrifying bioreactors (1) and anaerobic digesters (2).
FIG 2.
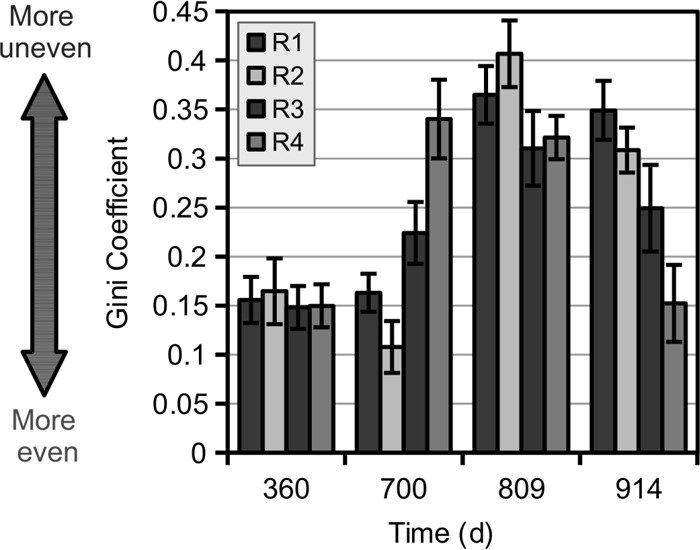
Evenness (measured as the Gini coefficient) of 97% ID (species-level) bacterial OTU profiles, determined based on near-full-length 16S rRNA gene sequencing characterizations of bioreactor samples. Microbiomes became more uneven following high-ammonia stress (R3 and R4) (day 700) and increased temperature (all bioreactors increased from 25°C to 35°C prior to day 809). As the bioreactor performance of R3 and R4 recovered by day 914, bioreactors returned to a more even community composition. As noted on the y axis, greater evenness is signified by a lower Gini coefficient. Error bars represent the SD of 100 rarefactions of 100 sequences each.
Bacterial phylotypes are dynamic but consistent among replicate bioreactors.
The overall bacterial community structure changed continuously throughout the time series, but the replicate bioreactors remained similar to each other compared to the changes over the operating period. This pattern was evident in phylogenetic structure differences between samples (unweighted UniFrac distance) (see Fig. S2 in the supplemental material) and in terms of OTU content (Fig. 3). The bipartite network in Fig. 3 shows samples and OTUs as nodes in a network, where any given OTU was found in each sample with which it shares an edge (connecting line; note that the placement of nodes and edges in the graph was calculated by using a spring-embedded algorithm as reported previously [40]). The visualization of the network resulted in samples with similar OTU contents being placed close to each other. The tight upper left cluster of bioreactor samples from day 360 shows that after nearly a year of operating under the same conditions, all four bioreactors had similar OTU contents (Fig. 3). The bipartite network also shows little similarity of bioreactor samples to the inoculum or to the swine waste feed (see taxonomy of in-common OTUs in Fig. S3 in the supplemental material). Experimental reactors (R3 and R4) became unstable (e.g., n-butyrate concentrations of >0.1 g liter−1 [18]) after the total ammonia concentration was increased from 1.2 to 4.4 g N liter−1. Microbiomes in the control and experimental reactors diverged in terms of OTU content (high-ammonia conditions are highlighted in Fig. 3c), followed by an eventual reconvergence of microbiomes after the temperature was increased from 25°C to 35°C (high-temperature conditions are highlighted in Fig. 3b) and the initiation of syntrophic acetate oxidation. This resulted in stable conditions for R3 and R4, with n-butyrate concentrations returning to <0.01 g liter−1 on day 908 (18). The R3 and R4 samples with elevated acetate oxidation levels shared very few (eight) OTUs that were not detected in control R1 or R2 (highlighted OTUs in Fig. 3a; taxonomic data are summarized in Fig. S4 in the supplemental material). However, these OTUs had very low abundance and no systematic correlation with the shift in function.
FIG 3.

Bipartite network of samples and OTUs clustered from bacterial 16S rRNA gene sequencing characterizations of bioreactor samples for days 360, 700, 809, and 914 and for bioreactor inoculum and four swine waste feed batches. Edges are colored by increased acetate oxidation (a), increased temperature (from 25°C to 35°C) (b), and high ammonia concentrations (R3 and R4 on days 700, 809, and 914) (c). Squares represent OTUs, circles represent samples of bioreactor inputs (granular inoculum from upflow digesters treating brewery wastewater and swine waste feed), and triangles represent bioreactor samples. Edges were drawn between each OTU and the samples in which it was detected; only OTUs appearing in more than one sample are shown. Blue and green arrows in panel a indicate the time series sequence for each bioreactor, beginning with day 360 in the top left bioreactor sample cluster.
Similar results were found in a phylogenetic analysis of community dynamics. OTU shifts were heterogeneously distributed throughout the phylogenetic tree, and there were no OTUs whose abundance corresponded reproducibly with environmental or operating changes (Fig. 4). Bacteroidetes and Firmicutes were the most diverse phyla in all the bioreactors and were also the most abundant (see Fig. S5a in the supplemental material). Bacteroidetes OTUs consistently had high-level variation in relative abundance, with concurrent increases and decreases throughout the time series (Fig. 4). Much of the variability in Firmicutes, however, was seen as losses in OTUs between days 360 and 700 for all bioreactors (Fig. 4b), and there were no consistent large increases in abundances of OTUs within Clostridia (class) between days 809 and 914 in R3 and R4, concurrent with the increase in the level of acetate oxidation (Fig. 4d). In other words, we did not detect a single OTU (or a distinct set of closely related OTUs) that we might hypothesize was correlated with, and responsible for, syntrophic acetate oxidation. We found no OTUs in this study with >94% identity to the four characterized bacterial strains known to oxidize acetate in syntrophy with hydrogenotrophic methanogens. In addition, there was no OTU or set of OTUs that had a large increase in abundance (>4%) consistently in both R3 and R4 along with the increase in the level of acetate oxidation (i.e., there is no bright green line spanning R3 and R4 in Fig. 4d).
FIG 4.

Phylogenetic tree of OTUs that appear in more than one sample from bacterial 16S rRNA gene sequencing characterizations for bioreactor days 360, 700, 809, and 914 (a), along with heat maps indicating the extent to which the relative abundance of each OTU changed concurrently with a change under conditions of an increase in ammonia concentrations in R3 and R4 between days 360 and 700 (b), an increase in temperature between days 700 and 809 (c), and an increase in syntrophic acetate oxidation (AcOx) in R3 and R4 between days 809 and 914 (d). The scale on the color key is relative to the total community (e.g., an OTU that increased in relative abundance from 3% to 7% would be displayed here as +4%). OTUs that appeared in more than one sample included all OTUs with >2% relative abundance in any bioreactor sample. n/a, not applicable.
Enrichment cultures fail to reproduce bioreactor communities.
We performed acetate enrichment experiments and utilized DNA-SIP to probe microbes that incorporated 13C (labeled on the methyl carbon) by bacterial 16S rRNA gene sequencing of heavy DNA from [13C]acetate. DNA-SIP for R4 samples from day 982 did not reveal a specific OTU that was enriched with acetate. Rather, we enriched several groups of microbes across the phylum Proteobacteria, including an increase in the abundance of Gammaproteobacteria of the genus Pseudomonas (see Fig. S6 in the supplemental material). It is noteworthy that sequences within this genus clustered closely with those reported previously by Li et al. (24), who also fed [13C]acetate to anaerobic culture bottles to study syntrophic acetate oxidation. However, individual cells of Pseudomonas spp. were not abundant in our 13C-enriched sample because we could not detect them by FISH-NanoSIMS with a 127I-labeled GAM489 probe (see Fig. S6 in the supplemental material) after studying many fields (an example image is shown in Fig. S7 in the supplemental material).
We also sequenced bacterial 16S rRNA gene amplicons from the acetate-enriched cultures for several operating days (without DNA-SIP) and observed that they had significantly diverged from the bioreactor community (see Fig. S8 in the supplemental material). The latter result indicates that the physiological status of the microbiomes from acetate-fed bottle enrichment assays was not representative of bioreactor samples. Because of this bias, we performed shotgun sequencing of total community DNA in bioreactor samples to identify potentially active syntrophic acetate oxidizers as well as elucidate changes in genomic functional capabilities coinciding with the shift to syntrophic acetate oxidation.
Methanogen shifts in shotgun metagenomic data.
The pattern in the consensus taxonomic distribution in shotgun reads differed from the 16S rRNA gene characterization (see Fig. S5 in the supplemental material). Because the characterization was performed as a random subsampling of fragmented genomic DNA, we anticipate that most of the possible sources of bias in relative abundances originate from the 16S rRNA gene characterization, including primer mismatch, PCR bias, and bias introduced from picking colonies containing subcloned amplicons. The relatively high abundances of members of the phyla Bacteroidetes and Firmicutes compared to other low-abundance phyla were consistent between the whole-community and 16S rRNA gene characterizations, but the within-taxa patterns of variation among samples were not well correlated (see Fig. S5c in the supplemental material). We therefore expected the relative abundance data from the consensus taxonomies to offer additional information that was obscured by the biases in 16S rRNA gene data. The shotgun sequencing data set also had the advantage of deeper sequencing and capturing lineages not targeted by the bacterial 16S rRNA gene primers, including those within the domain Archaea.
Two significant taxonomic relative-abundance shifts were apparent in the shotgun reads (Fig. 5). First, the abundance of reads assigned to methanogenic Archaea shifted significantly from operating days 809 to 914: in R3 and R4, the abundance of reads assigned to hydrogenotrophic methanogens of the order Methanomicrobiales increased, while the abundance of reads assigned to aceticlastic methanogens of the order Methanosarcinales decreased (Fig. 5a). In contrast, the relative abundance of reads in control R1 and R2 assigned to the Methanosarcinales increased. This correlates with the concurrent increase in bacterial syntrophic acetate oxidation levels in R3 and R4 (Fig. 1), a pathway that requires the participation of hydrogenotrophic methanogens to convert H2 and CO2 to methane. Second, the number of reads within the bacterial family Clostridiaceae also increased in R3 and R4 (Fig. 5b). However, caution should be used when analyzing taxonomy results from shotgun sequencing, due to the database bias of limited sequenced genomes.
FIG 5.
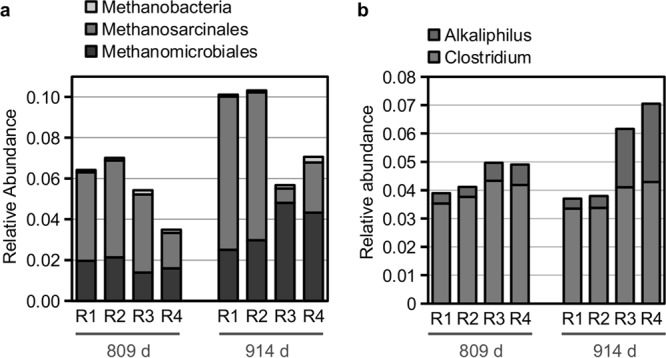
Relative abundance of taxonomic categories, defined from an analysis of community shotgun sequencing data sets of samples from R1 to R4 for days 809 and 914, that showed significant shifts coincident with increases in levels of syntrophic acetate oxidation in R3 and R4. (a) Methanogenic divisions shifted from aceticlastic (Methanosarcinales) to hydrogenotrophic (Methanomicrobiales) in R3 and R4; (b) genera belonging to the Clostridiaceae shifted to include relatively more reads assigned to Alkaliphilus in R3 and R4. Consensus taxonomies and relative abundances were determined with MEGAN, using the results of a BLASTX search of raw shotgun reads versus the NCBI-nr database.
Comparative changes in functional gene content.
We first compared the functional gene contents in various reactor microbiomes by noting the relative abundances of clusters of orthologous groups (COGs). Bioreactor samples showed high-level similarity in terms of higher-level COG categories (level 2 COGs assigned by MG-RAST) (see Fig. S9 in the supplemental material), and all bioreactor samples were similar in terms of broad functional content. Comparative beta-diversity analysis based on Pearson distances calculated from assigning the shotgun data sets to individual COG ortholog clusters (33,189 total COGs identified) clearly separated bioreactors by operating conditions and function (Fig. 6). Specifically, the jackknifed beta-diversity analysis based on COG content (Fig. 6b) showed high resolution and consistent clustering of samples compared to the less consistent clustering from unweighted UniFrac distances between bacterial 16S rRNA sequencing (Fig. 6a). COG contents consistently clustered replicate bioreactors and clearly separated low-ammonia (R1 and R2) and high-ammonia (R3 and R4) conditions.
FIG 6.

Distances between bioreactor samples based on unweighted UniFrac distances (near-full-length bacterial 16S rRNA gene characterizations) (a) and COG contents (calculated as Pearson distance) (b) from R1 to R4 for days 809 and 914. Bootstrap support values are shown for 100 rarefactions each. Separate scale bars are shown beneath each tree. Replicate bioreactors under the same operating conditions that successfully clustered are shaded (R3 and R4, treatment [high ammonia concentrations]; R1 and R2, control [low ammonia concentrations]).
To identify the COG abundances that were consistently different between bioreactor treatments, we performed paired analysis of variance (ANOVA) on all COGs that appeared in at least four samples (2,401 of the 3,189 COGs) (see Fig. S10 in the supplemental material). The statistically significant differences (P < 0.01) in COG content included a high representation of metabolic genes for paired comparisons both between high and low ammonia concentrations (57 significant COGs) (see Fig. S11a in the supplemental material) and between high- and low-level acetate oxidation (43 significant COGs) (see Fig. S11b in the supplemental material). Many of the statistically significant differences in COG abundances between conditions were representative of Archaea, including CO-dehydrogenase genes (see Fig. S11a in the supplemental material) and poorly characterized conserved archaeal clusters (see Fig. S11b in the supplemental material).
To target any changes in community structure that were related directly to the Wood-Ljungdahl pathway, which is the bacterial function of interest, we summarized the taxonomy of reads assigned to KEGG ECs in the reverse Wood-Ljungdahl pathway for the oxidation of acetate to CO2. The shotgun data contained 1,200 ± 300 reads (mean ± SD) per sample assigned to KEGG ECs in the Wood-Ljungdahl pathway. The consensus taxonomic assignments to each KEGG enzyme hit in the pathway were diverse and variable; the majority of the reads had no consensus taxonomy at the Bacteria superkingdom level or lower (a pathway diagram and corresponding taxonomic data are shown in Fig. S12 in the supplemental material), indicating that many of the gene regions captured were too conserved for sufficient taxonomic resolution. The Wood-Ljungdahl KEGG enzyme/taxonomy hits in Fig. S12 in the supplemental material were rarefied 100 times at 500 sequences per sample, and Pearson distances were calculated to determine if the taxonomic distributions within this particular set of KEGG ECs were able to distinguish between sample types. Sample clustering based solely on taxonomic abundances within the Wood-Ljungdahl pathway (see Fig. S13 in the supplemental material) did not distinguish between sample conditions or community function as reliably as the overall COG content (low bootstrap values and poor resolution in branching). However, the analysis did show that the experimental bioreactors became outliers from the other samples after the increase in syntrophic acetate oxidation (R3 and R4 at day 914) (see Fig. S13 in the supplemental material). The observation that the taxonomic distributions of the Wood-Ljungdahl pathway in R3 and R4 were different from those of the other bioreactor samples but were also different from each other suggests that the final distribution of syntrophic acetate oxidizers may have been different in the two replicate experimental bioreactors.
DISCUSSION
These results suggest that syntrophic acetate oxidation is carried out by a dynamic and heterogeneous community with this metabolic capacity rather than known defined cultures of syntrophic acetate oxidizers. We observed systematic changes in community evenness and gene functional content after perturbations that were performed to initiate syntrophic acetate oxidation, but we did not find keystone OTUs responsible for this function. Attempts to enrich acetate oxidizers resulted in divergent communities that were not representative of the bioreactor microbiomes. The functional capacity for syntrophic acetate oxidation was represented by a diverse array of taxa (see Fig. S12 in the supplemental material), which was present before and after bioreactor functional changes. We also observed that the robust response of the bioreactors to perturbations was characterized by a return to a similar evenness in community diversity (Fig. 2).
At the end of the operating period of R3 and R4, the total and free ammonia concentrations were 5.2 and 0.25 g N liter−1, respectively, the highest concentrations during the study period. The bioreactor performance, however, recovered to stable performance, with a reduction in the n-butyrate concentration to <0.01 g liter−1 (18), which was similar to concentrations for control R1 and R2, which were operated at considerably lower ammonia concentrations. Such low n-butyrate concentrations can be achieved only when acetate is maintained at low concentrations (i.e., when acetate is removed at very high rates). With the acetate cleavage pathway being inhibited under these conditions (5), the emergence of syntrophic acetate oxidation was important to add stability to the digester. We therefore verified other studies that reported this functional shift at high total ammonia levels (15, 17) and elucidated the structures and dynamics of microbiomes. The stable performance subsequently resulted in convergence of the overall community structures for all reactors (day 914) (Fig. 3). Thus, the emergence of an alternative pathway was instrumental for maintaining a robust digester.
Here, we observed that community evenness is an indicator of perturbation and stability. At first, community evenness decreased in response to an increase in the ammonia concentration as well as to an increase in temperature. Community evenness was reestablished as bioreactors returned to steady-state optimal performance (Fig. 2). The decreases in evenness in R3 and R4 at day 700 were indicative of the induced ammonia stress, despite the surprising observation that the bacterial phylogenetic structures of control R1 and R2 closely followed the structures of experimental R3 and R4 (UniFrac principle coordinate 1 [PC1] shows the primary coordinates of variation) (see Fig. S2a in the supplemental material). This may be explained by the fact that the loading rate of all bioreactors was decreased from 4.0 to 2.2 g VS liter−1 day−1 before day 700 (see Table S1 in the supplemental material). In other words, changes in evenness were driven by perturbations and were decoupled from the primary changes in phylogenetic structure, which were driven by the loading rate. This agrees with our previous observations that the loading rate was one of the variables most closely related to bacterial community structure in other anaerobic digesters (2).
Supplementary Material
ACKNOWLEDGMENTS
This research was supported by the National Research Initiative of the USDA National Institutes for Food and Agriculture under grant number 2004-35504-14896; Cornell University Agricultural Experiment Station federal formula funds under project number NYC-123444, received from the USDA National Institutes for Food and Agriculture; the Missouri Life Sciences Trust Fund; NIH grant DK070977; and NSF grant DEB-0841999. Mass spectrometry resources were funded by NIH grants NIDDK020579, NIDDK056341, and NCRR000954. BLASTX was carried out using the resources of the Computational Biology Service Unit of Cornell University, which is partially funded by Microsoft Corporation.
Footnotes
Published ahead of print 21 March 2014
Supplemental material for this article may be found at http://dx.doi.org/10.1128/AEM.00166-14.
REFERENCES
- 1.Wittebolle L, Marzorati M, Clement L, Balloi A, Daffonchio D, Heylen K, De Vos P, Verstraete W, Boon N. 2009. Initial community evenness favours functionality under selective stress. Nature 458:623–626. 10.1038/nature07840 [DOI] [PubMed] [Google Scholar]
- 2.Werner JJ, Knights D, Garcia ML, Scalfone NB, Smith S, Yarasheski K, Cummings TA, Beers AR, Knight R, Angenent LT. 2011. Bacterial community structures are unique and resilient in full-scale bioenergy systems. Proc. Natl. Acad. Sci. U. S. A. 108:4158–4163. 10.1073/pnas.1015676108 [DOI] [PMC free article] [PubMed] [Google Scholar]
- 3.Hashsham SA, Fernandez AS, Dollhopf SL, Dazzo FB, Hickey RF, Tiedje JM, Criddle CS. 2000. Parallel processing of substrate correlates with greater functional stability in methanogenic bioreactor communities perturbed by glucose. Appl. Environ. Microbiol. 66:4050–4057. 10.1128/AEM.66.9.4050-4057.2000 [DOI] [PMC free article] [PubMed] [Google Scholar]
- 4.Jetten MSM, Stams AJM, Zehnder AJB. 1992. Methanogenesis from acetate: a comparison of the acetate metabolism in Methanothrix soehngenii and Methanosarcina spp. FEMS Microbiol. Rev. 88:181–198. 10.1111/j.1574-6968.1992.tb04987.x [DOI] [Google Scholar]
- 5.De Baere LA, Devocht M, Van Assche P, Verstraete W. 1984. Influence of high NaCl and NH4Cl salt levels on methanogenic associations. Water Res. 18:543–548. 10.1016/0043-1354(84)90201-X [DOI] [Google Scholar]
- 6.Lee MJ, Zinder SH. 1988. Isolation and characterization of a thermophilic bacterium which oxidizes acetate in syntrophic association with a methanogen and which grows acetogenically on H2-CO2. Appl. Environ. Microbiol. 54:124–129 [DOI] [PMC free article] [PubMed] [Google Scholar]
- 7.Schnürer A, Schink B, Svensson BH. 1996. Clostridium ultunense sp. nov., a mesophilic bacterium oxidizing acetate in syntrophic association with a hydrogenotrophic methanogenic bacterium. Int. J. Syst. Bacteriol. 46:1145–1152. 10.1099/00207713-46-4-1145 [DOI] [PubMed] [Google Scholar]
- 8.Hattori S, Kamagata Y, Hanada S, Shoun H. 2000. Thermacetogenium phaeum gen. nov., sp. nov., a strictly anaerobic, thermophilic, syntrophic acetate-oxidizing bacterium. Int. J. Syst. Evol. Micobiol. 50:1601–1609. 10.1099/00207713-50-4-1601 [DOI] [PubMed] [Google Scholar]
- 9.Balk M, Weijma J, Stams AJM. 2002. Thermotoga lettingae sp. nov., a novel thermophilic, methanol-degrading bacterium isolated from a thermophilic anaerobic reactor. Int. J. Syst. Evol. Microbiol. 52:1361–1368. 10.1099/ijs.0.02165-0 [DOI] [PubMed] [Google Scholar]
- 10.Westerholm M, Roos S, Schnürer A. 2010. Syntrophaceticus schinkii gen. nov., sp. nov., an anaerobic, syntrophic acetate-oxidizing bacterium isolated from a mesophilic anaerobic filter. FEMS Microbiol. Lett. 309:100–104. 10.1111/j.1574-6968.2010.02023.x [DOI] [PubMed] [Google Scholar]
- 11.Hattori S. 2008. Syntrophic acetate-oxidizing microbes in methanogenic environments. Microbes Environ. 23:118–127. 10.1264/jsme2.23.118 [DOI] [PubMed] [Google Scholar]
- 12.Gonzalez-Cabaleiro R, Lema JM, Rodriguez J, Kleerebezem R. 2013. Linking thermodynamics and kinetics to assess pathway reversibility in anaerobic bioprocesses. Energy Environ. Sci. 6:3780–3789. 10.1039/c3ee42754d [DOI] [Google Scholar]
- 13.Phelps TJ, Conrad R, Zeikus JG. 1985. Sulfate dependent interspecies H2 transfer between Methanosarcina barkeri and Desulfovibrio vulgaris during coculture metabolism of acetate or methanol. Appl. Environ. Microbiol. 50:589–594 [DOI] [PMC free article] [PubMed] [Google Scholar]
- 14.Schnürer A, Zellner G, Svensson BH. 1999. Mesophilic syntrophic acetate oxidation during methane formation in biogas reactors. FEMS Microbiol. Ecol. 29:249–261. 10.1111/j.1574-6941.1999.tb00616.x [DOI] [Google Scholar]
- 15.Angenent LT, Sung S, Raskin L. 2002. Methanogenic population dynamics during startup of a full-scale anaerobic sequencing batch reactor treating swine waste. Water Res. 36:4648–4654. 10.1016/S0043-1354(02)00199-9 [DOI] [PubMed] [Google Scholar]
- 16.Koster IW, Lettinga G. 1984. The influence of ammonium-nitrogen on the specific activity of pelletized methanogenic sludge. Agric. Wastes 9:205–216. 10.1016/0141-4607(84)90080-5 [DOI] [Google Scholar]
- 17.Schnürer A, Nordberg A. 2008. Ammonia, a selective agent for methane production by syntrophic acetate oxidation at mesophilic temperature. Water Sci. Technol. 57(5):735–740. 10.2166/wst.2008.097 [DOI] [PubMed] [Google Scholar]
- 18.Garcia ML, Angenent LT. 2009. Interaction between temperature and ammonia in mesophilic digesters for animal waste treatment. Water Res. 43:2373–2382. 10.1016/j.watres.2009.02.036 [DOI] [PubMed] [Google Scholar]
- 19.Zehnder AJB, Huser BA, Brock TD, Wuhrmann K. 1980. Characterization of an acetate-decarboxylating, non-hydrogen-oxidizing methane bacterium. Arch. Microbiol. 124:1–11. 10.1007/BF00407022 [DOI] [PubMed] [Google Scholar]
- 20.Pumphrey GM, Madsen EL. 2008. Field-based stable isotope probing reveals the identities of benzoic acid-metabolizing microorganisms and their in situ growth in agricultural soil. Appl. Environ. Microbiol. 74:4111–4118. 10.1128/AEM.00464-08 [DOI] [PMC free article] [PubMed] [Google Scholar]
- 21.Liou JS, Derito CM, Madsen EL. 2008. Field-based and laboratory stable isotope probing surveys of the identities of both aerobic and anaerobic benzene-metabolizing microorganisms in freshwater sediment. Environ. Microbiol. 10:1964–1977. 10.1111/j.1462-2920.2008.01612.x [DOI] [PubMed] [Google Scholar]
- 22.DeRito CM, Pumphrey GM, Madsen EL. 2005. Use of field-based stable isotope probing to identify adapted populations and track carbon flow through a phenol-degrading soil microbial community. Appl. Environ. Microbiol. 71:7858–7865. 10.1128/AEM.71.12.7858-7865.2005 [DOI] [PMC free article] [PubMed] [Google Scholar]
- 23.Li T, Wu TD, Mazeas L, Toffin L, Guerquin-Kern JL, Leblon G, Bouchez T. 2008. Simultaneous analysis of microbial identity and function using NanoSIMS. Environ. Microbiol. 10:580–588. 10.1111/j.1462-2920.2007.01478.x [DOI] [PMC free article] [PubMed] [Google Scholar]
- 24.Li T, Mazéas L, Sghir A, Leblon G, Bouchez T. 2009. Insights into networks of functional microbes catalysing methanization of cellulose under mesophilic conditions. Environ. Microbiol. 11:889–904. 10.1111/j.1462-2920.2008.01810.x [DOI] [PubMed] [Google Scholar]
- 25.Dojka MA, Harris JK, Pace NR. 2000. Expanding the known diversity and environmental distribution of an uncultured phylogenetic division of bacteria. Appl. Environ. Microbiol. 66:1617–1621. 10.1128/AEM.66.4.1617-1621.2000 [DOI] [PMC free article] [PubMed] [Google Scholar]
- 26.Frank DN. 2008. XplorSeq: a software environment for integrated management and phylogenetic analysis of metagenomic sequence data. BMC Bioinformatics 9:420. 10.1186/1471-2105-9-420 [DOI] [PMC free article] [PubMed] [Google Scholar]
- 27.DeSantis TZ, Hugenholtz P, Larsen N, Rojas M, Brodie EL, Keller K, Huber T, Dalevi D, Hu P, Andersen GL. 2006. Greengenes, a chimera-checked 16S rRNA gene database and workbench compatible with ARB. Appl. Environ. Microbiol. 72:5069–5072. 10.1128/AEM.03006-05 [DOI] [PMC free article] [PubMed] [Google Scholar]
- 28.Caporaso JG, Bittinger K, Bushman FD, DeSantis TZ, Andersen GL, Knight R. 2010. PyNAST: a flexible tool for aligning sequences to a template alignment. Bioinformatics 26:266–267. 10.1093/bioinformatics/btp636 [DOI] [PMC free article] [PubMed] [Google Scholar]
- 29.Huber T, Faulkner G, Hugenholtz P. 2004. Bellerophon: a program to detect chimeric sequences in multiple sequence alignments. Bioinformatics 20:2317–2319. 10.1093/bioinformatics/bth226 [DOI] [PubMed] [Google Scholar]
- 30.Schloss PD, Westcott SL, Ryabin T, Hall JR, Hartmann M, Hollister EB, Lesniewski RA, Oakley BB, Parks DH, Robinson CJ, Sahl JW, Stres B, Thallinger GG, Van Horn DJ, Weber CF. 2009. Introducing mothur: open-source, platform-independent, community-supported software for describing and comparing microbial communities. Appl. Environ. Microbiol. 75:7537–7541. 10.1128/AEM.01541-09 [DOI] [PMC free article] [PubMed] [Google Scholar]
- 31.Wang Q, Garrity GM, Tiedje JM, Cole JR. 2007. Naive Bayesian classifier for rapid assignment of rRNA sequences into the new bacterial taxonomy. Appl. Environ. Microbiol. 73:5261–5267. 10.1128/AEM.00062-07 [DOI] [PMC free article] [PubMed] [Google Scholar]
- 32.Werner JJ, Koren O, Hugenholtz P, DeSantis TZ, Walters WA, Caporaso JG, Angenent LT, Knight R, Ley RE. 2012. Impact of training sets on classification of high-throughput bacterial 16S rRNA gene surveys. ISME J. 6:94–103. 10.1038/ismej.2011.82 [DOI] [PMC free article] [PubMed] [Google Scholar]
- 33.Price MN, Dehal PS, Arkin AP. 2010. FastTree 2—approximately maximum-likelihood trees for large alignments. PLoS One 5:e9490. 10.1371/journal.pone.0009490 [DOI] [PMC free article] [PubMed] [Google Scholar]
- 34.Faith DP, Lozupone CA, Nipperess D, Knight R. 2009. The cladistic basis for the phylogenetic diversity (PD) measure links evolutionary features to environmental gradients and supports broad applications of microbial ecology's “phylogenetic beta diversity” framework. Int. J. Mol. Sci. 10:4723–4741. 10.3390/ijms10114723 [DOI] [PMC free article] [PubMed] [Google Scholar]
- 35.Lozupone C, Knight R. 2005. UniFrac: a new phylogenetic method for comparing microbial communities. Appl. Environ. Microbiol. 71:8228–8235. 10.1128/AEM.71.12.8228-8235.2005 [DOI] [PMC free article] [PubMed] [Google Scholar]
- 36.Caporaso JG, Kuczynski J, Stombaugh J, Bittinger K, Bushman FD, Costello EK, Fierer N, Pena AG, Goodrich JK, Gordon JI, Huttley GA, Kelley ST, Knights D, Koenig JE, Ley RE, Lozupone CA, McDonald D, Muegge BD, Pirrung M, Reeder J, Sevinsky JR, Turnbaugh PJ, Walters WA, Widmann J, Yatsunenko T, Zaneveld J, Knight R. 2010. QIIME allows analysis of high-throughput community sequencing data. Nat. Methods 7:335–336. 10.1038/nmeth.f.303 [DOI] [PMC free article] [PubMed] [Google Scholar]
- 37.Meyer F, Paarmann D, D'Souza M, Olson R, Glass EM, Kubal M, Paczian T, Rodriguez A, Stevens R, Wilke A, Wilkening J, Edwards RA. 2008. The metagenomics RAST server—a public resource for the automatic phylogenetic and functional analysis of metagenomes. BMC Bioinformatics 9:386. 10.1186/1471-2105-9-386 [DOI] [PMC free article] [PubMed] [Google Scholar]
- 38.Huson DH, Auch AF, Qi J, Schuster SC. 2007. MEGAN analysis of metagenomic data. Genome Res. 17:377–386. 10.1101/gr.5969107 [DOI] [PMC free article] [PubMed] [Google Scholar]
- 39.Zinder SH, Mah RA. 1979. Isolation and characterization of a thermophilic strain of Methanosarcina unable to use H2-CO2 for methanogenesis. Appl. Environ. Microbiol. 38:996–1008 [DOI] [PMC free article] [PubMed] [Google Scholar]
- 40.Ley RE, Hamady M, Lozupone C, Turnbaugh PJ, Ramey RR, Bircher JS, Schlegel ML, Tucker TA, Schrenzel MD, Knight R, Gordon JI. 2008. Evolution of mammals and their gut microbes. Science 320:1647–1651. 10.1126/science.1155725 [DOI] [PMC free article] [PubMed] [Google Scholar]
Associated Data
This section collects any data citations, data availability statements, or supplementary materials included in this article.