

Abstract
The model rumen Firmicutes organism Ruminococcus albus 8 was grown using ammonia, urea, or peptides as the sole nitrogen source; growth was not observed with amino acids as the sole nitrogen source. Growth of R. albus 8 on ammonia and urea showed the same growth rate (0.08 h−1) and similar maximum cell densities (for ammonia, the optical density at 600 nm [OD600] was 1.01; and for urea, the OD600 was 0.99); however, growth on peptides resulted in a nearly identical growth rate (0.09 h−1) and a lower maximum cell density (OD600 = 0.58). To identify differences in gene expression and enzyme activities, the transcript abundances of 10 different genes involved in nitrogen metabolism and specific enzyme activities were analyzed by harvesting mRNA and crude protein from cells at the mid- and late exponential phases of growth on the different N sources. Transcript abundances and enzyme activities varied according to nitrogen source, ammonia concentration, and growth phase. Growth of R. albus 8 on ammonia and urea was similar, with the only observed difference being an increase in urease transcript abundance and enzyme activity in urea-grown cultures. Growth of R. albus 8 on peptides showed a different nitrogen metabolism pattern, with higher gene transcript abundance levels of gdhA, glnA, gltB, amtB, glnK, and ureC, as well as higher activities of glutamate dehydrogenase and urease. These results demonstrate that ammonia, urea, and peptides can all serve as nitrogen sources for R. albus and that nitrogen metabolism genes and enzyme activities of R. albus 8 are regulated by nitrogen source and the level of ammonia in the growth medium.
INTRODUCTION
Ammonia is the major end product of digestion of dietary protein and nonprotein nitrogen (urea and amino acids), as well as the major source of nitrogen for protein synthesis by ruminal bacteria (1–3). Results over a wide range of feed and N intakes demonstrate that 60 to 80% of bacterial N is derived from ammonia as a precursor (4). Since 14% of cell dry mass is nitrogen, bacterial protein synthesis and growth are greatly affected by the efficiency of ammonia assimilation. Despite its importance and central role as an intermediate in the degradation as well as assimilation of dietary nitrogen by intestinal bacteria, our understanding of the mechanism of ammonia assimilation in ruminal bacteria is superficial.
Enzymes for assimilation of ammonia are widely conserved across the bacterial domain, with differences in distribution and transcriptional regulation influenced by environmental niche. Glutamate dehydrogenase (GDH), glutamine synthetase (GS), and glutamate synthase (GOGAT) are the three major types of enzymes that regulate the intracellular pool of nitrogen by controlling ammonia assimilation (5). GDH plays a significant role in the metabolism of nitrogen in many organisms by assimilating ammonia through the conversion of 2-oxoglutarate to glutamate. In the enteric proteobacteria, such as Escherichia coli and Salmonella, GDH is the primary nitrogen assimilation pathway when ammonia is in excess (>1 mM), though with Bacillus subtilis and many Gram-positive bacteria, GDH activity is absent, as excess ammonia is rarely encountered (6, 7). The low-affinity GDH reaction is energy independent but redox dependent, using NAD(P)H as a cofactor. In both Gram-negative and Gram-positive bacteria, when the ammonia concentration is below 0.1 mM, the GS-GOGAT pathway becomes the primary ammonia assimilation pathway. The high-affinity enzyme GS is ATP dependent and converts glutamate and ammonia to glutamine. GOGAT activity is coupled to GS and converts glutamine to glutamate (5). In the presence of 2-oxoglutarate, GOGAT synthesizes 2 mol of glutamate from the glutamine produced by GS (5, 8, 9). Intracellular ammonia levels are regulated by GlnK, a PII-like protein that acts as a sensor and in turn regulates the ammonium transporter AmtB (10). Urea is hydrolyzed to ammonia and carbamate by urease, an enzyme typically composed of three subunits (11). Carbamate is hydrolyzed spontaneously, yielding a second ammonia molecule and carbonic acid. The two ammonia molecules are then assimilated using the GDH or GS-GOGAT system.
Ruminococcus albus is one of the predominant plant cell wall-degrading bacteria in the rumen (12). An obligate anaerobe, R. albus is responsible for hydrolysis of the β-1,4-linked glucose and xylose backbone residues of cellulose and hemicellulose, which are the major constituents in plant cell walls. Because nitrogen metabolism is associated with carbohydrate metabolism, studies of ammonia assimilation, urea degradation, and peptide and amino acid utilization are of great interest. Bioinformatic analysis of the R. albus 8 draft genome sequence (8× coverage; 3.8 Mb; accession no. NZ_ADKM00000000) (K. E. Nelson et al., unpublished data) revealed a number of genes encoding enzymes critical for nitrogen metabolism and ammonia assimilation (Fig. 1). We identified genes for an NADH-dependent GDH (gdh), an NADPH-dependent GDH (gdhA), a high-affinity ammonium transporter (amtB), a regulatory protein (glnK), a putative urease, two different types of GS (type I GS [glnA] and type III GS [glnN]), and the two subunits of a typical bacterial GOGAT (large subunit [gltB] and small subunit [gltD]). Urease activity in several R. albus strains has been described previously (13). R. albus 8 was grown with ammonia, urea, peptides, or amino acids as the nitrogen source. At mid- and late log phases, transcript abundances and enzymatic activities of nitrogen metabolism proteins were analyzed to investigate nitrogen utilization and flux.
FIG 1.

Nitrogen metabolism pathways identified in R. albus 8 through bioinformatic analyses.
MATERIALS AND METHODS
Bacteria and culture conditions.
The R. albus 8 strain used in this study was obtained from the culture collection of the Department of Animal Sciences of the University of Illinois and verified using full-length 16S rRNA gene sequencing. R. albus 8 cultures were grown anaerobically at 39°C in a defined medium containing 10 mM cellobiose (14), which varied only in the chemical form of nitrogen provided. The medium nitrogen sources used were 0.125% (wt/vol) (NH4)2SO4, 0.125% (wt/vol) urea, 0.131% (wt/vol) peptide (N-Z amine A; Sigma-Aldrich, St. Louis, MO), a purified amino acid mixture equimolar to the 0.131% peptide source, and a mixture of 0.128% (wt/vol) ammonia and 0.131% (wt/vol) peptide. Bacterial growth was measured in triplicate by determining the increase in optical density at 600 nm (OD600) with a Spectronic 21D spectrophotometer (Milton Roy, Chicago, IL) for 48 h. For RNA extraction, enzyme assays, and chemical analysis, bacterial cultures were harvested at mid- and late log phases by centrifugation at 7,500 rpm for 5 min. The centrifuged cell pellet and supernatants were stored at −80°C until analysis.
Chemical analyses.
Ammonia concentrations in supernatants were measured by the colorimetric method of Chaney and Marbach (15). The concentration of urea was determined by measuring ammonia after incubation with urease (urease buffer reagent; Sigma-Aldrich) (15). The concentrations of total α-amino acids from the supernatants of peptide-grown cultures were analyzed by the ninhydrin method (16). Briefly, the supernatants of peptide-grown cultures were hydrolyzed by use of HCl (6 N HCl for 24 h under N2 gas at 110°C), and free amino groups were assayed with ninhydrin, using glycine as the standard (17, 18).
RNA extraction and purification.
Total RNAs were isolated from R. albus 8 centrifuged pellets (approximately 1.02 × 10⁷ cells) by use of ice-cold TRIzol (Invitrogen Corp., Carlsbad, CA). Cell pellets were resuspended in lysis buffer (20 mM Tris-HCl, pH 8.0, 2 mM EDTA, 1.2% Triton X-100, 30 mg/ml lysozyme, and 128 mM β-mercaptoethanol) and treated with 10 mg/ml proteinase K for 30 min at 56°C (Qiagen, Valencia, CA). One milliliter of ice-cold TRIzol was added to each sample and homogenized. Genomic DNA was removed with RNase-free DNase (Qiagen), and total RNA was cleaned up with an RNeasy MinElute cleanup kit (Qiagen). RNA concentration and purity were assessed using a NanoDrop ND-1000 spectrophotometer (NanoDrop Technologies, Wilmington, DE). All RNA samples for quantitative reverse transcriptase PCR (qRT-PCR) had A260/A280 ratios of >1.9.
cDNA synthesis.
A random hexamer and the Superscript III first-strand synthesis system (Invitrogen) were used for reverse transcription. Each cDNA synthesis reaction mixture contained 100 ng of total RNA, 2 μl random primers, and 1 μl of a mixture containing a 10 mM concentration of each deoxynucleoside triphosphate (dNTP). After incubation at 65°C for 5 min, 10 μl of a master mix containing 2 μl 10× RT buffer, 1 μl 0.1 M dithiothreitol (DTT), 1 μl (200 U) of SuperScript III RT, 4 μl of 25 mM MgCl2, and 1 μl of RNaseOUT (40 U) was added. The cDNA synthesis reaction was performed by incubation at 25°C for 5 min followed by 50°C for 60 min and, finally, 70°C for 15 min. The cDNA was then diluted 1:4 with DNase- and RNase-free water. After cDNA synthesis, 1 μl of RNase H was added and incubated at 37°C for 20 min to remove RNA. Synthesized cDNA free of RNA was stored at −20°C.
Selection of genes and primer design.
Primers were designed with Primer Express software v3.0 (Applied Biosystems, Foster City, CA), with amplicon lengths of 100 to 150 bp and low specific binding at the 3′ end (see Table S1 in the supplemental material). qRT-PCR primers were tested, and only primers that resulted in a single band of the expected size and the correct amplification product (verified by sequencing) were used. The accuracy of a primer pair was also evaluated by the presence of a unique peak in postamplification melting curves.
qRT-PCR.
qRT-PCR was performed using SYBR green I (Applied Biosystems) and an ABI Prism 7900 high-throughput sequence detection system. Four microliters of cDNA was mixed with 5 μl SYBR green master mix (Applied Biosystems), 0.4 μl each of forward and reverse primers, and 0.2 μl of DNase- and RNase-free water. Each sample was run in triplicate with a six-point relative standard curve plus nontemplate controls (NTC). The qPCRs were performed under the following conditions: 50°C for 2 min, 95°C for 10 min, and 40 cycles of 95°C for 15 s and 60°C for 1 min. To verify the presence of a single PCR product, postamplification melting curves using incremental temperatures to 95°C for 15 s plus 65°C for 15 s were performed. Data were analyzed using SDS v2.2.1 software (Applied Biosystems). To indicate overall urease transcription, we used ureC, which encodes the α-subunit of urease, as it has been shown to be essential for urease activity in other bacteria (19). Transcript abundance data were normalized using the geometric mean for the most stable genes as suggested by evaluation of multiple internal control genes (atpD, infB, rpoB, murB, pgi, and groEL). qPCR normalization was performed by geNorm software following a previously described procedure (20, 21).
Enzyme activity assay.
Crude enzyme extracts were prepared using previous methods (22, 23). Briefly, 40 ml of each culture was harvested by centrifugation at 10,000 × g for 20 min at 4°C and then washed once with anaerobic buffer (50 mM Tris, 1% KCl, 1 mM dithiothreitol, pH 6.8). Washed cells were resuspended in 3 ml of lysis buffer (20 mM Tris-HCl, 1 mM DTT, and 1 mM phenylmethylsulfonyl fluoride) and disrupted by sonication at 80 W (five cycles of a 30-s pulse followed by 1 min of cooling in an ice water bath). Assays for NADH- and NADPH-dependent GDH (23–25), GS γ-glutamyl transferase (γ-GT) (26), GS biosynthetic activity (27, 28), and NADH- and NADPH-dependent GOGAT were carried out as previously described (29). Urease activity was measured with a coupled enzyme assay as described previously (11, 30).
Statistical analysis.
A MIXED model with repeated measures (release 9.0; SAS Institute, Cary, NC) using spatial power as the covariate structure was used for all analyses (normalized transcript abundances and specific enzyme activities). The model included fixed effects of time, treatment (different nitrogen sources), and time-treatment interaction. Statistical significance was declared for P values of ≤0.05. Global relationships among transcript abundances and enzyme activities were visualized by performing a principal component analysis on the expression data and plotting arrays in a two-dimensional space corresponding to the first two principal components with the statistical package PRIMER 6.0 (Primer-E, Plymouth, United Kingdom) (31).
RESULTS
R. albus 8 nitrogen utilization.
Growth of R. albus 8 varied by nitrogen source (Fig. 2 and Table 1). The highest growth rate (0.09 h−1) was observed when R. albus 8 was grown on peptides, but a significantly lower maximum cell density (OD600 of 0.71) than that for growth on ammonia or urea (OD600 of 1.01 or 0.99, respectively) was observed. Growth of R. albus 8 on ammonia and urea was similar in terms of maximum cell density and growth rate (0.08 h−1 on both ammonia and urea) (Table 1). R. albus 8 was unable to grow on amino acids as the sole nitrogen source (Fig. 2).
FIG 2.

Growth of R. albus 8 on the following nitrogen sources: ammonium sulfate (◆), urea (◼), peptides (▲), ammonium sulfate plus peptides (×), and amino acids (●). Data points represent averages for triplicate tubes used to measure growth of R. albus 8 (OD600) on each nitrogen source. Error bars represent standard deviations.
TABLE 1.
Effects of different nitrogen sources on growth of R. albus 8
| Nitrogen source | Growth rate (h−1)a | Cell density (OD600)b |
|---|---|---|
| Ammonia | 0.08 ± 0.002 | 1.01 ± 0.009 |
| Urea | 0.08 ± 0.005 | 0.99 ± 0.045 |
| Peptides | 0.09 ± 0.004 | 0.71 ± 0.012 |
| Ammonia plus peptides | 0.10 ± 0.002 | 0.70 ± 0.002 |
Maximum specific growth rate during exponential growth.
Maximum optical density over 48 h.
To determine if R. albus exhibited any preference for nitrogen source, the organism was grown on a mixture of ammonia and peptides (Fig. 3D). While the maximum cell density was the same as that for growth on peptides alone (OD600 of 0.7), the growth rate exceeded that seen with any individual nitrogen source (0.10 h−1), suggesting that both sources were being utilized, with the rate of ammonia assimilation, the preferred N source, exceeding that of peptide assimilation (Fig. 3D).
FIG 3.
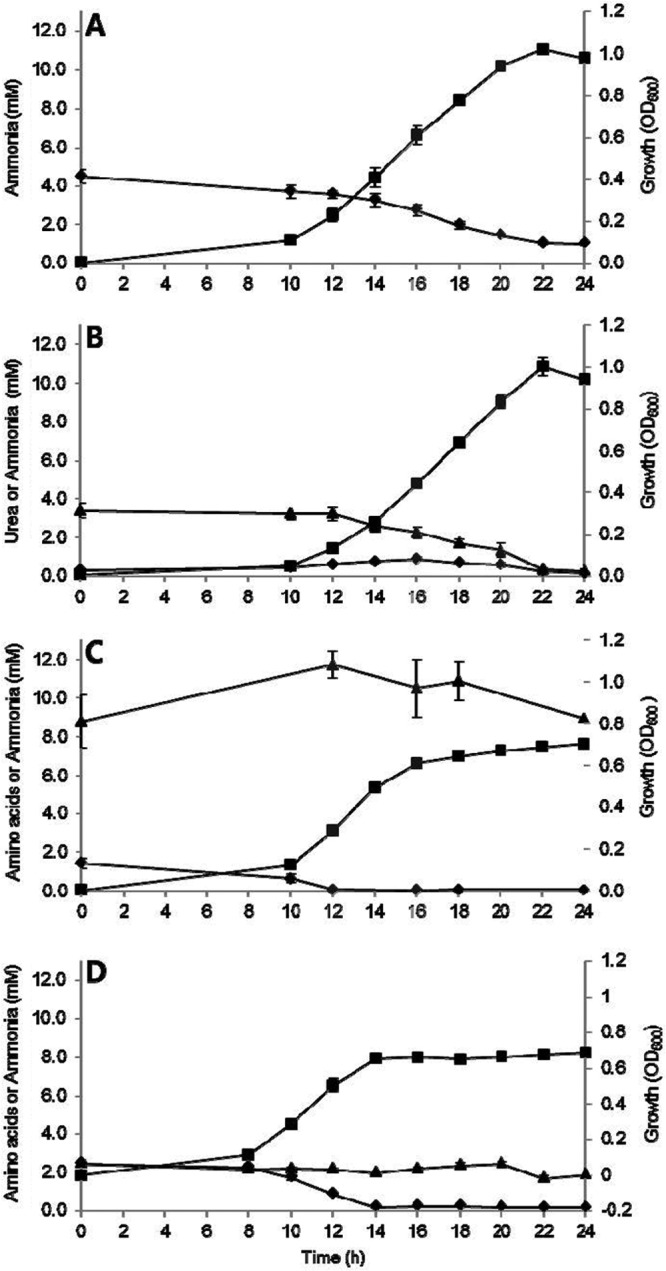
Time course measurement of residual nitrogen source concentration and growth of R. albus 8 on different nitrogen sources, including ammonia (A), urea (B), peptides (C), and ammonia plus peptides (D). The data show R. albus 8 growth (■) and ammonium sulfate (◆) and urea or α-amino acid (from peptides) (▲) concentrations. Data points represent averages for triplicate experiments. Error bars represent standard deviations.
The concentrations of ammonia and urea used by R. albus 8 were inversely proportional to the increases in cell density (Fig. 3A and B). During growth on urea, concentrations of ammonia increased between 10 and 16 h (Fig. 3B), with a concomitant decrease of urea. However, the ammonia concentration in the medium supernatant was lower than expected given the rate at which urea was degraded, suggesting ammonia uptake or intracellular hydrolysis. Concentrations of ammonia and urea both decreased substantially during the exponential phase of growth (between 16 and 24 h).
The ammonia concentration remained low during R. albus 8 growth on peptides, reducing from 1.4 mM at 0 h to below the detection limit during log phase (∼0.05 mM ammonia) (Fig. 3C), while the concentration of peptides, measured as α-amino acids, was maintained above 8.8 ± 1.4 mM for the entire growth period. At this concentration of peptides, nitrogen is likely in excess, perhaps explaining why α-amino acid concentrations did not change significantly over the 24-h incubation period. Collectively, these results indicate that the preferred nitrogen source of R. albus 8 is ammonia but that this strain is also able to utilize urea and peptides as nitrogen sources.
Transcript abundances of nitrogen utilization genes.
To investigate the transcriptional responses of nitrogen metabolism genes during growth on the different nitrogen sources, the levels of 10 gene transcripts were evaluated by qPCR (Fig. 4; see Table S2 in the supplemental material) at mid- and late-log-phase growth. Early-log-phase samples were collected for ammonia and urea (see Tables S3 and S4), but with the higher growth rate and abbreviated log phase, early-log-phase samples were not obtained for peptide-grown cultures; thus, only mid- and late-log-phase samples were used for statistical analysis and comparison.
FIG 4.
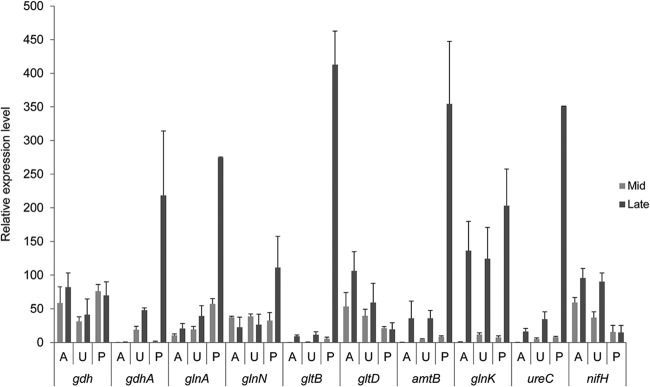
Relative transcript abundance levels of selected genes important in ammonia assimilation and nitrogen metabolism in R. albus 8 grown on different nitrogen sources at mid- and late log phases. The graph represents the relative qRT-PCR values after normalization using the most stable internal control genes from geNorm analysis. Capital letters indicate different nitrogen sources: A, ammonium sulfate; U, urea; and P peptides. Results represent the means for three replicates. Error bars represent standard deviations.
Transcript abundances of the genes for NADH-dependent glutamate dehydrogenase (gdhA), type III GS (glnA), the large subunit of GOGAT (gltB), the ammonium transporter (amtB), a PII-like protein (glnK), and urease (ureC) increased from mid- to late-log-phase growth for all nitrogen sources examined (Fig. 3). However, the relative expression of these genes differed, with significantly higher transcript abundances of all these genes in R. albus 8 grown on peptides. The gdhA transcript abundance during growth on peptides was 600-fold higher than that with growth on ammonia and 10-fold higher than that with growth on urea in late exponential phase (see Table S2 in the supplemental material). Transcript abundances of glnA and ureC followed the same pattern, with 20-fold and 8-fold higher glnA abundances and 21-fold and 10-fold higher ureC abundances than those with growth on ammonia and urea, respectively. The transcript abundances of gltB and amtB were 40-fold and 10-fold higher in peptide-grown cultures than in both ammonia- and urea-grown cultures. Transcript abundances for the PII-like protein gene glnK were most similar between the different nitrogen sources, with only a 1.5-fold increase in peptide-grown cultures. The transcript abundances for glnA, gltB, amtB, and glnK were not statistically different between cultures with ammonia or urea as the nitrogen source, but relative abundances of both gdhA and ureC were higher for cultures grown on urea.
The small subunit of GOGAT (gltD) and the nitrogenase iron protein (nifH) showed increased transcript abundances in ammonia- and urea-grown cultures of R. albus 8 but did not change with cultures grown on peptides. Increased transcript abundance of the NADH-dependent glutamate dehydrogenase (gdh) was observed for ammonia-grown cultures only, with statistically insignificant changes seen for both growth on urea and growth on peptides. The type III GS (glnN) increased in late log phase for peptide-grown cultures but remained unchanged with growth on ammonia and urea.
Enzyme assays of nitrogen utilization proteins.
The activities of GDH, GS, GOGAT, and urease were measured using biochemical assays on cell extracts and reported as specific activities (Table 2). Enzymatic activities were affected by changes in nitrogen source and nitrogen concentration. Maximum NADH-dependent GDH activity was detected in late log phase for growth on all nitrogen sources and was significantly higher under all conditions than NADPH-dependent GDH activity, which remained unchanged over time with growth on ammonia and peptides but increased during late log phase with growth on urea.
TABLE 2.
Effects of different nitrogen sources on enzyme activities in R. albus 8a
| Nitrogen source | Log phase | GDH sp act (nmol/min/mg) |
GS γ-transferase sp act (U/min/mg) | GS biosynthetic activity (nmol Pi/min/mg) | GOGAT sp act (nmol/min/mg) |
Urease sp act (U/min/mg) | ||
|---|---|---|---|---|---|---|---|---|
| NADPH | NADH | NADPH | NADH | |||||
| Ammonia | Mid | 5.3 | 252.8a | 1.0# | 953.5 | 0.2 | 0.0 | 14.0a# |
| Late | 5.7a | 329.7a | 2.6a* | 1,288.0a | <0 | 0.1 | 24.7a* | |
| Urea | Mid | 10.8# | 121.7a# | 0.4# | 1,094.9 | 0.1 | 0.1 | 38.9b# |
| Late | 35.5b* | 292.1b* | 1.1b* | 1,090.5a | 0.0 | 0.0 | 68.4b* | |
| Peptides | Mid | 7.9 | 236.5a# | 0.2 | 632.5 | 0.2 | 0.1 | 35.5b# |
| Late | 7.9a | 419.8a* | 0.1c | 473.2b | 0.1 | <0 | 50.0b* | |
| Assay SE | 4.6 | 40.7 | 0.4 | 126.3 | 0.1 | 0.1 | 7.8 | |
Symbols are used to represent statistical differences. In comparing nitrogen sources or growth phases, the absence of a symbol indicates no statistical difference. Otherwise, data are grouped as follows: those that are not statistically different from one another have the same letter or character, while those that are statistically different have different letters or characters. “a,” “b,” and “c” denote significant (P < 0.05) differences between nitrogen sources, while # and * denote significant (P < 0.05) effects in different growth phases.
GS γ-glutamyl transferase activity increased between mid- and late log phase for cells with ammonia and urea as the nitrogen source; this activity was low throughout growth for peptide-grown cells. GS biosynthetic activity, which represents the biological function of GS in the organism, increased from mid- to late log phase for ammonia-grown cultures and decreased for those grown on peptides, while remaining unchanged for urea cultures. NADH-GOGAT and NADPH-GOGAT activities were not detected for any of the nitrogen sources.
The highest urease activity was observed for urea-grown cells, though the activity increased between mid- and late log phase for all nitrogen sources examined.
Principal component analysis.
In order to integrate and determine the relationships between transcriptional responses and enzyme activities, we analyzed our data by using principal component analysis (Fig. 5). Transcript abundances of gltD and nifH and measured enzyme activities for γ-GT were all correlated with late growth stages on ammonia and, to a lesser extent, urea, both correlated with increasing concentrations of available ammonia. Transcript abundances of glnK and gdh and measured enzyme activities for NADH-GDH were correlated with late growth stages for urea and ammonia as well as for peptides. Transcript abundances of glnN, glnA, gdhA, gltB, and amtB were strongly correlated with later protein growth stages, only slightly correlated with later ammonia or urea concentrations, and independent of the free ammonia concentration. Urease activity was correlated with later peptide growth phases and was slightly negatively correlated with later growth phases on ammonia and urea, where available ammonia decreased.
FIG 5.
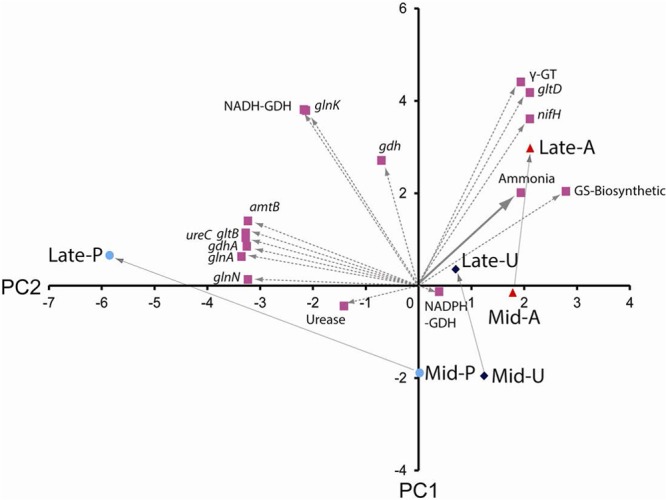
Integration of gene transcript abundances, enzyme activities, and residual substrate (ammonia or amino acids from peptides) concentrations in R. albus 8 grown on ammonia, urea, or peptides by using principal component analysis. Principal component analysis was performed after normalization of gene transcript abundances, enzyme activities, and residual substrates by use of Primer 6 software. Bold arrows indicate the nitrogen substrate, and dotted lines indicate gene transcript abundances and enzyme activities. Percentages of variance for PC1 and PC2 were 76.7% and 23.3%, respectively.
DISCUSSION
In this paper, we investigated gene expression and enzyme activities involved in nitrogen metabolism for R. albus, a predominant plant cell wall-degrading anaerobe in the rumen and other gut ecosystems (32). The effects of different nitrogen sources on R. albus 8 were examined through comparison of growth and nitrogen substrate utilization with ammonia, urea, or peptides as the sole nitrogen source (Fig. 2 and 3). Consistent with original research, R. albus 8 utilized ammonia and urea and showed similar growth patterns on both substrates (Fig. 1) (33). R. albus 8 was also able to grow on peptides as a nitrogen source; although the growth yield was lower than that on preferred nitrogen sources (urea and ammonia), the maximum specific growth rate did not decrease. To our knowledge, this is the first report of R. albus 8 using peptides as a nitrogen source. Bioinformatic analysis of the draft genome sequence revealed that R. albus 8 is equipped with several peptide transporters and peptidases for uptake and utilization of peptides, including three peptide ABC transporters, two dipeptide ABC transporters, and 25 genes involved in peptidase metabolism. This finding is also consistent with patterns of nitrogen utilization in the rumen, where free amino acids are rapidly deaminated to produce ammonia and amino acids are transported into bacterial cells in peptide form, enabling energy conservation at the transport level (1, 3).
On all three nitrogen sources, the gdh gene transcript abundance patterns correlated with NADH-GDH activity, which hydrolyzes glutamate to produce 2-oxoglutarate and ammonia. The high NADH-GDH transcript abundance and activity at limiting concentrations of ammonia (≤1 mM) observed in this report agree with previous work demonstrating increased NADH-GDH activity in the ruminal Bacteroidetes species Prevotella bryantii B14 grown under ammonia-limiting conditions (34). Conversely, the unchanged NADPH-GDH activity observed with growth on ammonia contrasts with a previous report that P. bryantii B14 showed higher NADPH-GDH activity than NADH-GDH activity when the medium concentration of ammonia was 1 mM (34). A possible interpretation of these results is that R. albus 8 hydrolyzes glutamate to ammonia and 2-oxoglutarate by use of NADH-GDH to secure ammonia when environmental ammonia concentrations are limiting, while synthesizing glutamate with NADPH-GDH by using ammonia from the intracellular amino acid pool constitutively under the conditions examined in this study.
GS biosynthetic enzyme activity was consistently lower with growth on peptides than with growth on ammonia and urea (Fig. 4 and Table 2). Interestingly, both glnA and glnN gene transcript abundance patterns on ammonia and urea were in contrast to those previously observed in enteric bacteria (5, 35) or cyanobacteria (36), where GS is a scavenging system that is highly upregulated at low environmental ammonia concentrations. While type III GS may function when ammonia is not limited in R. albus 8 (2), it may not be the major enzyme pathway for ammonia assimilation at low environmental ammonia concentrations as it is in the enteric bacterial paradigm. Our previous studies of type III GS from Prevotella ruminicola 23 showed that the enzyme played a major role in ammonia assimilation under nonlimiting conditions, suggesting a biological function similar to that of R. albus 8 type III GS (37).
Increased transcript abundances of amtB and glnK on all nitrogen sources during late log phase were observed in R. albus 8 when the ammonia concentration was less than 1 mM; even higher transcript abundances were seen when ammonia levels were less than 0.1 mM (Fig. 3C and 4). These observations are logical, as enhanced active ammonium transport activity would be desirable to increase ammonia uptake from the environment when ammonia concentrations are limiting.
Urease activity was higher in the presence of urea than in the presence of ammonia and peptides. Interestingly, urease transcript abundance in R. albus 8 is not predicated on the presence of urea in the medium. Urease activity induction without urea was also observed in Corynebacterium glutamicum upon nitrogen starvation and in Klebsiella pneumonia under nitrogen-limited conditions (38, 39). This urease activity may demonstrate that R. albus 8 expresses urease to acquire urea as an alternative nitrogen source when the ammonia concentration in the medium is limited.
Although R. albus 8 does not have the complete suite of genes, structural proteins, and cofactors necessary for nitrogen fixation, bioinformatic analysis of the R. albus 8 draft genome sequence revealed several genes involved in nitrogen fixation, including nifH, nifE, and nifB. As there is no evidence that nitrogen fixation occurs in the rumen or other mammalian gut ecosystems (40), the function of these genes in R. albus 8 is not understood. However, our results demonstrated that the nifH gene transcript abundance differed with the ammonia concentration when R. albus 8 was grown on ammonia and urea. nifH was upregulated on ammonia and urea in late log phase as the ammonia concentration decreased but remained unchanged throughout growth on peptides. This result agrees with previous studies demonstrating regulation of nitrogen fixation from ammonia in cyanobacteria and archaea (41, 42).
When R. albus 8 was grown on ammonia, there was an increased transcript abundance of the ammonium transporter (AmtB) and increased activity of glutamate dehydrogenase (NADH-GDH) with downregulation of GS during log phase, supporting the synthesis of ammonia from glutamate by NADPH-GDH and then transformation to glutamine by GS during early exponential growth. However, in late log phase, glutamate was transformed to 2-oxoglutarate by NADH-GDH, which can then enter the reverse tricarboxylic acid (TCA) cycle for energy metabolism. The ammonium transporter, AmtB, is upregulated to enhance ammonia uptake from the medium when the ammonia concentration is limited at late log phase, and GS activity is downregulated to reduce glutamine formation from glutamate when the glutamate concentration is low due to ammonia limitation. Thus, catalytic NADH-GDH activity may play an essential role in linking carbon and nitrogen metabolism in R. albus 8.
Growth of R. albus 8 on urea showed transcript abundances and activity patterns similar to those for growth on ammonia, with the exception of urease activity. In late log phase, urease, NADH-GDH, and NADPH-GDH were upregulated compared with the early log phase. This likely indicates that the intracellular ammonia concentration was sufficient to allow synthesis of glutamate from ammonia generated by ureolytic activity, since NADH-GDH was also upregulated to synthesize 2-oxoglutarate.
Growth of R. albus 8 on peptides showed a different nitrogen metabolism pathway. Higher gene transcript abundance levels of gdhA, glnA, gltB, amtB, glnK, and ureC, as well as higher activities of NADH-GDH, NADPH-GDH, and urease, than those for growth on ammonia and urea were observed. Peptides are likely transported into the cell and hydrolyzed to amino acids, which can subsequently be deaminated or utilized for protein biosynthetic activity. In late log phase, NADPH-GDH was upregulated to synthesize glutamate from ammonia, suggesting that the intracellular ammonia concentration was sufficient for biosynthesis of glutamate by NADPH-GDH. However, NADH-GDH was downregulated to conserve intracellular pools of glutamate. Overall, these results suggest that when R. albus 8 is grown on peptides, most of the genes necessary for ammonia assimilation are still expressed, permitting the acquisition of other possible nitrogen sources, in addition to peptides, or indicating that peptides serve as a source of ammonia and are not utilized directly.
A bioinformatic survey of these nitrogen utilization genes in sequenced intestinal Ruminococcus spp. (Table 3) reveals a common strategy of using both the GDH and GS-GOGAT systems, in situations with high and low concentrations of ammonia, respectively. However, the NAD-dependent GDH was largely absent, identified only in the two R. albus strains examined. Both urease (ureC) and the nitrogenase iron protein (nifH) also varied by strain. Only R. albus 8 and Ruminococcus flavefaciens FD-1 were found to possess ureC; interestingly, R. albus 7, whose genome is closed, does not have the urease enzyme, nor do the human colonic isolates. While perhaps important in the bovine rumen, urease appears to be a variable trait between Ruminococcus species and strains. nifH was found in all species except Ruminococcus gnavus, Ruminococcus lactaris, and Ruminococcus bromii, though the function of this and related genes is not understood.
TABLE 3.
Comparison of nitrogen metabolism genes in sequenced genomes of intestinal Ruminococcus spp.
| Species | Strain | Status of genome sequencinga | Size of genome (Mb) | Source | NCBI GenBank accession no. | Gene IDb |
|||||||||
|---|---|---|---|---|---|---|---|---|---|---|---|---|---|---|---|
| gdh | gdhA | glnA | glnN | gltB | gltD | amtB | glnK | ureC | nifH | ||||||
| R. albus | 8 | D | 4.37 | Bovine | PRJNA62 | 647432973 | 647433087 | 647433829 | 647434426 | 647434074 | 647432807 | 647434425 | 647434425 | 647432507 | 647433732 |
| 7 | F | 4.48 | Bovine | PRJNA42255 | 649836491 | 649834164 | 649836651 | 649834281 | 650638287 | 649835534 | 649820832 | 649820832 | 649836467 | ||
| R. flavefaciens | FD-1 | P | 4.57 | Bovine | PRJNA37767 | 646114531 | 646116610, 646114105 | 646116522, 646116522, 646115913 | 646116608 | 646116609 | 646116607, 646116521 | 646116607, 646116521 | 646116518 | 646117009 | |
| R. gnavus | AGR2154 | P | 3.72 | Bovine | PRJNA214525 | 2545648646 | 2545646422 | 2545647724 | 2545646424 | 2545646423 | 2545648188 | 2545648187 | |||
| ATCC 29149 | D | 3.5 | Human | PRJNA54537 | 641051637 | 641052304 | 641052975 | 641052302 | 641052303 | 641054700 | 641054701 | ||||
| R. torques | L2-14 | F | 3.34 | Human | PRJNA39169 | 650583980 | 650584844 | 650583508 | 650583628 | 650583629 | 650582918, 650582601 | 650582918, 650582600 | 650582574, 650582581 | ||
| R. lactaris | ATCC 29176 | D | 2.73 | Human | PRJNA20557 | 642851963 | 642853782 | 642852830 | 642853951 | 642853952 | 642853842 | 642853842 | |||
| R. bromii | L2-63 | F | 2.25 | Human | PRJNA39153 | 650573052 | 650571825 | 650571824 | 650571823 | 650571826, 650572673 | 650571826, 650572674 | ||||
| R. obeum | ATCC 29174 | D | 3.62 | Human | PRJNA18147 | 641005686 | 641008011 | 641008005, 641007246 | 641008009 | 641008010 | 641008003 | 641008003 | 641004483, 641004492 | ||
F, finished; D, draft; P, permanent draft.
Joint Genomic Institute (JGI) Integrated Microbial Genomes (IMG) gene identification number(s).
The enzyme activity and gene transcription evidence presented here suggest that nitrogen metabolism genes and enzyme activities of R. albus 8 are regulated by nitrogen source and the level of ammonia in the growth medium. Enzyme activities and related gene transcript abundances identified in this study provide insight into the potential role and regulation of the nitrogen metabolism enzymes on different nitrogen sources. Further studies in R. albus 8, including whole-genome transcriptional profiling and related proteomic studies, will help to elucidate the relationship between gene transcript abundance, enzyme activity, and their regulation by different nitrogen sources, which will in turn help to further elucidate the metabolic and ecologic niche of R. albus 8 in intestinal systems.
Supplementary Material
ACKNOWLEDGMENTS
This project was supported by National Research Initiative competitive grants 2008-35206-18784 and 2012-67015-19451 from the USDA National Institute of Food and Agriculture (R.I.M. and I.K.O.C.).
We also thank Carl Yeoman for constructive feedback and helpful discussions during the preparation of the manuscript.
Footnotes
Published ahead of print 7 March 2014
Supplemental material for this article may be found at http://dx.doi.org/10.1128/AEM.00029-14.
REFERENCES
- 1.Cotta MA, Russell JB. 1997. Digestion of nitrogen in the rumen: a model for metabolism of nitrogen compounds in gastrointestinal environments, p 380–423 In Mackie RI, White BA. (ed), Gastrointestinal microbiology, vol 1 Springer, New York, NY [Google Scholar]
- 2.Morrison M, Mackie RI. 1997. Biosynthesis of nitrogen-containing compounds, p 424–469 In Mackie RI, White BA. (ed), Gastrointestinal microbiology, vol 1 Springer, New York, NY [Google Scholar]
- 3.Wallace RJ, Onodera R, Cotta MA. 1997. Metabolism of nitrogen-containing compounds, p 283–328 In Hobson PN, Stewart CS. (ed), The rumen microbial ecosystem, 2nd ed. Blackie Academic & Professional, London, United Kingdom [Google Scholar]
- 4.Mackie RI, White BA. 1990. Recent advances in rumen microbial ecology and metabolism: potential impact on nutrient output. J. Dairy Sci. 73:2971–2995. 10.3168/jds.S0022-0302(90)78986-2 [DOI] [PubMed] [Google Scholar]
- 5.Merrick MJ, Edwards RA. 1995. Nitrogen control in bacteria. Microbiol. Rev. 59:604–622 [DOI] [PMC free article] [PubMed] [Google Scholar]
- 6.Amon J, Titgemeyer F, Burkovski A. 2010. Common patterns—unique features: nitrogen metabolism and regulation in Gram-positive bacteria. FEMS Microbiol. Lett. 34:588–605. 10.1111/j.1574-6976.2010.00216.x [DOI] [PubMed] [Google Scholar]
- 7.Fisher SH, Sonenshein AL. 1991. Control of carbon and nitrogen metabolism in Bacillus subtilis. Annu. Rev. Microbiol. 45:107–135. 10.1146/annurev.mi.45.100191.000543 [DOI] [PubMed] [Google Scholar]
- 8.Lehninger AL, Nelson DL, Cox MM. 2005. Biosynthesis of amino acids, nucleotides, and related molecules, p 833–880 In Lehninger principles of biochemistry, 4th ed. W H Freeman, New York, NY [Google Scholar]
- 9.Reitzer L. 2003. Nitrogen assimilation and global regulation in Escherichia coli. Annu. Rev. Microbiol. 57:155–176. 10.1146/annurev.micro.57.030502.090820 [DOI] [PubMed] [Google Scholar]
- 10.Coutts G, Thomas G, Blakey D, Merrick M. 2002. Membrane sequestration of the signal transduction protein GlnK by the ammonium transporter AmtB. EMBO J. 21:536–545. 10.1093/emboj/21.4.536 [DOI] [PMC free article] [PubMed] [Google Scholar]
- 11.Mobley HL, Hausinger RP. 1989. Microbial ureases: significance, regulation, and molecular characterization. Microbiol. Rev. 53:85–108 [DOI] [PMC free article] [PubMed] [Google Scholar]
- 12.Stewart CS, Flint HJ, Bryant MP. 1997. The rumen bacteria, p 10–72 In Hobson PN, Stewart CS. (ed), The rumen microbial ecosystem, 2nd ed. Blackie Academic & Professional, London, United Kingdom [Google Scholar]
- 13.Wozny MA, Bryant MP, Holdeman LV, Moore WE. 1977. Urease assay and urease-producing species of anaerobes in the bovine rumen and human feces. Appl. Environ. Microbiol. 33:1097–1104 [DOI] [PMC free article] [PubMed] [Google Scholar]
- 14.Amaya KR, Kocherginskaya SA, Mackie RI, Cann IK. 2005. Biochemical and mutational analysis of glutamine synthetase type III from the rumen anaerobe Ruminococcus albus 8. J. Bacteriol. 187:7481–7491. 10.1128/JB.187.21.7481-7491.2005 [DOI] [PMC free article] [PubMed] [Google Scholar]
- 15.Chaney AL, Marbach EP. 1962. Modified reagents for determination of urea and ammonia. Clin. Chem. 8:130–132 [PubMed] [Google Scholar]
- 16.Griswold KE, Mackie RI. 1997. Degradation of protein and utilization of the hydrolytic products by a predominant ruminal bacterium, Prevotella ruminicola B14. J. Dairy Sci. 80:160–175. 10.3168/jds.S0022-0302(97)75924-1 [DOI] [PubMed] [Google Scholar]
- 17.Jones DL, Owen AG, Farrar JF. 2002. Simple method to enable the high resolution determination of total free amino acids in soil solutions and soil extracts. Soil Biol. Biochem. 34:1893–1902. 10.1016/S0038-0717(02)00203-1 [DOI] [Google Scholar]
- 18.Moore S, Stein WH. 1954. A modified ninhydrin reagent for the photometric determination of amino acids and related compounds. J. Biol. Chem. 211:907–913 [PubMed] [Google Scholar]
- 19.Neyrolles O, Ferris S, Behbahani N, Montagnier L, Blanchard A. 1996. Organization of Ureaplasma urealyticum urease gene cluster and expression in a suppressor strain of Escherichia coli. J. Bacteriol. 178:647–655 [DOI] [PMC free article] [PubMed] [Google Scholar]
- 20.Bionaz M, Loor JJ. 2007. Identification of reference genes for quantitative real-time PCR in the bovine mammary gland during the lactation cycle. Physiol. Genomics 29:312–319. 10.1152/physiolgenomics.00223.2006 [DOI] [PubMed] [Google Scholar]
- 21.Vandesompele J, Preter KD, Pattyn F, Poppe B, Roy NV, Paepe AD, Speleman F. 2002. Accurate normalization of real-time quantitative RT-PCR data by geometric averaging of multiple internal control genes. Genome Biol. 3:RESEARCH0034. 10.1186/gb-2002-3-7-research0034 [DOI] [PMC free article] [PubMed] [Google Scholar]
- 22.Abrahams GL, Abratt VR. 1998. The NADH-dependent glutamate dehydrogenase enzyme of Bacteroides fragilis Bf1 is induced by peptides in the growth medium. Microbiology 144:1659–1667. 10.1099/00221287-144-6-1659 [DOI] [PubMed] [Google Scholar]
- 23.Duncan PA, White BA, Mackie RI. 1992. Purification and properties of NADP-dependent glutamate dehydrogenase from Ruminococcus flavefaciens FD-1. Appl. Environ. Microbiol. 58:4032–4037 [DOI] [PMC free article] [PubMed] [Google Scholar]
- 24.Smith CJ, Hespell RB, Bryant MP. 1980. Ammonia assimilation and glutamate formation in the anaerobe Selenomonas ruminantium. J. Bacteriol. 141:593–602 [DOI] [PMC free article] [PubMed] [Google Scholar]
- 25.Wen Z, Morrison M. 1997. Glutamate dehydrogenase activity profiles for type strains of ruminal Prevotella spp. Appl. Environ. Microbiol. 63:3314–3317 [DOI] [PMC free article] [PubMed] [Google Scholar]
- 26.Bender RA, Janssen KA, Resnick AD, Blumenberg M, Foor F, Magasanik B. 1977. Biochemical parameters of glutamine synthetase from Klebsiella aerogenes. J. Bacteriol. 129:1001–1009 [DOI] [PMC free article] [PubMed] [Google Scholar]
- 27.Gawronski JD, Benson DR. 2004. Microtiter assay for glutamine synthetase biosynthetic activity using inorganic phosphate detection. Anal. Biochem. 327:114–118. 10.1016/j.ab.2003.12.024 [DOI] [PubMed] [Google Scholar]
- 28.Gonzalez-Romo P, Sanchez-Nieto S, Gavilanes-Ruiz M. 1992. A modified colorimetric method for the determination of orthophosphate in the presence of high ATP concentrations. Anal. Biochem. 200:235–238. 10.1016/0003-2697(92)90458-J [DOI] [PubMed] [Google Scholar]
- 29.Meers JL, Tempest DW, Brown CM. 1970. ‘Glutamine(amide):2-oxoglutarate amino transferase oxido-reductase (NADP)', an enzyme involved in the synthesis of glutamate by some bacteria. J. Gen. Microbiol. 64:187–194. 10.1099/00221287-64-2-187 [DOI] [PubMed] [Google Scholar]
- 30.Clemens DL, Lee BY, Horwitz MA. 1995. Purification, characterization, and genetic analysis of Mycobacterium tuberculosis urease, a potentially critical determinant of host-pathogen interaction. J. Bacteriol. 177:5644–5652 [DOI] [PMC free article] [PubMed] [Google Scholar]
- 31.Clarke RK, Gorley RN. 2006. Primer V6: user manual—tutorial. Primer-E, Plymouth, United Kingdom [Google Scholar]
- 32.Krause DO, Dalrymple BP, Smith WJ, Mackie RI, McSweeney CS. 1999. 16S rDNA sequencing of Ruminococcus albus and Ruminococcus flavefaciens: design of a signature probe and its application in adult sheep. Microbiology 145:1797–1807. 10.1099/13500872-145-7-1797 [DOI] [PubMed] [Google Scholar]
- 33.Bryant MP, Robinson IM. 1961. Studies on the nitrogen requirements of some ruminal cellulolytic bacteria. Appl. Microbiol. 9:96–103 [DOI] [PMC free article] [PubMed] [Google Scholar]
- 34.Wen Z, Morrison M. 1996. The NAD(P)H-dependent glutamate dehydrogenase activities of Prevotella ruminicola B14 can be attributed to one enzyme (GdhA), and gdhA expression is regulated in response to the nitrogen source available for growth. Appl. Environ. Microbiol. 62:3826–3833 [DOI] [PMC free article] [PubMed] [Google Scholar]
- 35.Magasanik B. 1982. Genetic control of nitrogen assimilation in bacteria. Annu. Rev. Genet. 16:135–168. 10.1146/annurev.ge.16.120182.001031 [DOI] [PubMed] [Google Scholar]
- 36.Reyes JC, Muro-Pastor MI, Florencio FJ. 1997. Transcription of glutamine synthetase genes (glnA and glnN) from the cyanobacterium Synechocystis sp. strain PCC 6803 is differently regulated in response to nitrogen availability. J. Bacteriol. 179:2678–2689 [DOI] [PMC free article] [PubMed] [Google Scholar]
- 37.Kim JN, Cann IK, Mackie RI. 2012. Purification, characterization, and expression of multiple glutamine synthetases from Prevotella ruminicola 23. J. Bacteriol. 194:176–184. 10.1128/JB.05916-11 [DOI] [PMC free article] [PubMed] [Google Scholar]
- 38.Liu Q, Bender RA. 2007. Complex regulation of urease formation from the two promoters of the ure operon of Klebsiella pneumoniae. J. Bacteriol. 189:7593–7599. 10.1128/JB.01096-06 [DOI] [PMC free article] [PubMed] [Google Scholar]
- 39.Nolden L, Beckers G, Mockel B, Pfefferle W, Nampoothiri KM, Kramera R, Burkovskia A. 2000. Urease of Corynebacterium glutamicum: organization of corresponding genes and investigation of activity. FEMS Microbiol. Lett. 189:305–310. 10.1111/j.1574-6968.2000.tb09248.x [DOI] [PubMed] [Google Scholar]
- 40.Allison MJ. 1970. Nitrogen metabolism of ruminal microorganisms, p 456–473 In Phillipson AT. (ed), Physiology of digestion and metabolism in the ruminant. Oriel Press, Cambridge, United Kingdom [Google Scholar]
- 41.Kessler PS, Daniel C, Leigh JA. 2001. Ammonia switch-off of nitrogen fixation in the methanogenic archaeon Methanococcus maripaludis: mechanistic features and requirement for the novel GlnB homologues, NifI1 and NifI2. J. Bacteriol. 183:882–889. 10.1128/JB.183.3.882-889.2001 [DOI] [PMC free article] [PubMed] [Google Scholar]
- 42.Vintila S, El-Shehawy R. 2007. Ammonium ions inhibit nitrogen fixation but do not affect heterocyst frequency in the bloom-forming cyanobacterium Nodularia spumigena strain AV1. Microbiology 153:3704–3712. 10.1099/mic.0.2007/007849-0 [DOI] [PubMed] [Google Scholar]
Associated Data
This section collects any data citations, data availability statements, or supplementary materials included in this article.