

Abstract
Insulin signaling in osteoblasts regulates global energy balance by stimulating the production of osteocalcin, a bone-derived protein that promotes insulin production and action. To identify the signaling pathways in osteoblasts that mediate insulin's effects on bone and energy metabolism, we examined the function of the tuberous sclerosis 2 (Tsc2) protein, a key target important in coordinating nutrient signaling. Here, we show that loss of Tsc2 in osteoblasts constitutively activates mTOR and destabilizes Irs1, causing osteoblasts to differentiate poorly and become resistant to insulin. Young Tsc2 mutant mice demonstrate hypoglycemia with increased levels of insulin and undercarboxylated osteocalcin. However, with age, Tsc2 mutants develop metabolic features similar to mice lacking the insulin receptor in the osteoblast, including peripheral adiposity, hyperglycemia, and decreased pancreatic β cell mass. These metabolic abnormalities appear to result from chronic elevations in undercarboxylated osteocalcin that lead to downregulation of the osteocalcin receptor and desensitization of the β cell to this hormone. Removal of a single mTOR allele from the Tsc2 mutant mice largely normalizes the bone and metabolic abnormalities. Together, these findings suggest that Tsc2 serves as a key checkpoint in the osteoblast that is required for proper insulin signaling and acts to ensure normal bone acquisition and energy homeostasis.
INTRODUCTION
The formation, remodeling, and repair of the skeleton are performed by osteoblasts, osteoclasts, and osteocytes through a process that is increasingly recognized as energetically expensive (1). To coordinate bone formation and remodeling, bone cell activity is regulated by intricate networks of local factors and systemic hormones. In turn, bone cells secrete factors that communicate with other tissues to ensure homeostatic regulation of global energy utilization (2, 3). For example, the adipocyte-derived hormone leptin influences appetite and energy expenditure (4) and also regulates postnatal bone acquisition (5, 6). In addition, osteoblasts and osteocytes produce and secrete hormones, including osteocalcin, which enhances insulin secretion and peripheral insulin sensitivity (7).
Recent studies (8, 9) have demonstrated that insulin signaling in osteoblasts is required for normal bone acquisition and the coordination of whole-body glucose metabolism. Osteoblasts lacking the insulin receptor fail to differentiate normally, which results in reduced postnatal bone acquisition. In addition, loss of insulin signaling in osteoblasts inhibits osteocalcin production via increased activity of FoxO1, a suppressor of osteocalcin gene transcription (10, 11). Thus, the metabolic abnormalities in mice lacking the insulin receptor in osteoblasts can be partially reversed by infusing mice with undercarboxylated osteocalcin (ucOCN) (8), strongly suggesting the existence of an osteoblast-pancreas endocrine loop in which bone production of ucOCN ensures appropriate insulin production in a feed-forward loop.
Many of the physiological responses induced by insulin are mediated by phosphatidylinositol 3-kinase (PI3K) signaling via Akt (12), including the activation of the conserved Ser/Thr kinase mTOR, known to regulate cell growth and nutrient metabolism (13). Akt indirectly activates mTOR by targeting a heterodimer complex composed of Tsc1 and Tsc2. The Tsc2 protein contains a GTPase-activating protein (GAP) domain that has GAP activity toward the small G protein Rheb (Ras homolog enriched in brain) (14, 15). Phosphorylation of Tsc2 by Akt diminishes its inhibitory activity (16, 17) and allows the GTP-bound form of Rheb to activate mTOR and its downstream targets, such as the ribosomal S6 kinase and eukaryotic initiation factor 4E-binding protein (eIF-4BP). Therefore, the Tsc complex represents a key control point in the conduction of insulin-generated signals in target cells.
In this study, we used a genetic approach in mice to examine the role of Tsc2 in the performance and metabolic actions of osteoblasts. We found that loss of Tsc2 in osteoblasts results in constitutive mTOR activity, which causes the accumulation of disorganized bone produced by excessive numbers of osteoblasts. Young Tsc2 mutant mice demonstrate hypoglycemia with elevated serum insulin levels and have elevated levels of undercarboxylated osteocalcin, a metabolic profile opposite that of mice lacking the insulin receptor (IR) in osteoblasts. With age, mice lacking Tsc2 in osteoblasts develop glucose intolerance, with increased peripheral adiposity and other metabolic disturbances that appear to result from desensitization to chronic elevations in serum osteocalcin. Our findings suggest a model in which the Tsc2 signaling complex serves as a checkpoint that restrains insulin signaling to mTOR in an attempt to control normal osteoblast development and glucose homeostasis.
MATERIALS AND METHODS
Animal models.
The Institutional Animal Care and Use Committee of the Johns Hopkins University approved all procedures involving mice. Tsc2 and mTOR were disrupted in the osteoblast by crossing Tsc2flox/flox mice (18) or mTORflox/flox mice (19) with osteocalcin-Cre (OC-Cre) transgenic mice (20). Tsc2flox/flox mice were backcrossed on to a C57BL/6 background for 8 generations prior to use. The background of both mTORflox/flox and OC-Cre mice is C57BL/6. Genotyping primers are shown in Table S1 in the supplemental material. Specificity of recombination was assessed using a PCR-based strategy and primer pairs that flanked the floxed allele.
Imaging and histomorphometry.
Male control and transgenic mice were sacrificed at the age indicated below, and bone volume was assessed using a desktop micro-tomographic imaging system (Skyscan 1172; Skyscan). Histological analyses using a semiautomatic method (Osteoplan II; Kontron) were carried out on 6-week-old mice injected with 1% (wt/vol) calcein 5 and 3 days prior to sacrifice (20). All analyses of bone structure were completed in accordance with the recommendations of the American Society for Bone and Mineral Research (21–23). Pancreata were fixed and stained, and islet morphometry was assessed as previously described (24). Immunostaining of skeletal tissue was carried out according to standard techniques using antibodies specific for p70 S6K (Cell Signaling; 2708), Runx2 (Santa Cruz; sc-10758), and Osterix (Santa Cruz; sc-133871), as well as appropriate secondary antibodies from Life Technologies.
Cell culture studies.
Osteoblasts were isolated from calvaria of newborn mice by serial digestion in 1.8 mg/ml of collagenase. For in vitro gene deletion, osteoblasts containing floxed alleles were infected with adenovirus encoding Cre recombinase or green fluorescent protein (Vector Biolabs) as previously described (25). Infection with a multiplicity of infection (MOI) of 100 was used in all experiments, with gene deletion being confirmed by PCR and immunoblotting. Osteoblast proliferation was assessed by flow cytometry after staining bromodeoxyuridine (BrdU)-labeled cells (10 μM; BD Biosciences) with anti-BrdU-allophycocyanin (APC) and 7-amino-actinomycin D. Protein synthesis (Click-iT AHA Protein Synthesis; Life Technologies) and caspase activity (Promega) were assessed using commercially available kits according to the manufacturers' recommendations. Osteoblast differentiation was induced by supplementing minimal essential medium, alpha modification (αMEM), with 10% serum, 10 mM β-glycerol phosphate, and 50 μg/ml of ascorbic acid. Alkaline phosphatase and alizarin red S staining were carried out according to standard techniques. Min6 cells were cultured according to standard techniques. Primary β cells were isolated by collagenase digestion and gradient centrifugation (24).
Gene expression studies.
Total RNA was extracted using TRIzol (Life Technologies), reverse transcribed using an iScript cDNA synthesis kit (Bio-Rad), and amplified by real-time PCR using SYBR green PCR master mix (Bio-Rad). Reactions were normalized to actin levels. Primer sequences are shown in Table S1 in the supplemental material and were obtained from PrimerBank (http://pga.mgh.harvard.edu/primerbank/index.html). Antibodies used in immunoblotting studies were obtained from Cell Signaling Technologies or Abcam. Osteoblasts were treated with insulin after being starved of serum overnight. SP600125 and rapamycin (Sigma-Aldrich) were replaced with medium changes during differentiation studies. Chromatin immunoprecipitation (ChIP) assays were performed using a commercially available kit (Pierce) and a FoxO1 antibody from Santa Cruz Biotechnology, Inc. (H-128) (10). Precipitated DNA was amplified using SYBR green PCR master mix and normalized to reactions using input DNA as a template.
Metabolic studies and bioassays.
Serum calcium was assessed using calcium-arsenazo methods (Alfa Wasserman), while serum phosphorus measurements were performed using the phosphomolybdate-malachite green method (Biovision). Blood glucose was measured using a OneTouch Ultra handheld glucose monitor (LifeScan), while serum insulin levels were determined by enzyme-linked immunosorbent assay (ELISA) (Alpco). For glucose tolerance tests (GTTs), glucose (2 g/kg of body weight [BW]) was injected intraperitoneally (i.p.) after an overnight fast. For insulin tolerance tests (ITTs), mice were fasted for 4 h and then injected i.p. with insulin (0.2 U/kg of BW). Serum C-telopeptide (CTX; Immunodiagnostik) and serum osteoprotegerin (OPG; R&D Systems) levels were determined by ELISA. A previously described triple ELISA-based system was used to determine the concentrations of carboxylated and undercarboxylated osteocalcin in serum (26).
Statistics.
All results are presented as means ± standard errors of the means. Analyses of area under the curve were performed using Prism (GraphPad). Statistical analyses were performed using unpaired, two-tailed Student's t tests. A P value of less than 0.05 was considered significant.
RESULTS
Tsc2-deficient osteoblasts produce disorganized bone.
Insulin receptor activation in target cells converges on the Tsc-mTOR signaling complex, which serves to coordinate many of the hormone's biological responses. To begin to characterize the role of this pathway in regulating bone formation and energy metabolism, we generated mice in which Tsc2 was selectively disrupted in the osteoblast. Male progeny from matings between OC-CreTG/+ Tsc2flox/flox and Tsc2flox/flox mice (18) with the genotype OC-CreTG/+ Tsc2flox/flox (hereafter referred to as ΔTsc2 mice) were selected for detailed analysis. Male Tsc2flox/flox littermates served as controls. ΔTsc2 mice were born at the expected Mendelian frequency and had a 55% reduction in Tsc2 mRNA levels in bone tissue relative to controls (data not shown), and allele-specific PCR confirmed that recombination of Tsc2 alleles occurred only in skeletal tissue (i.e., calvaria and femur) (Fig. 1A). Immunohistochemical staining revealed an increase in the phosphorylation levels of S6 kinase (S6K1), indicating that mTOR activity was indeed increased by this genetic manipulation (Fig. 1B).
FIG 1.

Tsc2 regulates postnatal bone acquisition. (A) PCR analysis of Tsc2 allele recombination in tissues from Oc-CreTG/+ Tsc2flox/flox (ΔTsc2) mice. (B) Immunohistochemical staining for phospho-S6K in cortical bones of 3-week-old control and ΔTsc2 mice (B, bone; Mu, muscle; Peri., periosteum). (C to G) Quantitative micro-computed tomographic (micro-CT) analysis of trabecular bone structure in the distal femurs of control and ΔTsc2 mice at 3, 6, 12, and 24 weeks of age (n = 4 to 6 mice). (C) Representative images. (D) Bone volume/tissue volume. (E) Trabecular number (Tb. N)/mm. (F) Trabecular thickness (Tb. Th). (G) Trabecular spacing (Tb. Sp). *, P < 0.05. (H) Representative micro-CT images of cortical bone structure at the femoral middiaphysis in control and ΔTsc2 mice at 3, 6, 12, and 24 weeks of age. (I) Representative micro-CT images from the calvarial bones of control and ΔTsc2 mice at 24 weeks of age. (J) Representative hematoxylin-and-eosin-stained cortical bone sections from control (a) and ΔTsc2 (b) mice at 3 weeks of age. Original magnification, ×20. (K and L) Immunohistochemical staining for osterix (K) and Runx2 (L) in cortical bones of 3-week-old control and ΔTsc2 mice (Ma, marrow). Arrows highlight staining in cortical bone.
ΔTsc2 mice exhibited a progressive increase in postnatal bone acquisition. While trabecular bone volume peaked at 12 weeks of age in the femur of controls, ΔTsc2 mice continued to accumulate trabecular bone with bone volume/tissue volume (BV/TV) exceeding 75% at 24 weeks of age (Fig. 1C to G). Similar increases in bone volume were evident in the cortical bone envelope (Fig. 1H) and calvarial bones of the skull (Fig. 1I), without effects on serum calcium or phosphate levels (Table 1). Female ΔTsc2 mice also exhibited an increase in measures of trabecular and cortical bone architecture (data not shown).
TABLE 1.
Histomorphometry and serum measurementsa
| Parameter | Value for mice |
|
|---|---|---|
| Control | ΔTsc2 | |
| Bone structure | ||
| Bone length (mm) | 13.56 ± 0.19 | 13.89 ± 0.27 |
| Growth plate thickness (μm) | 85.73 ± 4.35 | 85.87 ± 4.58 |
| Bone formation | ||
| Osteoid vol/bone vol (%) | 2.22 ± 0.46 | 4.61 ± 1.53 |
| Osteoid surface/bone surface (%) | 12.38 ± 1.74 | 22.88 ± 4.84* |
| Osteoid thickness (μm) | 2.26 ± 0.16 | 2.98 ± 0.57 |
| Osteoblast surface/bone surface (%) | 6.04 ± 1.01 | 16.27 ± 3.77* |
| Osteoblast no./bone perimeter (no./100 mm) | 618 ± 102 | 1,355 ± 263* |
| Bone erosion | ||
| Erosion surface/bone surface (%) | 5.51 ± 0.96 | 4.06 ± 0.67 |
| Erosion depth (μm) | 6.38 ± 0.36 | 6.29 ± 0.86 |
| Osteoclast surface (%) | 4.75 ± 0.83 | 3.67 ± 0.63 |
| Osteoclast no./bone perimeter (no./100 mm) | 203 ± 32 | 156 ± 27 |
| Bone dynamics | ||
| Mineral apposition rate (μm/day) | 2.36 ± 0.32 | 2.91 ± 0.42 |
| Mineralizing surface/bone surface (%) | 11.57 ± 1.75 | 20.99 ± 4.68* |
| Bone formation rate/bone surface (mm3/cm2/yr) | 11.35 ± 2.88 | 29.45 ± 10.92* |
| Mineralization lag time (days) | 1.74 ± 0.39 | 1.41 ± 0.23 |
| Serology | ||
| Calcium (mg/dl) | 9.74 ± 0.25 | 9.68 ± 0.09 |
| Phosphorus (mg/dl) | 10.13 ± 1.52 | 10.18 ± 0.33 |
| CTX (ng/ml) | 41.08 ± 1.43 | 32.84 ± 1.42* |
| OPG (pg/ml) | 2,789 ± 132 | 3,749 ± 240* |
Values are shown as means ± standard errors. *, P < 0.05.
To define the cellular basis for this phenotype, static and dynamic histomorphometric analyses were performed in the trabecular bone compartment of 6-week-old mice (Table 1). Dramatic increases in osteoblast numbers per bone perimeter (Ob.N/BPM) and mineralizing surface per bone surface (MS/BS) in the mutant mice relative to controls led to an overall increase in the bone formation rate (BFR/BS). However, the increased osteoid surface (OS/BS) in the mutant mice together with a mineral apposition rate (MAR) that was similar to that of control mice suggests that the performance of individual osteoblasts in the mutant mice is impaired. In support of this idea, histological examination of decalcified samples from cortical bone revealed layers of mesenchymal cells lining the periosteal surface and embedded within the bone matrix of the mutant mice (Fig. 1J). These cells stained positively for osterix and Runx2, indicating their position along the osteoblast lineage (Fig. 1K and L).
Osteoclast numbers per bone perimeter (Table 1) tended to be decreased in the mutant mice but did not reach statistical significance. However, the levels of serum CTX, a marker of matrix degradation, revealed a modest impairment in bone resorption, perhaps as a result of increased levels of serum OPG. Taken together, these results indicate that loss of Tsc2 in osteoblasts results in the formation of sclerotic bone populated by excessive numbers of osteoblasts and a reduction in bone resorption.
Tsc2 is required for normal osteoblast differentiation.
To more closely examine the impact of Tsc2 loss of function on osteoblast differentiation, we used primary calvarial osteoblast cultures in which Tsc2 was eliminated just prior to the induction of osteoblast differentiation by infection with adeno-Cre expression vectors (8, 25). Osteoblasts lacking Tsc2 exhibited the expected activation of mTOR as indicated by increased phosphorylation of S6K1 (Fig. 2A) and enhanced protein synthesis (Fig. 2B). Proliferation was found to be impaired in Tsc2-deficient osteoblasts when assessed by BrdU incorporation (Fig. 2C), but the mutant cells exhibited lower levels of both basal and staurosporine-induced apoptosis (Fig. 2D). Established measures of osteoblast differentiation, including staining for alkaline phosphatase and calcium deposition, and the expression of genetic markers of differentiated osteoblasts, including Runx2, osterix, and collagen I, were uniformly reduced in ΔTsc2 osteoblasts compared to controls (Fig. 2E and F). RankL levels were normal, but consistent with the reduction in osteoclast activity and increased serum OPG in vivo, expression of OPG mRNA levels were increased in the mutant osteoblasts compared to controls (Fig. 2G).
FIG 2.

Tsc2 deficiency impairs osteoblast differentiation. (A) Western blot analysis of Tsc2 expression in primary osteoblasts isolated from Tsc2flox/flox mice after infection with adenovirus expressing Cre (ΔTsc2) or green fluorescent protein (GFP) (Con) as a control. S6K1 phosphorylation was used as a marker of mTOR activation. (B) Quantification of protein synthesis in control and ΔTsc2 osteoblasts. Results are expressed as percentage of control osteoblasts. (C) Quantification of osteoblast proliferation by BrdU incorporation in control and ΔTsc2 osteoblasts. (D) Quantification of osteoblast apoptosis via caspase-3 activity in control and ΔTsc2 osteoblasts treated with vehicle (NT) or 8 ng/ml of staurosporine. Results are expressed as percentage of vehicle-treated control osteoblasts. (E to G) Examination of osteoblast differentiation after the deletion of Tsc2. (E) Alkaline phosphatase (ALP) and alizarin red (ARS) staining after 14 days of differentiation. (F) Quantitative PCR (qPCR) analysis of Runx2, osterix (Osx), Atf4, type I collagen (ColI), Twist1, and Twist2 expression after 14 days of differentiation. (G) qPCR analysis of RankL and Opg expression after 14 days of differentiation. (H) Western blot analysis of insulin-stimulated (10 nM for 15 min) Akt phosphorylation and Irs1 levels in control and ΔTsc2 osteoblasts. (I) qPCR analysis of Irs1 expression in control and ΔTsc2 osteoblasts. (J) Irs1 protein levels in control and ΔTsc2 osteoblasts cultured in the presence of cycloheximide (100 μg/ml). (K) Western blot analysis of eIF-2α, Perk, and Jnk phosphorylation status in control and ΔTsc2 osteoblasts. (L) qPCR analysis of Chop and BiP expression in control and ΔTsc2 osteoblasts. (M) Western blot analysis of Irs1 protein expression and insulin-stimulated Akt phosphorylation in control and ΔTsc2 cells and ΔTsc2 cells treated with SP600125 (Jnk inhibitor; 10 μM) for 24 h. (N) qPCR analysis of Tsc2, Runx2, and osterix (Osx) expression after 14 days of differentiation in control and ΔTsc2 cells and ΔTsc2 osteoblasts treated with SP600125. (O) Alizarin red staining of cultures of control and ΔTsc2 osteoblasts after 14 days of differentiation in the presence of the indicated concentration of rapamycin. (P) Alizarin red staining of cultures of control osteoblasts differentiated for 7 days in the presence of 0 or 10 nM rapamycin. *, P < 0.05.
Impaired osteoblast differentiation coupled with increased expression of the Runx2 transcriptional inhibitors Twist1 and Twist2 (27) (Fig. 2F) was reminiscent of the phenotype observed in osteoblasts lacking the insulin receptor (8). Indeed, insulin-stimulated Akt phosphorylation was markedly reduced in osteoblasts rendered deficient for Tsc2 and was associated with a reduction in Irs1 protein abundance (Fig. 2H). The diminished Irs1 levels were due not to a decrease in mRNA expression (Fig. 2I) but rather to an acceleration of protein turnover (Fig. 2J). Consistent with other models of Tsc1 and Tsc2 deficiency (28–30), ΔTsc2 osteoblasts displayed features of an endoplasmic reticulum (ER) stress response, including marked increases in the phosphorylation of eIF-2α, Perk, and Jnk (Fig. 2K) and expression of Chop and BiP (Fig. 2L). Application of SP600125, a synthetic inhibitor of Jnk and also of S6K1 (31), to inhibit this pathway and prevent the targeting of Irs1 for degradation (32, 33) normalized Irs-1 protein levels (Fig. 2M), restored insulin sensitivity as determined by the phosphorylation of Akt, and dramatically improved the ability of Tsc2-deficient osteoblasts to differentiate in vitro (Fig. 2N). Similarly, treating cultures of ΔTsc2 osteoblasts with low doses of rapamycin (0.01 nM and 0.1 nM) improved matrix mineralization (Fig. 2O), even though higher concentrations (10 nM) impaired mineralization of control osteoblasts (Fig. 2P). Overall, these data suggest that detrimentally high levels of mTOR signaling in Tsc2-deficient osteoblasts lead to the downregulation of Irs1, causing osteoblasts to become resistant to insulin, differentiate poorly, and produce disorganized bone.
Loss of Tsc2 in osteoblasts impairs glucose metabolism.
As reviewed above, mice lacking insulin receptors in osteoblasts develop hyperglycemia, insulin resistance, and peripheral adiposity (8, 9). In this study, the loss of Tsc2 function in osteoblasts resulted in similar changes in metabolism. ΔTsc2 mice exhibited a progressive increase in total body weight relative to controls that was first evident at 5 weeks of age (Fig. 3A). While this increase in body weight may partially result from the dramatic increases in bone volume, gonadal fat pad weights were increased 26% in Tsc2 mutants at 6 weeks of age and were enlarged further at 12 weeks of age (Fig. 3B). We suspected that like in osteoblast-specific insulin receptor mutants, this increase in peripheral adiposity was secondary to altered glucose metabolism. Indeed, ΔTsc2 mice were hyperglycemic in both the fed and fasted states (Fig. 3C and D), and this phenotype was accompanied by a decrease in serum insulin levels (Fig. 3E).
FIG 3.

ΔTsc2 mice have increased peripheral adiposity and altered glucose metabolism. (A) Body weight of control and ΔTsc2 mice (n = 8 to 11). (B) Gonadal fat pad mass at 6 and 12 weeks of age (n = 4 to 6 mice). (C) Measurements of random fed glucose at 6 and 12 weeks of age (n = 5 to 8 mice). (D) Measurements of fasting glucose at 6 and 12 weeks of age (n = 5 to 8 mice). (E) Serum insulin levels at 6 and 12 weeks of age (n = 4 to 6 mice). (F) Glucose tolerance test after fasting overnight at 6 weeks (n = 5 to 8 mice). (G) Insulin tolerance testing after fasting 4 h at 6 weeks (n = 5 or 6 mice). (H) Analysis of area under the curve for GTT and ITT at 6 weeks of age. (I) Glucose tolerance testing after fasting overnight at 12 weeks (n = 5 to 8 mice). (J) Insulin tolerance testing after fasting for 4 h at 12 weeks (n = 5 or 6 mice). (K) Analysis of area under the curve for GTT and ITT at 12 weeks of age. (L) Glucose-stimulated insulin secretion test after fasting overnight at 12 weeks of age (n = 4 or 5 mice). (M to O) Histomorphometric analysis of pancreatic β cells in control and ΔTsc2 mice (n = 5 mice). (M) Representative images of islets stained for insulin and with 4′,6-diamidino-2-phenylindole (DAPI). (N) β cell area (percentage of tissue area). (O) β cell mass. (P) qPCR analysis of Ins1 and Ins2 expression in pancreas (n = 4 mice). (Q) qPCR analysis of Pparg and Ucp1 expression in white adipose (WAT) and brown adipose (BAT) tissue (n = 5 mice). (R) qPCR analysis of Pck1, Pdk4, and Gck expression in liver (n = 5 mice). *, P < 0.05.
This phenotype appeared to result from an impairment in glucose-stimulated insulin secretion, as the mutant mice exhibited a reduction in glucose tolerance (Fig. 3F and H) that further deteriorated with age (12 weeks [Fig. 3I and K]), while peripheral insulin action, assessed by ITT, was enhanced in young mice (6 weeks [Fig. 3G]) and later normalized (12 weeks [Fig. 3J]). In accordance with this idea, the ΔTsc2 mice showed blunted glucose-stimulated insulin secretion compared to that in controls (Fig. 3L) and reductions in β cell area (Fig. 3M and N), β cell mass (Fig. 3O), and pancreatic expression of Ins1 and Ins2 (Fig. 3P). Moreover, markers of insulin signaling in white adipose (Pparg), brown adipose (Ucp1), and liver were altered in the mutant mice (Fig. 3Q and R). Most notably, expression of Pck1, an insulin target gene involved in gluconeogenesis (34), was increased in the liver of ΔTsc2 mice relative to controls, while the expression of Pdk4 and Gck, insulin targets involved in glycolysis (35, 36), were reduced (Fig. 3R). Thus, loss of Tsc2 in osteoblasts leads to increased peripheral adiposity in association with glucose intolerance and reduced insulin production.
Tsc2 modulates osteocalcin production.
Because insulin signaling in osteoblasts enhances both the production and bioavailability of the bone-derived hormone osteocalcin (8, 9), we initially believed that the metabolic deficiencies evident in Tsc2 mutants were the result of reductions in serum ucOCN. However, serum osteocalcin levels were actually increased in Tsc2 mutant mice (Fig. 4A). Furthermore, levels of uncarboxylated OCN were increased 4.5-fold (Fig. 4B), while the levels of osteocalcin lacking carboxylation at Glu13 were increased more than 10-fold in ΔTsc2 mice compared to controls (Fig. 4C). The increased ratio of Glu13-OCN to total serum osteocalcin (data not shown) and decreased osteoclastic bone resorption (Table 1) suggest a direct effect of Tsc2 loss of function on production of undercarboxylated osteocalcin. Consistent with the increase in serum osteocalcin, Tsc2-deficient osteoblasts exhibited significantly higher levels of osteocalcin mRNA (Fig. 4D), although the expression of the osteocalcin gene was no longer responsive to insulin.
FIG 4.

Osteocalcin production is dramatically increased after Tsc2 ablation. (A) Total serum osteocalcin in 12-week-old control and ΔTsc2 mice (n = 5 to 7 mice). (B) Levels of uncarboxylated osteocalcin at 12 weeks of age (n = 5 to 7 mice). (C) Levels of undercarboxylated (Glu13) osteocalcin at 12 weeks of age (n = 5 to 7 mice). (D) qPCR analysis of osteocalcin mRNA levels after 0 or 4 days of differentiation in control and ΔTsc2 osteoblasts treated with insulin (INS) or vehicle (NT) for 6 h. (E) Western blot analysis of Atf4 expression in control and ΔTsc2 osteoblasts after 4 days of differentiation. (F) Western blot analysis of FoxO1 phosphorylation status in control and ΔTsc2 osteoblasts after 4 days of differentiation. (G) Western blot analysis of FoxO1 abundance in nuclear (Nuc) and cytoplasmic (Cyto) extracts isolated from control and ΔTsc2 osteoblasts after 4 days of differentiation. Ratios are derived from two independent experiments. (H) Quantitative chromatin immunoprecipitation analysis of FoxO1 binding to the osteocalcin gene in control and ΔTsc2 osteoblasts after 4 days of differentiation (n = 3 or 4). N.D., not detected. *, P < 0.05.
We next examined the mechanism responsible for the increased osteocalcin levels. Because Runx2 mRNA levels (Fig. 2F) were suppressed and both the mRNA (Fig. 2F) and protein (Fig. 4E) levels of Atf4 appeared normal in ΔTsc2 osteoblasts, we focused our attention on FoxO1, a transcriptional repressor of osteocalcin expression (10). Mutant osteoblasts had increased levels of FoxO1 phosphorylation (Fig. 4F) and a 33% reduction in the nuclear abundance (Fig. 4G) of this transcription factor. The reduction in the occupancy of FoxO1 at two consensus binding sites on the osteocalcin promoter in the mutant cells revealed by ChIP analysis (Fig. 4H) suggests the existence of a molecular link between Tsc-mTOR and FoxO1 activities and osteocalcin production.
To begin to explore possible explanations for the apparent discrepancy between ucOCN levels and metabolic parameters, we examined glucose metabolism in younger mice. Surprisingly, 1-week-old mutant mice exhibited signs of improved glucose handling, including reduced blood glucose levels (Fig. 5A), increased serum insulin (Fig. 5B), and increased expression of Ins1 and Ins2 in the pancreas (Fig. 5C). Additionally, levels of uncarboxylated osteocalcin in serum were increased by 21% (Fig. 5D and E). This suggested the possibility that chronic exposure to high levels of this hormone leads to a resistance of pancreatic β cells to respond to further stimulation by osteocalcin.
FIG 5.

Osteocalcin overproduction leads to desensitization. (A) Measurements of glucose in randomly fed control and ΔTsc2 mice at 1 week of age (n = 8 to 14 mice). (B) Serum insulin levels at 1 week of age (n = 8 to 14 mice). (C) qPCR analysis of Ins1 and Ins2 expression in pancreata of 1-week-old control and ΔTsc2 mice (n = 3 to 5 mice). (D) Total serum osteocalcin in 1-week-old control and ΔTsc2 mice (n = 8 or 9 mice). (E) Levels of uncarboxylated osteocalcin at 1 week of age (n = 8 or 9 mice). (F) Osteocalcin levels in media conditioned for 48 h with control or ΔTsc2 osteoblasts after 14 days of differentiation. (G) Western blot analysis of Gpcr6a abundance in Min6 cells cultured in media conditioned with control or ΔTsc2 osteoblasts for 24 h. (H and I) qPCR analysis of Ins1 and Ins2 mRNA levels in Min6 cells treated with osteocalcin (0 to 100 ng/ml) for 6 h after culture in media conditioned with control or ΔTsc2 osteoblasts. (J) Western blot analysis of Gpcr6a abundance in primary β cells extracted from 6-week-old control and ΔTsc2 mice. (K) Densitometry analysis of Gpcr6a Western blot analysis (n = 2 or 3 mice). *, P < 0.05.
To test this idea, we cultured Min6 β cells in media conditioned with ΔTsc2 or control osteoblasts. Consistent with the increased expression of osteocalcin by the mutant osteoblasts (Fig. 4D), medium conditioned with ΔTsc2 osteoblasts contained a 2.8-fold-higher concentration of osteocalcin than medium conditioned with wild-type osteoblasts (Fig. 5F). Min6 cells cultured in the medium conditioned by the mutant cells exhibited a 37% reduction in the abundance of Gpcr6a, a putative osteocalcin receptor (37, 38), relative to those cultured in medium conditioned by control osteoblasts (Fig. 5G). Additionally, while the addition of exogenous undercarboxylated osteocalcin increased Ins1 and Ins2 mRNA expression in β cells cultured in control medium, no response was observed in cells cultured in ΔTsc2 conditioned medium (Fig. 5H and I). Finally, to determine if this downregulation of Gpcr6a expression also occurred in vivo, we collected islets from the pancreata of 6-week-old control and ΔTsc2 mice. Similar to the effect observed in vitro, Gpcr6a abundance was reduced by more than 60% in extracts prepared from the mutant mice (Fig. 5J and K). Collectively, these results are compatible with the notion that chronic exposure to high levels of OCN both in vitro and in vivo desensitizes the β cell by way of G protein-coupled receptor downregulation. Such a mechanism might therefore account, at least in part, for the loss of pancreatic responsivity and insulin production in Tsc2 mutant mice.
Removal of one mTOR allele normalizes bone and metabolic abnormalities in ΔTsc2 mice.
The results from the Tsc2 loss of function model described above imply that Tsc2 exerts its effect on bone and energy metabolism by regulating mTOR. In order to more firmly establish the linkage between Tsc2 and mTOR in these phenotypes, we created compound mutant mice in which one allele of mTOR was disrupted in the ΔTsc2 mice. As expected, trabecular bone architecture was partially normalized by this manipulation (Fig. 6A). Likewise, measures of body weight (Fig. 6B) and glucose metabolism, including glucose levels from randomly fed and starved mice (Fig. 6C), and glucose tolerance (Fig. 6D) in the compound mutants were nearly indistinguishable from those of wild-type littermates. Disruption of a single mTOR allele alone had no impact on bone volume (Fig. 6A) or glucose metabolism (data not shown), but homozygous deletion of mTOR in the osteoblasts (Fig. 6E) impaired postnatal bone acquisition in vivo (Fig. 6G to I) and osteoblast differentiation in vitro (Fig. 6J and K), without affecting body weight (Fig. 6F). These data support the notion that Tsc2 lies upstream of the mTOR pathway in osteoblasts and participates in insulin-mediated regulation of bone acquisition and insulin responses through the osteoblast.
FIG 6.

Modulation of mTOR normalizes bone and glucose metabolism in ΔTsc2 mutants. (A) Representative micro-CT images of trabecular bone structure in the distal femurs of control and mTOR and Tsc2 compound mutant mice at 12 weeks of age. (B) Body weight in control and ΔTsc2; mTOR1 mice at 12 weeks of age (8 to 11 mice). (C) Blood glucose under random feeding and fasting at 12 weeks of age (5 to 11 mice). (D) Glucose tolerance test after fasting overnight at 12 weeks (n = 7 to 11 mice). (E) PCR analysis of mTOR allele recombination in tissues of Oc-CreTG/+ mTORflox/flox (ΔmTOR) mice. (F) Body weight of control and ΔmTOR mice (n = 7 to 14 mice). (G to I) Quantitative micro-CT analysis of trabecular bone structure in the distal femurs of control and ΔmTOR mice at 12 weeks of age (n = 4 or 5 mice). (G) Representative images. (H) Bone volume/tissue volume. (I) Trabecular number/mm. (J) Western blot analysis of mTOR expression in primary osteoblasts isolated from mTORflox/flox mice after infection with adenovirus expressing Cre (ΔmTOR) or GFP (Con) as a control. (K) qPCR analysis of Runx2, osterix (Osx), and type I collagen (ColI) after 14 days of differentiation. *, P < 0.05.
DISCUSSION
In this study, we used a genetic approach in mice to define critical signaling pathways downstream of the insulin receptor that regulate osteoblast development and metabolic function. We focused on Tsc2 because of its well-established role as a central control point for the integration of signals important for growth and nutrient utilization (39–41). In addition, we reasoned that manipulating Tsc2 would afford a less complicated approach than targeting the more intricate, multisubunit mTOR complexes (42). Using this strategy, we were able to uncover the first insights into the role of Tsc-mTOR signaling in osteoblasts in vivo (Fig. 7). In particular, we provide evidence that Tsc2 serves to modulate insulin-generated signals to control osteoblast development and simultaneously regulates the production of the hormone osteocalcin.
FIG 7.
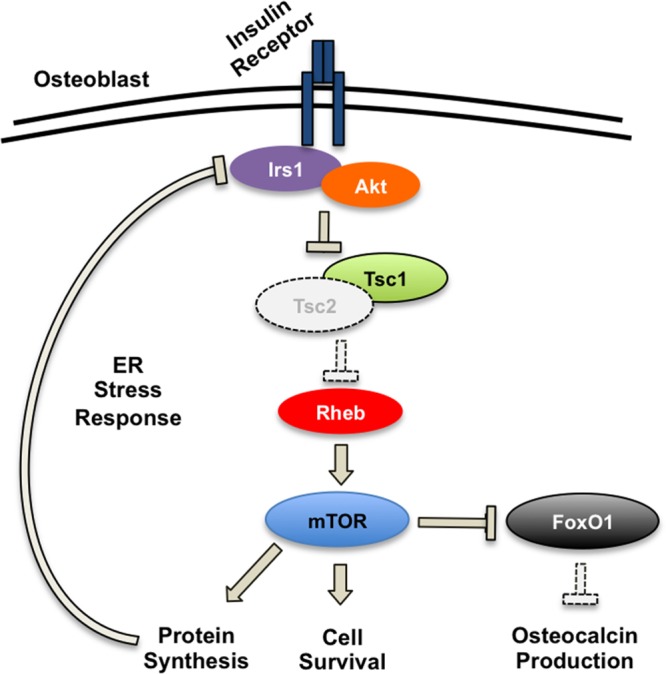
Proposed model for skeletal and metabolic phenotypes of ΔTsc2 mice. Genetic ablation of Tsc2 in osteoblasts results in unchecked mTOR signaling, which increases osteoblast survival and protein synthesis. Increased protein synthesis results in an ER stress response that downregulates Irs1 protein levels, reduces osteoblast sensitivity to insulin, and impairs osteoblast differentiation. At the same time, mTOR signaling inactivates the transcription factor FoxO1, which normally inhibits osteocalcin production. Dramatic increases in osteocalcin result in the pancreatic β cell becoming desensitized to the hormone.
As described above, Tsc2 is a GAP protein that restrains the activity of mTOR via the small GTPase Rheb (14, 15). Thus, on a superficial level, the increased number of osteoblasts in ΔTsc2 mice might seem predictable owing to the release of the brake on the proliferation and survival actions normally exerted by mTOR. Indeed, increased numbers of osteoblasts are also observed in bones from other mouse models designed to constitutively activate PI3K/Akt signaling (43). Moreover, Tsc2 acts to suppress one arm of the intracellular signaling network that is activated by insulin. Humans and animal models with defective insulin signaling frequently exhibit abnormalities in skeletal formation and repair (44–46), including a deficiency in the number of osteoblasts (8). Therefore, our data suggest that insulin uses Tsc-mTOR signaling to promote osteoblast proliferation and survival, and the dramatic increase in bone volume in ΔTsc2 mice could be viewed as a counterpoint for the failure of mice lacking the insulin receptor in osteoblasts to achieve peak bone mass (8).
Although the number of osteoblasts and the bone formation rate were increased in the ΔTsc2 mice, the function of individual osteoblasts was impaired. In the mutant mice, the mineral apposition rate was comparable to that of control mice and osteoid measures were increased, suggestive of an overall impairment in the ability of mutant osteoblasts to properly mineralize bone. While we cannot rule out potential differences in phenotype due to the onset of Cre-mediated gene deletion in vivo and our adeno-Cre based approach in vitro, our in vitro differentiation assays also revealed impaired expression of genetic markers of osteoblast differentiation and reduced mineralization. These findings together with the reduction in osteoblast apoptosis observed in vitro may help to explain the accumulation of immature osteoblastic cells in the mutant mice.
Further, the presence of immature osteoblasts, particularly those in the cortical bone compartment, may help to explain the skeletal manifestations of the tuberous sclerosis disorder in humans. While patients are diagnosed based upon a clinical triad of facial adenoma sebaceum, mental deficiencies, and convulsions, skeletal abnormalities are a common finding (47). Though generally benign, these include sclerotic bone changes that are common in the calvarium, pelvis, and long bones; periosteal new bone formation; and cyst-like lesions (48, 49). Moreover, there are striking similarities between lesions in tuberous sclerosis and fibrous dysplasia, another disorder associated with the accumulation of immature osteoblastic cells (50, 51).
Our studies suggest that the mechanism responsible for the failure of Tsc2-deficient osteoblasts to fully differentiate is due, at least in part, to the overactivation of mTOR and impaired insulin signaling that occurs indirectly via the engagement of a negative-feedback loop previously described for other cell types (28–30). In this process, unrestrained mTOR signaling initiates a cascade of events involving an increase in protein synthesis and the development of an ER stress response with increases in PERK, eIF-2α and Jnk phosphorylation. The increased activity of Jnk, in turn, impacts insulin signaling via inhibitory phosphorylation of Irs1 and targeting of the protein for proteasomal degradation (33, 52). A similar phenomenon appears to occur in ΔTsc2 osteoblasts and may explain the accumulation of immature osteoblasts in ΔTsc2 mice, particularly since pharmacological inhibition of this pathway via SP600125 or rapamycin treatment was able to restore insulin sensitivity and rescue the differentiation defect of Tsc2-deficient osteoblasts. These data together with the reduction in bone mass evident in ΔmTOR mice imply that Tsc2 represents a critical regulator of anabolic signaling necessary for osteoblasts to attain a fully mature phenotype.
The similarity of the metabolic disturbances in the ΔTsc2 mice to those observed previously in mice lacking the insulin receptor in osteoblasts (8, 9) strongly suggested the involvement of a common factor as a causative agent. The most obvious candidate was osteocalcin, which has been identified as a bone-derived hormone that functions to communicate metabolic information between the osteoblast and other metabolically active tissues. Evidence for such a physiological role is supported by the fact that osteocalcin-null mice exhibit severe impairments in glucose metabolism (7), and infusion or daily injections of osteocalcin ameliorate the detrimental effects of a high-fat diet on glucose metabolism (53, 54). Undercarboxylated osteocalcin, which binds poorly to bone hydroxyapatite, escapes the local bone matrix or is released via osteoclastic resorption and acts as a circulating hormone to increase insulin production by β cells and insulin sensitivity in other target tissues (7). More recent studies suggest that this hormone can also influence male fertility by acting on the Leydig cells of the testes (38), but testis size was not affected in our study and we did not observe an effect of Tsc2 loss of function on fertility (data not shown).
Like other hormones, osteocalcin appears to exert its effects on glucose metabolism within a narrow range of effective concentrations. For example, in isolated pancreatic islets, bacterially derived uncarboxylated osteocalcin (0.3 ng/ml) increases insulin gene expression, whereas increasing the dose to 30 ng/ml produces no response. A similarly narrow effective therapeutic range was observed following infusion of osteocalcin via osmotic pumps (53). In the present study, levels of undercarboxylated osteocalcin in serum (Glu13) were on the order of 20 ng/ml in control mice but were 10-fold higher in ΔTsc2 mice.
Based on these pharmacological characteristics and the current knowledge of the biology of osteocalcin, we strongly suspect that the metabolic deficiencies seen in the ΔTsc2 mice resulted from desensitization of target tissues as a result of chronic exposure to osteocalcin. This conclusion is supported by several pieces of experimental evidence. First, 1-week-old ΔTsc2 mice exhibited parameters of improved glucose handling, including lower blood glucose levels and increased serum insulin, in association with more modest increases in osteocalcin. Second, the concentration of osteocalcin required to increase markers of insulin sensitivity in target tissues like muscle and adipose appears to be greater than that necessary to increase insulin expression in the pancreas (53). In our study, insulin sensitivity was increased in younger ΔTsc2 mice (6 weeks) and then normalized as they aged (12 weeks), which we suspect represents a lag in the desensitization of these tissues. Third, exposure of Min6 β cells to media conditioned with ΔTsc2 osteoblasts, which contained nearly 3-fold-higher concentrations of osteocalcin than medium conditioned with control osteoblasts, led to a downregulation of Gpcr6a, a putative osteocalcin receptor (37, 38), and rendered them resistant to further stimulation with osteocalcin. Finally, the abundance of Gpcr6a was reduced in β cells isolated from ΔTsc2 mice relative to control littermates.
At the transcriptional level, a reduction in the activity of FoxO1, a repressor of osteocalcin promoter activity (10, 11), likely explains the increase in osteocalcin expression, since the nuclear localization and osteocalcin promoter binding of FoxO1 were reduced in ΔTsc2 osteoblasts. This finding was somewhat unexpected considering that FoxO has been reported to remain in the nuclei in some tissues lacking Tsc2 (29, 55), and the Tsc2-deficient osteoblasts were unresponsive to insulin and had reduced Akt activity. It is possible that the mTOR target SGK, which is known to have activity similar to Akt, including the ability to phosphorylate FoxO (56, 57), is responsible for this effect. However, the precise mechanistic link between increased mTOR activity and FoxO1 phosphorylation remains unclear and is under investigation.
How Tsc-mTOR signaling influences osteocalcin γ-carboxylation is also unknown at present. It has been proposed that osteocalcin is decarboxylated and liberated from the bone matrix during osteoclastic bone resorption (9), but osteoclastic activity was reduced in ΔTsc2 mice. An alternative possibility is that ER stress associated with Tsc2 deficiency interferes with the activity of the vitamin K-dependent γ-carboxylase necessary for osteocalcin carboxylation. Additionally, the increased expression of osteocalcin may simply lead to a greater production of undercarboxylated osteocalcin by the osteoblast. Indeed, our previous work demonstrated that significant levels of ucOCN could be measured in cultures of calvarial osteoblasts (8). Nonetheless, the dramatic increases in osteocalcin production evident in this model may be beneficial in further dissecting the factors that regulate osteocalcin bioavailability.
In summary, these studies identify Tsc2 as a critical insulin-responsive target protein, which moderates signals controlling osteoblast differentiation and glucose metabolism. Additionally, our results suggest mechanisms whereby the biological actions of osteocalcin in pancreatic β cells are tempered by classical downregulation of its G protein-coupled receptor. Finally, these findings represent further support for the emerging model, which links osteoblast functions to energy homeostasis.
Supplementary Material
ACKNOWLEDGMENTS
We thank M. Gambello and C. Lynch for providing the Tsc2flox/flox and mTORflox/flox mice, respectively.
Support was provided by a Merit Review Grant (T.L.C.) and Career Development Award (R.C.R.) from the Veterans Administration and by grants from the NIH (M.A.H., DK081472; R.C.R., DK099134) and the Baltimore Diabetes Research and Training Center (M.A.H., DK079637). T.L.C. is also the recipient of a Research Career Scientist Award from the Veterans Administration.
Footnotes
Published ahead of print 3 March 2014
Supplemental material for this article may be found at http://dx.doi.org/10.1128/MCB.00075-14.
REFERENCES
- 1.Karsenty G. 2006. Convergence between bone and energy homeostases: leptin regulation of bone mass. Cell Metab. 4:341–348. 10.1016/j.cmet.2006.10.008 [DOI] [PubMed] [Google Scholar]
- 2.Fukumoto S, Martin TJ. 2009. Bone as an endocrine organ. Trends Endocrinol. Metab. 20:230–236. 10.1016/j.tem.2009.02.001 [DOI] [PubMed] [Google Scholar]
- 3.Karsenty G, Oury F. 2012. Biology without walls: the novel endocrinology of bone. Annu. Rev. Physiol. 74:87–105. 10.1146/annurev-physiol-020911-153233 [DOI] [PMC free article] [PubMed] [Google Scholar]
- 4.Spiegelman BM, Flier JS. 2001. Obesity and the regulation of energy balance. Cell 104:531–543. 10.1016/S0092-8674(01)00240-9 [DOI] [PubMed] [Google Scholar]
- 5.Ducy P, Amling M, Takeda S, Priemel M, Schilling AF, Beil FT, Shen J, Vinson C, Rueger JM, Karsenty G. 2000. Leptin inhibits bone formation through a hypothalamic relay: a central control of bone mass. Cell 100:197–207. 10.1016/S0092-8674(00)81558-5 [DOI] [PubMed] [Google Scholar]
- 6.Takeda S, Elefteriou F, Levasseur R, Liu X, Zhao L, Parker KL, Armstrong D, Ducy P, Karsenty G. 2002. Leptin regulates bone formation via the sympathetic nervous system. Cell 111:305–317. 10.1016/S0092-8674(02)01049-8 [DOI] [PubMed] [Google Scholar]
- 7.Lee NK, Sowa H, Hinoi E, Ferron M, Ahn JD, Confavreux C, Dacquin R, Mee PJ, McKee MD, Jung DY, Zhang Z, Kim JK, Mauvais-Jarvis F, Ducy P, Karsenty G. 2007. Endocrine regulation of energy metabolism by the skeleton. Cell 130:456–469. 10.1016/j.cell.2007.05.047 [DOI] [PMC free article] [PubMed] [Google Scholar]
- 8.Fulzele K, Riddle RC, DiGirolamo DJ, Cao X, Wan C, Chen D, Faugere MC, Aja S, Hussain MA, Bruning JC, Clemens TL. 2010. Insulin receptor signaling in osteoblasts regulates postnatal bone acquisition and body composition. Cell 142:309–319. 10.1016/j.cell.2010.06.002 [DOI] [PMC free article] [PubMed] [Google Scholar]
- 9.Ferron M, Wei J, Yoshizawa T, Del Fattore A, DePinho RA, Teti A, Ducy P, Karsenty G. 2010. Insulin signaling in osteoblasts integrates bone remodeling and energy metabolism. Cell 142:296–308. 10.1016/j.cell.2010.06.003 [DOI] [PMC free article] [PubMed] [Google Scholar]
- 10.Rached MT, Kode A, Silva BC, Jung DY, Gray S, Ong H, Paik JH, DePinho RA, Kim JK, Karsenty G, Kousteni S. 2010. FoxO1 expression in osteoblasts regulates glucose homeostasis through regulation of osteocalcin in mice. J. Clin. Invest. 120:357–368. 10.1172/JCI39901 [DOI] [PMC free article] [PubMed] [Google Scholar]
- 11.Kode A, Mosialou I, Silva BC, Joshi S, Ferron M, Rached MT, Kousteni S. 2012. FoxO1 protein cooperates with ATF4 protein in osteoblasts to control glucose homeostasis. J. Biol. Chem. 287:8757–8768. 10.1074/jbc.M111.282897 [DOI] [PMC free article] [PubMed] [Google Scholar]
- 12.Whiteman EL, Cho H, Birnbaum MJ. 2002. Role of Akt/protein kinase B in metabolism. Trends Endocrinol. Metab. 13:444–451. 10.1016/S1043-2760(02)00662-8 [DOI] [PubMed] [Google Scholar]
- 13.Wullschleger S, Loewith R, Hall MN. 2006. TOR signaling in growth and metabolism. Cell 124:471–484. 10.1016/j.cell.2006.01.016 [DOI] [PubMed] [Google Scholar]
- 14.Garami A, Zwartkruis FJ, Nobukuni T, Joaquin M, Roccio M, Stocker H, Kozma SC, Hafen E, Bos JL, Thomas G. 2003. Insulin activation of Rheb, a mediator of mTOR/S6K/4E-BP signaling, is inhibited by TSC1 and 2. Mol. Cell 11:1457–1466. 10.1016/S1097-2765(03)00220-X [DOI] [PubMed] [Google Scholar]
- 15.Tee AR, Manning BD, Roux PP, Cantley LC, Blenis J. 2003. Tuberous sclerosis complex gene products, Tuberin and Hamartin, control mTOR signaling by acting as a GTPase-activating protein complex toward Rheb. Curr. Biol. 13:1259–1268. 10.1016/S0960-9822(03)00506-2 [DOI] [PubMed] [Google Scholar]
- 16.Manning BD, Tee AR, Logsdon MN, Blenis J, Cantley LC. 2002. Identification of the tuberous sclerosis complex-2 tumor suppressor gene product tuberin as a target of the phosphoinositide 3-kinase/akt pathway. Mol. Cell 10:151–162. 10.1016/S1097-2765(02)00568-3 [DOI] [PubMed] [Google Scholar]
- 17.Inoki K, Li Y, Zhu T, Wu J, Guan KL. 2002. TSC2 is phosphorylated and inhibited by Akt and suppresses mTOR signalling. Nat. Cell Biol. 4:648–657. 10.1038/ncb839 [DOI] [PubMed] [Google Scholar]
- 18.Hernandez O, Way S, McKenna J, III, Gambello MJ. 2007. Generation of a conditional disruption of the Tsc2 gene. Genesis 45:101–106. 10.1002/dvg.20271 [DOI] [PubMed] [Google Scholar]
- 19.Lang CH, Frost RA, Bronson SK, Lynch CJ, Vary TC. 2010. Skeletal muscle protein balance in mTOR heterozygous mice in response to inflammation and leucine. Am. J. Physiol. Endocrinol. Metab. 298:E1283–E1294. 10.1152/ajpendo.00676.2009 [DOI] [PMC free article] [PubMed] [Google Scholar]
- 20.Zhang M, Xuan S, Bouxsein ML, von Stechow D, Akeno N, Faugere MC, Malluche H, Zhao G, Rosen CJ, Efstratiadis A, Clemens TL. 2002. Osteoblast-specific knockout of the insulin-like growth factor (IGF) receptor gene reveals an essential role of IGF signaling in bone matrix mineralization. J. Biol. Chem. 277:44005–44012. 10.1074/jbc.M208265200 [DOI] [PubMed] [Google Scholar]
- 21.Parfitt AM, Drezner MK, Glorieux FH, Kanis JA, Malluche H, Meunier PJ, Ott SM, Recker RR. 1987. Bone histomorphometry: standardization of nomenclature, symbols, and units. Report of the ASBMR Histomorphometry Nomenclature Committee. J. Bone Miner. Res. 2:595–610 [DOI] [PubMed] [Google Scholar]
- 22.Bouxsein ML, Boyd SK, Christiansen BA, Guldberg RE, Jepsen KJ, Muller R. 2010. Guidelines for assessment of bone microstructure in rodents using micro-computed tomography. J. Bone Miner. Res. 25:1468–1486. 10.1002/jbmr.141 [DOI] [PubMed] [Google Scholar]
- 23.Dempster DW, Compston JE, Drezner MK, Glorieux FH, Kanis JA, Malluche H, Meunier PJ, Ott SM, Recker RR, Parfitt AM. 2013. Standardized nomenclature, symbols, and units for bone histomorphometry: a 2012 update of the report of the ASBMR Histomorphometry Nomenclature Committee. J. Bone Miner. Res. 28:2–17. 10.1002/jbmr.1805 [DOI] [PMC free article] [PubMed] [Google Scholar]
- 24.Hussain MA, Porras DL, Rowe MH, West JR, Song WJ, Schreiber WE, Wondisford FE. 2006. Increased pancreatic beta-cell proliferation mediated by CREB binding protein gene activation. Mol. Cell. Biol. 26:7747–7759. 10.1128/MCB.02353-05 [DOI] [PMC free article] [PubMed] [Google Scholar]
- 25.Fulzele K, DiGirolamo DJ, Liu Z, Xu J, Messina JL, Clemens TL. 2007. Disruption of the insulin-like growth factor type 1 receptor in osteoblasts enhances insulin signaling and action. J. Biol. Chem. 282:25649–25658. 10.1074/jbc.M700651200 [DOI] [PubMed] [Google Scholar]
- 26.Ferron M, Wei J, Yoshizawa T, Ducy P, Karsenty G. 2010. An ELISA-based method to quantify osteocalcin carboxylation in mice. Biochem. Biophys. Res. Commun. 397:691–696. 10.1016/j.bbrc.2010.06.008 [DOI] [PMC free article] [PubMed] [Google Scholar]
- 27.Bialek P, Kern B, Yang X, Schrock M, Sosic D, Hong N, Wu H, Yu K, Ornitz DM, Olson EN, Justice MJ, Karsenty G. 2004. A twist code determines the onset of osteoblast differentiation. Dev. Cell 6:423–435. 10.1016/S1534-5807(04)00058-9 [DOI] [PubMed] [Google Scholar]
- 28.Harrington LS, Findlay GM, Gray A, Tolkacheva T, Wigfield S, Rebholz H, Barnett J, Leslie NR, Cheng S, Shepherd PR, Gout I, Downes CP, Lamb RF. 2004. The TSC1-2 tumor suppressor controls insulin-PI3K signaling via regulation of IRS proteins. J. Cell Biol. 166:213–223. 10.1083/jcb.200403069 [DOI] [PMC free article] [PubMed] [Google Scholar]
- 29.Shah OJ, Wang Z, Hunter T. 2004. Inappropriate activation of the TSC/Rheb/mTOR/S6K cassette induces IRS1/2 depletion, insulin resistance, and cell survival deficiencies. Curr. Biol. 14:1650–1656. 10.1016/j.cub.2004.08.026 [DOI] [PubMed] [Google Scholar]
- 30.Ozcan U, Ozcan L, Yilmaz E, Duvel K, Sahin M, Manning BD, Hotamisligil GS. 2008. Loss of the tuberous sclerosis complex tumor suppressors triggers the unfolded protein response to regulate insulin signaling and apoptosis. Mol. Cell 29:541–551. 10.1016/j.molcel.2007.12.023 [DOI] [PMC free article] [PubMed] [Google Scholar]
- 31.Bain J, McLauchlan H, Elliott M, Cohen P. 2003. The specificities of protein kinase inhibitors: an update. Biochem. J. 371:199–204. 10.1042/BJ20021535 [DOI] [PMC free article] [PubMed] [Google Scholar]
- 32.Ozcan U, Cao Q, Yilmaz E, Lee AH, Iwakoshi NN, Ozdelen E, Tuncman G, Gorgun C, Glimcher LH, Hotamisligil GS. 2004. Endoplasmic reticulum stress links obesity, insulin action, and type 2 diabetes. Science 306:457–461. 10.1126/science.1103160 [DOI] [PubMed] [Google Scholar]
- 33.Aguirre V, Uchida T, Yenush L, Davis R, White MF. 2000. The c-Jun NH(2)-terminal kinase promotes insulin resistance during association with insulin receptor substrate-1 and phosphorylation of Ser(307). J. Biol. Chem. 275:9047–9054. 10.1074/jbc.275.12.9047 [DOI] [PubMed] [Google Scholar]
- 34.Granner D, Andreone T, Sasaki K, Beale E. 1983. Inhibition of transcription of the phosphoenolpyruvate carboxykinase gene by insulin. Nature 305:549–551. 10.1038/305549a0 [DOI] [PubMed] [Google Scholar]
- 35.Iynedjian PB, Pilot PR, Nouspikel T, Milburn JL, Quaade C, Hughes S, Ucla C, Newgard CB. 1989. Differential expression and regulation of the glucokinase gene in liver and islets of Langerhans. Proc. Natl. Acad. Sci. U. S. A. 86:7838–7842. 10.1073/pnas.86.20.7838 [DOI] [PMC free article] [PubMed] [Google Scholar]
- 36.Huang B, Wu P, Bowker-Kinley MM, Harris RA. 2002. Regulation of pyruvate dehydrogenase kinase expression by peroxisome proliferator-activated receptor-alpha ligands, glucocorticoids, and insulin. Diabetes 51:276–283. 10.2337/diabetes.51.2.276 [DOI] [PubMed] [Google Scholar]
- 37.Pi M, Wu Y, Quarles LD. 2011. GPRC6A mediates responses to osteocalcin in beta-cells in vitro and pancreas in vivo. J. Bone Miner. Res. 26:1680–1683. 10.1002/jbmr.390 [DOI] [PMC free article] [PubMed] [Google Scholar]
- 38.Oury F, Sumara G, Sumara O, Ferron M, Chang H, Smith CE, Hermo L, Suarez S, Roth BL, Ducy P, Karsenty G. 2011. Endocrine regulation of male fertility by the skeleton. Cell 144:796–809. 10.1016/j.cell.2011.02.004 [DOI] [PMC free article] [PubMed] [Google Scholar]
- 39.Inoki K, Ouyang H, Zhu T, Lindvall C, Wang Y, Zhang X, Yang Q, Bennett C, Harada Y, Stankunas K, Wang CY, He X, MacDougald OA, You M, Williams BO, Guan KL. 2006. TSC2 integrates Wnt and energy signals via a coordinated phosphorylation by AMPK and GSK3 to regulate cell growth. Cell 126:955–968. 10.1016/j.cell.2006.06.055 [DOI] [PubMed] [Google Scholar]
- 40.Inoki K, Zhu T, Guan KL. 2003. TSC2 mediates cellular energy response to control cell growth and survival. Cell 115:577–590. 10.1016/S0092-8674(03)00929-2 [DOI] [PubMed] [Google Scholar]
- 41.Kumar A, Harris TE, Keller SR, Choi KM, Magnuson MA, Lawrence JC., Jr 2008. Muscle-specific deletion of rictor impairs insulin-stimulated glucose transport and enhances basal glycogen synthase activity. Mol. Cell. Biol. 28:61–70. 10.1128/MCB.01405-07 [DOI] [PMC free article] [PubMed] [Google Scholar]
- 42.Huang J, Manning BD. 2008. The TSC1-TSC2 complex: a molecular switchboard controlling cell growth. Biochem. J. 412:179–190. 10.1042/BJ20080281 [DOI] [PMC free article] [PubMed] [Google Scholar]
- 43.Liu X, Bruxvoort KJ, Zylstra CR, Liu J, Cichowski R, Faugere MC, Bouxsein ML, Wan C, Williams BO, Clemens TL. 2007. Lifelong accumulation of bone in mice lacking Pten in osteoblasts. Proc. Natl. Acad. Sci. U. S. A. 104:2259–2264. 10.1073/pnas.0604153104 [DOI] [PMC free article] [PubMed] [Google Scholar]
- 44.Cornish J, Callon KE, Reid IR. 1996. Insulin increases histomorphometric indices of bone formation in vivo. Calcif. Tissue Int. 59:492–495. 10.1007/BF00369216 [DOI] [PubMed] [Google Scholar]
- 45.Kemink SA, Hermus AR, Swinkels LM, Lutterman JA, Smals AG. 2000. Osteopenia in insulin-dependent diabetes mellitus; prevalence and aspects of pathophysiology. J. Endocrinol. Invest. 23:295–303 [DOI] [PubMed] [Google Scholar]
- 46.Thrailkill KM. 2000. Insulin-like growth factor-I in diabetes mellitus: its physiology, metabolic effects, and potential clinical utility. Diabetes Technol. Ther. 2:69–80. 10.1089/152091599316775 [DOI] [PubMed] [Google Scholar]
- 47.Osborne JP. 1988. Diagnosis of tuberous sclerosis. Arch. Dis. Child. 63:1423–1425. 10.1136/adc.63.12.1423 [DOI] [PMC free article] [PubMed] [Google Scholar]
- 48.Bernauer TA, Mirowski GW, Caldemeyer KS. 2001. Tuberous sclerosis. Part II. Musculoskeletal and visceral findings. J. Am. Acad. Dermatol. 45:450–452. 10.1067/mjd.2001.111626 [DOI] [PubMed] [Google Scholar]
- 49.Smith TK, Gregersen GG, Samilson RL. 1969. Orthopaedic problems associated with tuberous sclerosis. J. Bone Joint Surg. Am. 51:97–102 [PubMed] [Google Scholar]
- 50.Gasparetto EL, de Carvalho Neto A, Bruck I, Antoniuk S. 2003. Tuberous sclerosis and fibrous dysplasia. Am. J. Neuroradiol. 24:835–837 [PMC free article] [PubMed] [Google Scholar]
- 51.Breningstall GN, Faerber EN, Kolanu R. 1988. Fibrous dysplasia in a patient with tuberous sclerosis. J. Child Neurol. 3:131–134. 10.1177/088307388800300211 [DOI] [PubMed] [Google Scholar]
- 52.Hirosumi J, Tuncman G, Chang L, Gorgun CZ, Uysal KT, Maeda K, Karin M, Hotamisligil GS. 2002. A central role for JNK in obesity and insulin resistance. Nature 420:333–336. 10.1038/nature01137 [DOI] [PubMed] [Google Scholar]
- 53.Ferron M, Hinoi E, Karsenty G, Ducy P. 2008. Osteocalcin differentially regulates beta cell and adipocyte gene expression and affects the development of metabolic diseases in wild-type mice. Proc. Natl. Acad. Sci. U. S. A. 105:5266–5270. 10.1073/pnas.0711119105 [DOI] [PMC free article] [PubMed] [Google Scholar]
- 54.Ferron M, McKee MD, Levine RL, Ducy P, Karsenty G. 2012. Intermittent injections of osteocalcin improve glucose metabolism and prevent type 2 diabetes in mice. Bone 50:568–575. 10.1016/j.bone.2011.04.017 [DOI] [PMC free article] [PubMed] [Google Scholar]
- 55.Zhang HH, Lipovsky AI, Dibble CC, Sahin M, Manning BD. 2006. S6K1 regulates GSK3 under conditions of mTOR-dependent feedback inhibition of Akt. Mol. Cell 24:185–197. 10.1016/j.molcel.2006.09.019 [DOI] [PMC free article] [PubMed] [Google Scholar]
- 56.Hong F, Larrea MD, Doughty C, Kwiatkowski DJ, Squillace R, Slingerland JM. 2008. mTOR-raptor binds and activates SGK1 to regulate p27 phosphorylation. Mol. Cell 30:701–711. 10.1016/j.molcel.2008.04.027 [DOI] [PubMed] [Google Scholar]
- 57.Brunet A, Park J, Tran H, Hu LS, Hemmings BA, Greenberg ME. 2001. Protein kinase SGK mediates survival signals by phosphorylating the forkhead transcription factor FKHRL1 (FOXO3a). Mol. Cell. Biol. 21:952–965. 10.1128/MCB.21.3.952-965.2001 [DOI] [PMC free article] [PubMed] [Google Scholar]
Associated Data
This section collects any data citations, data availability statements, or supplementary materials included in this article.