

Abstract
Chronic inflammation is known to be associated with prostate cancer development, but how epithelium-associated cancer-initiating events cross talk to inflammatory cells during prostate cancer initiation and progression is largely unknown. Using the Pten null murine prostate cancer model, we show an expansion of Gr-1+ CD11b+ myeloid-derived suppressor cells (MDSCs) occurring intraprostatically immediately following epithelium-specific Pten deletion without expansion in hematopoietic tissues. This MDSC expansion is accompanied by sustained immune suppression. Prostatic Gr-1+ CD11b+ cells, but not those isolated from the spleen of the same tumor-bearing mice, suppress T cell proliferation and express high levels of Arginase 1 and iNOS. Mechanistically, the loss of PTEN in the epithelium leads to a significant upregulation of genes within the inflammatory response and cytokine-cytokine receptor interaction pathways, including Csf1 and Il1b, two genes known to induce MDSC expansion and immunosuppressive activities. Treatment of Pten null mice with the selective CSF-1 receptor inhibitor GW2580 decreases MDSC infiltration and relieves the associated immunosuppressive phenotype. Our study indicates that epithelium-associated tumor-initiating events trigger the secretion of inflammatory cytokines and promote localized MDSC expansion and immune suppression, thereby promoting tumor progression.
INTRODUCTION
Recent studies suggest that tumor-infiltrating myeloid cells, and in particular myeloid-derived suppressor cells (MDSCs), are important mediators of a tumor-permissive microenvironment that contributes to tumor growth and, moreover, could account for the limited success of immunotherapeutic strategies (1, 2).
MDSCs are a heterogeneous population of cells that are precursors of dendritic cells (DCs), macrophages, and granulocytes. They are characterized in mice by the dual expression of the cell surface molecules Gr-1 (Ly6C and Ly6G) and CD11b, although other markers, such as CD80, CD115, and F4/80, have been used to characterize subtypes of MDSCs in different tumors (3). MDSCs suppress innate immunity by secreting cytokines and suppressing DC and macrophage maturation (4–6). MDSCs can also suppress adaptive immunity by blocking T cell activation (7), inducing Treg accumulation (8), and inhibiting natural killer (NK) cell cytotoxicity against tumor cells (9).
Although the association between MDSCs and immune suppression has been demonstrated in various animal models and in human cancers, the causes of MDSC expansion, especially during tumor initiation and progression, are largely unknown. Since prostate cancer is known to be associated with chronic inflammation (10, 11), we sought to investigate how MDSCs are involved in prostate cancer initiation and progression. Using the endogenous Pten null prostate cancer model that recapitulates the major genetic alterations and disease hallmarks seen in human prostate cancers (12), we found that proinflammatory cytokines produced by Pten null prostate epithelial cells are the major causes of intraprostatic MDSC expansion and the establishment of a tumor-permissive microenvironment.
MATERIALS AND METHODS
Mouse strains.
The generation of Pb-Cre+; Ptenlox/lox mice was described previously by our group (12). All animal experiments were approved by the UCLA Animal Research Committee and conducted according to relevant regulatory standards.
Histology and immunohistochemistry.
Immunohistochemical analysis was performed on formalin-fixed, paraffin-embedded tissue sections. Antigen retrieval was performed by heating the slides to 95°C in citrate buffer (pH 6.0) for 30 min before staining. The following primary antibodies were used: rat anti-CD45 (1:100; BD Biosciences), rabbit anti-E-cadherin (anti-E-cad) (1:500; BD Biosciences), mouse anti-α-smooth muscle actin (anti-α-SMA) (1:1,000; Sigma-Aldrich), rabbit anti-Ki67 (1:500; Vector Laboratories), rabbit anti-phospho-colony-stimulating factor 1 receptor (anti-p-CSF-1R) (1:100; Santa Cruz), and rat antibromodeoxyuridine (anti-BrdU) (1:500; BD Biosciences).
Tissue dissociation and single-cell suspension.
Single-cell suspensions were prepared from prostates, draining lymph nodes, spleen, bone marrow (BM), and liver of age- and genetic background-matched wild-type (WT) and Pb-Cre+; Ptenlox/lox mice at the indicated time points. For prostates, ventral and dorsolateral prostate lobes of individual mice were separated from the remainder of the prostate. All tissues were minced in sterile tissue culture dishes and subjected to collagenase A (1 mg/ml; Roche) and DNase I (0.1 mg/ml; Roche) digestion for 1 h at 37°C with constant agitation. Undigested tissue was passed through a 70-μm filter to facilitate dissociation, followed by washes in phosphate-buffered saline (PBS) and resuspension in Hanks' balanced salt solution. Live cells were quantified by trypan blue exclusion. Spleens and livers were subjected to a red blood cell lysis step using ammonium-chloride-potassium (ACK) lysing buffer (Quality Biological, Inc.) after digestion, followed by passage through a 70-μm filter. All cells were resuspended in Hanks' balanced salt solution plus 2% fetal bovine serum (FBS).
Fluorescence-activated cell sorting (FACS) analysis and cell sorting.
Single-cell suspensions were stained with directly conjugated antibodies against CD45, Gr-1, CD11b, CD4, CD8, CD69, B220 (BD Biosciences), F4/80, CD19, CD11c, major histocompatibility complex class II (MHCII) (eBioscience), and Ly6C (BioLegend), according to the manufacturers' instructions. Flow cytometric analysis was performed on a FACSCanto II instrument (BD Biosciences), and data were analyzed by using BDFACS Diva software (BD Biosciences). For isolation of MDSCs, single-cell suspensions were stained with directly conjugated antibodies against CD45, Gr-1, and CD11b, sorted on a FACSAria instrument (BD Biosciences) as CD45+ GR-1+ CD11b+ fractions, and collected in Dulbecco's modified Eagle medium plus 50% fetal bovine serum. For isolation of prostate epithelial cells, single-cell suspensions were stained with directly conjugated antibodies against CD45 (BD Biosciences), CD31, Ter119, and Epcam (Biolegend) and sorted on a FACSAria instrument (BD Biosciences) as CD45− CD31− Ter119− Epcam+ fractions. Cells were collected in Dulbecco's modified Eagle medium plus 50% fetal bovine serum.
BrdU pulse labeling.
Mice were injected intraperitoneally with a single dose of BrdU (dissolved in PBS to a final concentration of 10 mg/ml) at 100 mg/kg of body weight. Prostates, spleens, and bone marrow were harvested 24 h after injection.
Quantitative RT-PCR.
RNA was extracted and purified from FACS-sorted cell populations by using RNeasy Mini and RNeasy Micro columns (Qiagen) according to the manufacturer's protocols. Purified total RNA was reverse transcribed to cDNA by the High-Prostate Canceracity cDNA Archive kit (Applied Biosystems, Foster City, CA, USA) with random primers and MultiScribe reverse transcriptase (RT). The relative gene expression levels were measured by real-time RT-PCR using gene-specific primers and iQ SYBR green Supermix (Bio-Rad) and normalized to the β-actin RNA quantity for each cDNA sample as an endogenous control. The primers used are as follows: forward (F) primer AAGAAAAGGCCGATTCACCT and reverse (R) primer CACCTCCTCTGCTGTCTTCC for Arg1, F primer CAGCTGGCCAATGAGGTACT and R primer GTGCCAGAAGCTGGAACTCT for iNOS, F primer ACAACACCCCCAATGCTAAC and R primer GCTGTTGTTGCAGTTCTTGG for Csf1, F primer GCCCATCCTCTGTGACTCAT and R primer AGGCCACAGGTATTTTGTCG for Il1b, F primer ATCGATTTCTCCCCTGTGAA and R primer GCTCTGTCTAGGTCCTGGAGTC for Il10, F primer GGGGGCTTTATCATCCTCAC and R primer CCAAGACCTCAGGCAACAGT for Il1ra, and F primer TCTCAGTCTCAACGCTGTGG and R primer GGCCCTTTGGGTGATAAACT for Csf1r.
Cell culture and T cell suppression assays.
FACS-sorted MDSCs were spun down, counted, and plated into 96-well plates at an MDSC/T cell ratio of 1:1, 1:2, 1:5, or 1:10. A total of 3.0 × 10⁵ to 5.0 × 10⁵ MDSCs were used for the 1:1 ratio. T cells were harvested from naive, wild-type littermate animals by mashing whole spleen through a 40-μm filter, followed by red blood cell lysis using ACK buffer. FACS-sorted CD8+ or CD4+ T cells were then washed, counted, and stained with carboxyfluorescein diacetate succinimidyl ester (CFSE) (Invitrogen, Carlsbad, CA) according to the manufacturer's instructions. Labeled T cells were plated onto 96-well plates in the presence or absence of anti-CD3 antibody (1 μg/ml), with and without MDSCs, and allowed to proliferate for 5 days. Proliferation rates were measured as a function of CFSE dilution and reported as a percentage of cells with diluted CFSE. Values were then normalized to the proliferation rate at an MDSC/T cell ratio of 0:1.
Data analysis and statistics.
All experiments were conducted in a minimum of three independent sets. Graphpad Prism software (Graphpad, La Jolla, CA) was used to calculate means and standard deviations (SD). A Student t test was used to determine statistical evaluations. Data are presented as means ± SD.
Laser capture and microarray analysis.
Freshly dissected prostates from age- and genetic background-matched WT and Pb-Cre+; Ptenlox/lox mice (n = 3; 28 to 30 weeks) were snap-frozen in OCT. Consecutive frozen sections were used for hematoxylin and eosin (H&E) and PTEN immunohistochemical staining to confirm pathological lesions and PTEN loss before laser capture microdissection (approximately 5,000 cells per sample) (13). RNA isolation, amplification, and quantification were performed as previously described (13). To provide a reference standard RNA for use on two-color cDNA microarrays, we used pooled total RNA from normal adult male Swiss-Webster mice (10% prostate and 30% each testis, liver, and kidney). For Pten null prostate cancer cell lines (PTEN-CaP2 and -CaP8), cells were cultured according to our previously reported methods and harvested for RNA extraction (14). Total RNA was also extracted from microdissected benign mouse prostate epithelial cells as the wild-type control against cell lines. A total of 825 ng of amplified mRNA from each sample was labeled with Cy3 fluorescent dye, and the reference standard was labeled with Cy5. Samples were then hybridized to Agilent 44K whole-mouse genome expression oligonucleotide microarray slides (Agilent Technologies, Inc.) according to the manufacturer's suggested protocols. Fluorescence array images were collected for Cy3 and Cy5 by using the Agilent DNA G2565BA microarray scanner, and Agilent Feature Extraction software was used to grid, extract, and normalize data.
Bioinformatics analysis.
Before bioinformatics analysis, we first filtered out the probes that were determined by Agilent software to be of poor quality (P > 0.05). For those genes detected by multiple probes, the intensities of probes were first averaged before the analysis. In vivo and in vitro samples were analyzed separately before being combined for clustering analysis (Cluster 3.0). For pathway and molecular signature analysis (15) as well as Gene Ontology analysis (http://www.geneontology.org/), we used Fisher's exact test to determine the pathways or biological processes enriched in the Pten null samples, based on genes that are significantly altered (fold change, ≥2) in Pten null samples compared to the WT. P values were calculated by using the Benjamini-Hochberg method (16) for multiple-hypothesis testing. The statistically significant altered pathways (adjusted P value of <0.05) were then reanalyzed by using gene set enrichment analysis (GSEA) to assess the direction of deregulation in the Pten null samples.
GW2580 treatment.
Male Pb-Cre+; Ptenlox/lox mice were treated with either vehicle (0.5% carboxymethyl cellulose in distilled H2O) or GW2580 (160 mg/kg GW2580) daily for 3 weeks by oral gavage, beginning at 6 weeks of age. Mice were sacrificed, and the prostate, spleen, and lymph nodes were harvested for FACS and immunohistochemical analyses.
Microarray data accession number.
Raw microarray data have been deposited in the NCBI Gene Expression Omnibus under accession no. GSE56470.
RESULTS
Pten null murine prostate cancer initiation and progression are associated with chronic immune cell infiltration.
To determine if PTEN loss in the prostate epithelium is associated with localized inflammatory responses, we took an unbiased approach to characterize the nature and extent of immune cell infiltration by using quantitative fluorescence-activated cell sorting (FACS), semiquantitative immunohistochemistry (IHC), and double-immunofluorescent (IF) analyses. Single-cell suspensions were prepared from dorsolateral and ventral lobes of individual prostates of Pb-Cre+; Ptenlox/lox male mice (mutant [MT]) at the prostatic intraepithelial neoplasia (mPIN) and invasive adenocarcinoma stages (Fig. 1A). Cre-negative (Pb-Cre−; Ptenlox/lox) littermates were used as controls (WT). Significant immune cell infiltration, marked by the pan-leukocyte antibody CD45, can be found within the prostate surrounding E-cadherin (E-cad)-positive (green) epithelial cells in both precancerous (mPIN) (6 weeks) and cancer (16 weeks) lesions (Fig. 1B). In MT prostates, CD45+ immune cell infiltrates made up 12% of all cells at the mPIN stage, while approximately 5% of cells in WT prostates were reactive to antibodies against CD45 (P < 0.05) (data not shown). Following disease progression and significant prostatic epithelial cell expansion, both the total number and percentage of CD45+ cells remained elevated compared to those of their age- and genetic background-matched WT littermates (Fig. 1B, bottom).
FIG 1.

Pten null murine prostate cancer initiation and progression are marked by persistent immune cell infiltration. (A) Kinetics of prostate cancer initiation and progression in the Pten null murine prostate cancer model. (B, top) Representative immunofluorescence images showing significant CD45+ (red) immune cell infiltration surrounding E-cadherin (E-Cad) (green)-positive luminal epithelial cells at the early mPIN (6 weeks) and late adenocarcinoma (16 weeks) stages in mutant (MT) mice compared to wild-type (WT) littermates. (Bottom) FACS analysis demonstrating that levels of CD45+ immune cell infiltrates remain elevated throughout all stages of disease progression. (C) Immune cell infiltrates are made up of predominantly Gr-1+ CD11b+ cells and reach nearly 50% of all CD45+ cells by the adenocarcinoma stage. (D, left) The majority of prostate-infiltrating Gr-1+ CD11b+ cells display a Gr-1Hi Ly6CLo polymorphonuclear (PMN) cell phenotype. (Right) Representative images of cytospun and Giemsa-stained PMN and mononuclear (MO) cell populations. (E) Percentages of various immune cell populations within the CD45+ infiltrate in WT and MT mice. Panels B to D show means ± standard errors of the means from a minimum of 5 animals per age/genotype. *, P < 0.05; **, P < 0.01; ***, P < 0.001.
To better understand the nature of the immune cell infiltrate, we labeled cells with antibodies against common myeloid and lymphoid cell surface antigens. Comparing MT prostates with those of their WT littermates, we observed a significant increase in the number of Gr-1+ CD11b+ cells within the infiltrating CD45+ population, particularly at the invasive adenocarcinoma stage (Fig. 1C, top and bottom). Gr-1+ CD11b+ cells comprised approximately 12% of all CD45+ cells at the mPIN stage (P < 0.05) while reaching over 40% of all infiltrating leukocytes at late invasive stages (P < 0.01) (Fig. 1C). Of the CD11b+ cells, the vast majority was comprised of Gr-1Hi Ly6CLo polymorphonuclear (PMN) cells (Fig. 1D). The remaining CD45+ cells were mainly CD11c+ cells and T and B cells (Fig. 1E). Levels of B220+ B cells did not increase significantly in MT prostate tissue during cancer initiation and progression (Fig. 1E). This study suggests that prostate cancer initiation and progression caused by PTEN loss in epithelial cells are associated with marked chronic and extensive Gr-1+ CD11b+ immune cell infiltration.
Gr-1+ CD11b+ cell expansion does not occur in lymph nodes, bone marrow, spleen, or liver of tumor-bearing animals during tumor initiation.
It has been well established, particularly in xenograft models, that Gr-1+ CD11b+ MDSCs are recruited from hematopoietic organs, and their expansion and suppressive capacity can be detected in both tumors and hematopoietic and nonhematopoietic organs such as the blood, spleen, liver, bone marrow, and lymph nodes (17). Therefore, we set out to determine whether Gr-1+ CD11b+ cell expansion occurs in hematopoietic and nonhematopoietic organs with kinetics similar to those at the tumor site. In sharp contrast to previous reports (17–19), we did not observe a significant increase in the number of Gr-1+ CD11b+ cells in the lymph nodes, spleen, bone marrow, or liver of the tumor-bearing mice (Fig. 2A to D).
FIG 2.
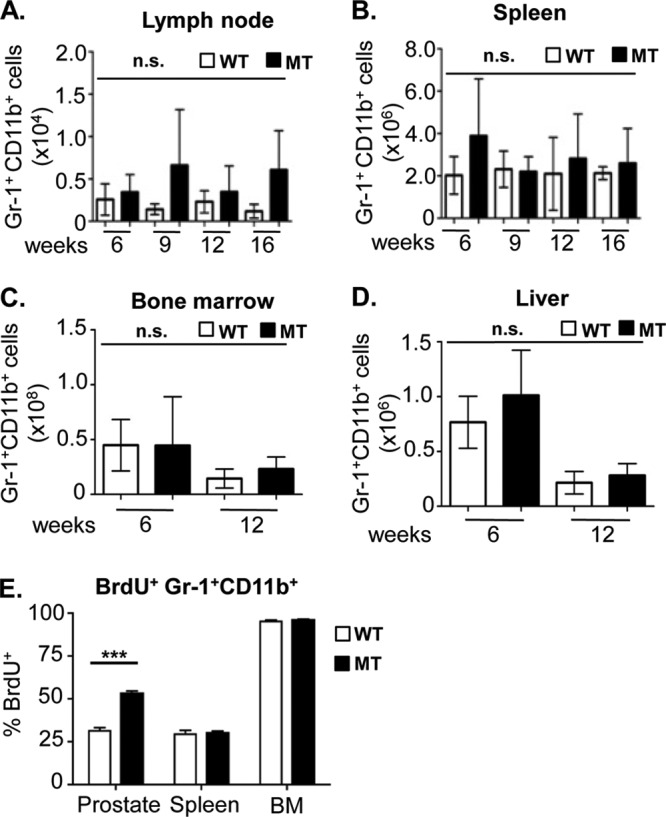
Gr-1+ CD11b+ cell expansion does not occur in lymph nodes, bone marrow, spleen, or liver of tumor-bearing animals. (A to D) Absolute numbers of Gr-1+ CD11b+ cells in the draining lymph nodes (A), spleen (B), bone marrow (C), and liver (D) of WT and MT mice throughout disease progression (means ± standard errors of the means from a minimum of 3 animals per age/genotype). (E) The percentage of prostatic BrdU+ Gr-1+ CD11b+ cells is significantly higher in MT animals than in WT littermates. The percentage of spleen and bone marrow BrdU+ Gr-1+ CD11b+ cells remained unchanged between MT and WT littermate tissues (***, P < 0.001). Ten high-power microscopic fields were counted for each organ and genotype (minimum of 3 animals per genotype). n.s., not significant.
To further investigate the mechanisms underlying the localized prostatic expansion of Gr-1+ CD11b+ cells during prostate cancer initiation and progression, 6- to 8-week-old WT and MT mice were pulse labeled with BrdU for 24 h. Gr-1+ CD11b+ cells were FACS sorted from the prostate, spleen, and bone marrow and analyzed for anti-BrdU reactivity. While there were no significant differences in the percentages of BrdU-positive (BrdU+) Gr-1+ CD11b+ cells between the spleen and bone marrow of WT and MT mice, we found a substantial increase in the percentage of cycling BrdU+ Gr-1+ CD11b+ cells in the MT prostates (P < 0.001) (Fig. 2E), suggesting that in an endogenous prostate cancer model, oncogenic Pten deletion in prostatic epithelial cells may trigger the localized expansion of Gr-1+ CD11b+ cells during tumor initiation.
PTEN loss in epithelial cells leads to upregulated inflammatory and cytokine-cytokine receptor signaling pathways.
In order to better understand how epithelial cell-associated tumor-initiating events cross talk with inflammatory cells to potentiate prostate cancer initiation and progression, we performed laser capture microdissection of epithelial cells from age- and genetic background-matched WT and MT prostates (n = 3) and conducted gene expression analysis (see Materials and Methods). Pathway analysis and gene set enrichment analysis (GSEA) (15) demonstrated that the inflammatory response, the immune response, chemotaxis, the extracellular matrix (ECM)-receptor interaction, and cytokine-cytokine receptor interaction pathways are among the major pathways enriched in the MT epithelial cells (Fig. 3A and data not shown). Importantly, the upregulated genes in these pathways were also found to be significantly upregulated in human prostate cancer samples (P < 0.05 by Fisher's exact test) (Fig. 3B) (20).
FIG 3.

PTEN loss in epithelial cells leads to upregulated inflammatory and cytokine-cytokine receptor signaling pathways. (A) GSEA shows enhanced activation of inflammatory response and cytokine-cytokine receptor interaction pathways in vivo in Pten null (MT) prostate epithelial cells. (B) Inflammatory genes upregulated in PTEN null murine prostate epithelial cells significantly overlap those in human prostate cancer samples (P < 0.05). (C, left) Epcam+ epithelial cells sorted from MT mice at the mPIN stage express higher levels of Csf1 and Il1b mRNA. Relative gene expression was normalized to levels in sorted WT prostate epithelial cells. (Middle) Csf1 expression is upregulated in two independent PTEN null prostate epithelial cells lines. (Right) IL1b expression is significantly upregulated in human prostate cancer specimens compared to normal prostate tissue (P < 0.05 by two-tailed test). (D) Il1ra (left) and Csf1r (right) gene expression levels are increased in sorted Gr-1+ CD11b+ cells from prostates of 6- to 8-week-old MT mice. The relative gene expression level was normalized to levels in WT BM (minimum 5 animals per age/genotype for panels C and D). *, P < 0.05; **, P < 0.01; ***, P < 0.001.
Since laser-captured epithelial cells may be contaminated by nonepithelial cells, including inflammatory components, gene expression analysis was also performed on Pten null epithelial cell lines (PTEN-CaP2 and PTEN-CaP8) (14). As illustrated by a Venn diagram, many genes associated with inflammatory responses and cytokine-cytokine receptor interaction pathways are indeed upregulated in PTEN null epithelial cells in the absence of any potential leukocyte contamination (Fig. 3B). These studies further support the thought that PTEN loss in prostate epithelial cells triggers a localized immune response and recruits inflammatory cells to the tumor microenvironment.
To investigate the mechanisms underlying the localized Gr-1+ CD11b+ cell expansion and proliferation, we next sought to determine which paracrine factors may be secreted from MT prostate epithelial cells. Epcam+ epithelial cells from 6- to 8-week-old MT and WT mice were FACS sorted to avoid possible contamination from leukocytes and stromal cells. CSF-1 (21–23) was previously implicated in the localization and expansion of MDSCs at the tumor site in a number of murine carcinoma models, including spontaneous and xenograft mammary tumor models (24, 25). Indeed, when FACS-sorted Epcam+ epithelial cells from MT and WT mice were compared, there was a 2-fold induction of Csf1 mRNA expression (n = 5; P < 0.01) (Fig. 3C, left). Similarly, epithelial cell lines generated from MT mice also showed upregulated Csf1 mRNA expression (n = 3; P < 0.005) (Fig. 3C, middle). Interleukin-1β (IL-1β), which has been demonstrated to both induce MDSC migration toward tumor lesions and lead to MDSC-mediated inhibition of T cell activity through the induction of Arg1 and iNOS mRNA expression (26–29), was shown to have 22-fold-higher levels of mRNA expression in sorted Epcam+ MT prostate epithelial cells than in WT epithelial cells (n = 5; P < 0.01) (Fig. 3C, left). Similarly, using a human expression data set available in GEO (accession number GSE21034), we confirmed that IL-1β mRNA expression was also significantly upregulated (P < 0.05 by two-tailed t test) in human primary tumors compared to normal prostate tissue (Fig. 3C, right) (20).
Finally, to uncover whether CSF-1 and IL-1β may act directly on prostatic Gr-1+ CD11b+ MDSCs, we analyzed the expression of CSF-1R and IL-1β receptor (IL-1βR) type I, respectively, on Gr-1+ CD11b+ cells isolated from the prostate and BM of mutant mice. Indeed, Gr-1+ CD11b+ cells isolated from the prostate had significantly higher Csf1r and Il1ra mRNA expression levels than Gr-1+ CD11b+ cells isolated from the BM of the same mice (n = 5; P < 0.001) (Fig. 3D). As PTEN loss in prostate epithelial cells leads to upregulated inflammatory responses and enhanced production of paracrine and pleiotropic factors such as CSF-1 and IL-1β, these factors may further propagate the infiltration and homing of Gr-1+ CD11b+ MDSCs to the prostate and promote their local proliferation and expansion (Fig. 1C and 2E).
Gr-1+ CD11b+ cells from the prostate but not spleen of tumor-bearing mice can suppress T cell proliferation.
MDSCs can suppress T cell function through the production of arginase (ARG) and inducible nitric oxide synthase (iNOS) enzymes, both of which metabolize and deplete arginine, an essential nutrient for T cell proliferation (30). iNOS activity can also lead to T cell unresponsiveness through the nitration of T cell receptors (TCRs) and subsequent inhibition of TCR-MHC-peptide interactions (31). Moreover, increased ARG activity has been shown for a variety of human malignancies, including prostate cancer (32). To test whether prostate-associated Gr-1+ CD11b+ cells have typical immune-suppressive activities, we analyzed gene expression by quantitative PCR (qPCR) using Gr-1+ CD11b+ cells isolated from the prostate, spleen, and bone marrow of WT and MT mice. Gr-1+ CD11b+ cells isolated from spleen and bone marrow samples have low to undetectable levels of Arg1 and iNOS mRNA in either WT or MT mice (Fig. 4A, right, and data not shown). In contrast, Gr-1+ CD11b+ cells isolated from MT prostates had significantly higher Arg1 (P < 0.0001) and iNOS (P < 0.05) mRNA expression levels than did those sorted from age-matched WT controls (Fig. 4A, left). It is worth noting that Arg1 and iNOS mRNA expression levels in Gr-1+ CD11b+ cells isolated from WT prostate tissue are elevated relative to the levels in their spleen and bone marrow counterparts (Fig. 4A, left). These findings suggest that the prostate microenvironment itself may be relatively immunosuppressive and that the loss of Pten and the formation of precancerous PIN lesions further exacerbate this condition.
FIG 4.
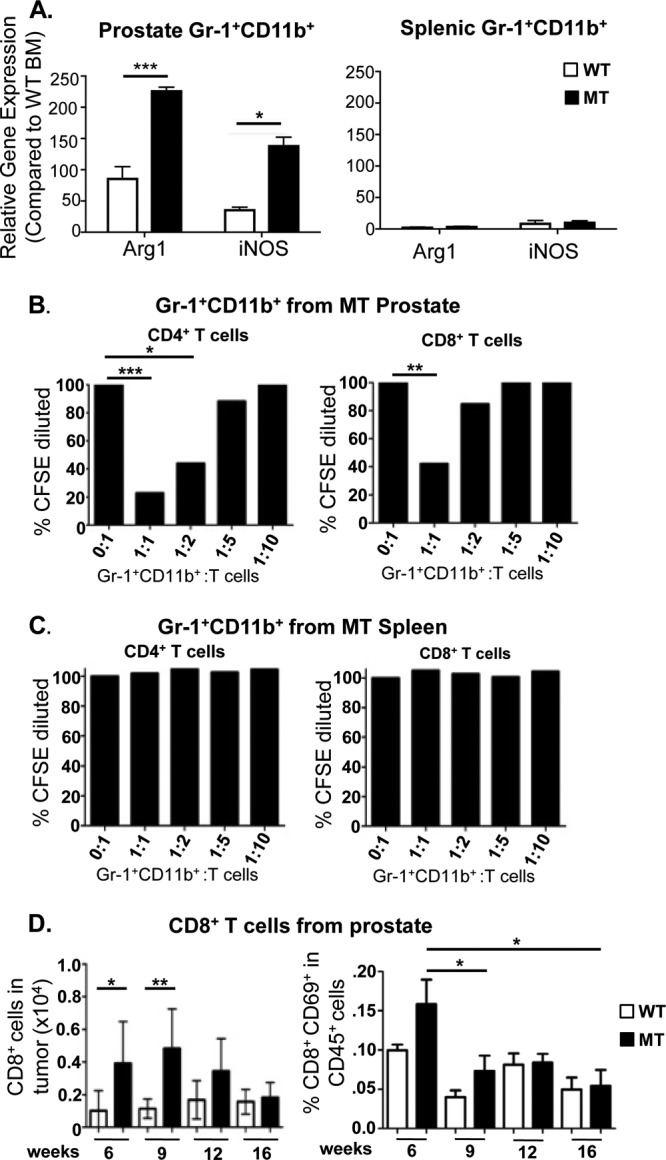
Gr-1+ CD11b+ cells from the prostate but not spleen of tumor-bearing mice can suppress T cell function. (A, left) Gr-1+ CD11b+ cells sorted from MT prostates have higher expression levels of Arg1 and iNOS than do Gr-1+ CD11b+ cells from WT prostates. (Right) Gr-1+ CD11b+ cells sorted from spleens of MT and WT littermate animals revealed no difference in and low levels of Arg1 and iNOS expression. The relative gene expression level for each sample was normalized to levels in WT BM (minimum of 5 animals per genotype). (B) Sorted Gr-1+ CD11b+ cells from mutant prostates were cocultured with naive CFSE-loaded CD4+ or CD8+ cells from spleens of wild-type animals at the indicated ratios. CD4+ (left) and CD8+ (right) T cell proliferations were suppressed by infiltrating Gr-1+ CD11b+ cells. (C) Identical assays using Gr-1+ CD11b+ cells from spleens of tumor-bearing mice show an inability to suppress T cell proliferation (means of 3 independent experiments for panels B and C). (D, left) FACS analysis demonstrates increased levels of CD8+ immune cell infiltrates as the disease initiates, which then decrease as the disease progresses. (Right) Levels of activated CD8+ CD69+ T cells decrease during disease progression. *, P < 0.05; **, P < 0.01; ***, P < 0.001.
The induction of immunosuppressive gene expression in Gr-1+ CD11b+ cells isolated from the prostate of MT mice prompted us to functionally test their immunosuppressive properties. Naive CD4+ or CD8+ T cells isolated from the spleens of WT animals were preloaded with carboxyfluorescein succinimidyl ester (CFSE) and cocultured with sorted Gr-1+ CD11b+ cells from MT prostates at various ratios in the presence of activating anti-CD3 antibody. T cell proliferation was measured according to the intensity of CFSE staining and presented as the percent change without Gr-1+ CD11b+ cell coculturing. CD4+ T cell proliferation was effectively inhibited by prostate cancer-associated Gr-1+ CD11b+ cells by 5-fold (P < 0.0001) at a 1:1 ratio and nearly 2.5-fold (P < 0.05) at a 1:2 ratio (Fig. 4B, left). Similarly, CD8+ T cell proliferation was suppressed by >2.5-fold (P < 0.01) at a 1:1 ratio (Fig. 4B, right). Because Gr-1+ CD11b+ cells are rare in WT prostate, we sorted Gr-1+ CD11b+ cells from the spleens of WT and MT mice and performed identical assays to determine if the immune-suppressive activity of Gr-1+ CD11b+ cells is specific to tumor-infiltrating MDSCs. As predicted from our gene expression analysis, splenic Gr-1+ CD11b+ cells from neither MT nor WT mice could suppress T cell proliferation at any dilution (Fig. 4C and data not shown). These results suggest that only Gr-1+ CD11b+ cells associated with prostate cancer initiation and progression have immune-suppressive activity, although we cannot rule out the possible immune-suppressive potential of prostatic Gr-1+ CD11b+ cells isolated from WT prostate because of their rarity. Consistent with these findings, we found that CD8+ T cell numbers were transiently increased in precancer mPIN lesions but were reduced during cancer progression, inversely following the curve of MDSC expansion in vivo in MT prostates (Fig. 4D, left). Levels of T cell activation, as measured by the percentage of CD8+ CD69+ cells within the CD45+ population, spiked at the mPIN lesion stage but subsequently decreased as the disease progressed and MDSC numbers and suppressive activity increased (Fig. 4D, right).
Prostate-specific MDSC expansion is associated with suppression of dendritic cell and macrophage maturation.
In addition to suppressing T cell proliferation, MDSCs also produce cytokines known to suppress DC and macrophage maturation (4, 5, 33). Therefore, we evaluated the maturation status of both infiltrating DCs and macrophages in the MT prostate as a function of disease progression. Although mature CD11c+ MHCII+ DCs were present throughout all stages of disease, their relative percentages in the CD45+ population decreased precipitously during disease progression (36% ± 3.0% in mPIN lesions versus 17% ± 6.5% at the cancer stage) (Fig. 5A, left). This reduction in the number of mature DCs was accompanied by a relative increase in the number of immature CD11c+ MHCII− cells during the same progression period (9.7% ± 1.7% versus 23.4% ± 4.6%) (Fig. 5A, right), suggesting that the maturation of antigen-presenting cells (APCs) may be suppressed by the expansion and/or local cytokine production of MDSCs in the prostate. Similarly, macrophage F4/80 expression shifted away from a mature F4/80int/high phenotype to an immature F4/80low phenotype as the disease progressed (Fig. 5B). In order to understand how prostatic MDSCs may suppress DC and macrophage maturation, we looked at the expression of IL-10, which has been demonstrated to not only polarize F4/80hi M1 macrophages to an F4/80lo M2 phenotype (4) but also reduce DC maturation and DC-mediated activation of T cells through various mechanisms (6, 34, 35). Indeed, the Il10 mRNA expression level was significantly elevated in prostatic Gr-1+ CD11b+ cells isolated from MT mice compared to the levels in cells isolated from spleen (P < 0.01) and BM (P < 0.001) of the same tumor-bearing animals (Fig. 5C). Not surprisingly, MHCII expression on DCs has also been shown to be inhibited by CSF-1 (36), which may further contribute to an immune-suppressive tumor microenvironment that prevents proper T cell activation. Therefore, the suppression of innate immune cell maturation by MDSC-derived IL-10 and tumor prostatic epithelial cell-derived CSF-1 is yet another mechanism by which prostate tumor-specific MDSCs may inhibit T cell functions.
FIG 5.

Prostate-specific Gr-1+ CD11b+ cell expansion is associated with suppression of dendritic cell and macrophage maturation. (A, left) Mature CD11c+ MHCII+ dendritic cells are present in both wild-type and mutant prostates, but their levels decrease precipitously in mutant animals as the disease progresses. (Right) Levels of immature CD11c+ MHCII− DCs increase in mutant prostates as the disease progresses. (B) Macrophage F4/80 expression shifts away from a mature F4/80int/high phenotype to an immature F4/80low phenotype as the disease progresses. (For panels A and B, data are means ± standard errors of the means from a minimum of 4 animals per age/genotype.) (C) The IL10 gene expression level increased in sorted Gr-1+ CD11b+ cells from the prostate, compared to levels in cells from the spleen and BM of MT mice. The relative gene expression level for each sample was normalized to the values for WT BM (n = 5). *, P < 0.05; **, P < 0.01; ***, P < 0.001.
The selective CSF-1 receptor inhibitor GW2580 reduces MDSC infiltration and reverses the immune-suppressive phenotype.
Csf1 mRNA is overexpressed in the prostate epithelium of Pten null mice as well as in epithelial cell lines derived from the Pten null prostate cancer model (Fig. 3C, left and middle) (14). In order to determine whether CSF-1 indeed plays an essential role in MDSC infiltration and prostate cancer development, we treated a cohort of MT animals with the selective CSF-1 receptor antagonist GW2580 (22, 37, 38) daily for 3 weeks, starting at 6 weeks of age. Prostate, draining lymph nodes, and spleen were collected at the end of treatment and processed for analysis. Histopathological examination revealed significant differences between vehicle- and GW2580-treated cohorts (n = 6) within the stromal and epithelial compartments. Stromal reactivity and the desmoplastic response were noticeably reduced in the tumors of GW2580-treated animals compared to age-matched vehicle-treated MT animals (Fig. 6A, left). GW2580 treatment significantly reduced basement membrane degradation and local invasion, as evidenced by strong α-SMA-positive staining (Fig. 6A, middle). In addition, the Ki67 proliferation indices of the epithelial and stromal compartments were significantly reduced by 2- and 3-fold, respectively, in GW2580-treated animals (Fig. 6B). This was accompanied by a significant reduction in p-CSF-1R+ cells in the stromal compartment (Fig. 6A, right, and C), verifying that the drug indeed modulated its target.
FIG 6.

The selective CSF-1 receptor inhibitor GW2580 reduces Gr-1+ CD11b+ cell infiltration and reverses the immune-suppressive phenotype. (A, left) Stromal reactivity and the desmoplastic response are reduced in the prostates of GW2580-treated animals. (Middle) Invasive adenocarcinoma, as measured by SMA breakdown, is diminished in the prostates of GW2580-treated animals. (Right) Numbers of p-CSFR-1+ cells are greatly reduced in the stroma of GW2580-treated prostates. (B) Epithelial and stromal cell Ki67 proliferation indices are reduced following GW2580 treatment. (C) Quantification of stromal p-CSF-1R+ cells demonstrates a significant decrease in the percentage of p-CSF-1R+ cells following GW2580 treatment. (D) GW2580 treatment alleviates immune-suppressive phenotypes associated with MDSC expansion. Values are represented as fold changes between GW2580- and vehicle-treated MT mice. For panels B to D, there were 6 animals per treatment group; for panels B and C, there were a minimum of 10 high-power microscopic fields/animal. *, P < 0.05; **, P < 0.01; ***, P < 0.001. Macs, macrophages.
Quantitative FACS analysis of prostate tissue demonstrated a significant reduction in the number of tumor-infiltrating CD45+ cells as well as an almost 3-fold reduction in the number of Gr-1+ CD11b+ MDSCs in GW2580-treated mice (Fig. 6D). Consistent with our previous results showing that localized MDSC expansion leads to an immune-suppressive state, inhibition of CSF-1R signaling led to an increase in the number of mature MHCII+ DCs, as well as mature F4/80int/high macrophages, within the prostate of treated animals (Fig. 6D). Activated CD4+ and CD8+ T cell numbers also increased after GW2580 treatment (Fig. 6D). These results suggest that GW2580 can inhibit epithelial cell-associated CSF-1 signaling, reduce MDSC expansion, and alleviate the immune-suppressive microenvironment.
DISCUSSION
Similar to human prostate cancer development, the Pten null murine prostate cancer model progresses through distinct stages of disease, including mPIN and localized invasive adenocarcinoma, providing unique and advantageous windows to investigate early events associated with prostate cancer initiation and progression. Using this model, we sought to study how epithelial cell-associated tumor initiation events cross talk with inflammatory cells and orchestrate prostate cancer development. Our work shows that in addition to increased cell proliferation, survival, and motility imposed by the loss of PTEN in prostate epithelial cells (12), the changes in inflammatory gene expression as a result of PTEN loss profoundly influence immune cell infiltration and immune-suppressive activities, which in turn promote cancer progression (Fig. 7).
FIG 7.

Cross talk between epithelial cell-associated tumor-initiating events and inflammatory cells facilitates prostate cancer progression. Epithelial cell Pten loss leads to the upregulation of genes associated with inflammatory response and cytokine-cytokine receptor interaction pathways. Increased cytokine production by Pten null epithelial cells, including CSF-1 and IL-1β production, leads to the recruitment and expansion of MDSCs, which in turn facilitate an immune-suppressive environment and promote tumor progression through the secretion of Arg1, iNOS, and IL-10. Inhibiting immune-responsive pathways, through the use of compounds like GW2580, can decrease immune cell recruitment, alleviate the immune-suppressive environment, delay tumor progression, and potentiate immunotherapeutic modalities. Mac, macrophage.
We found that concomitant with mPIN formation, there was a significant expansion of Gr-1+ CD11b+ MDSCs in the prostate, accompanied by decreased DC and macrophage maturation (Fig. 7). In contrast to the majority of reports, which used xenograft and allograft models (19, 39, 40), our endogenous model indicates that MDSC expansion occurs solely in the prostate during disease initiation and progression. There is no significant expansion of Gr-1+ CD11b+ cells in the lymph nodes, spleen, liver, or bone marrow of these same tumor-bearing mice. Gr-1+ CD11b+ cells from these hematopoietic organs do not show T cell-suppressive activities and MDSC gene expression signatures, such as increased expression levels of arginase 1 and iNOS. These results suggest that MDSC infiltration and expansion in the prostate following the initial oncogenic insult are likely triggered by localized stimuli from the epithelium. Indeed, analysis of gene expression alterations demonstrated the upregulation of inflammatory response genes and cytokine-cytokine receptor interaction pathways in Pten null epithelial cells. This localized cytokine release, including CSF-1 production by Pten null epithelial cells, likely contributes to the recruitment and maintenance of infiltrating myeloid cells, as was similarly observed for other epithelial cell cancers (6, 41–43). A concomitant increase in the level of Csf1r mRNA in infiltrating Gr-1+ CD11b+ MDSCs suggests an autocrine pathway for the propagation of immunosuppressive signals. Similarly, increased IL-1β production likely promotes the immunosuppressive activities of tumor-associated MDSCs through stimulating their Arg1, iNOS, and IL-10 production. The resultant increase in the Il1ra mRNA expression level, again, in infiltrating Gr-1+ CD11b+ MDSCs further supports the notion that immunosuppressive inflammatory signals are self-propagating and confirms previous observations of similar bidirectional cross talk between MDSCs and tumor cells within the microenvironment (5). Our results are also consistent with recent work by Haverkamp and colleagues, who demonstrated an immediate and enhanced immune-suppressive ability of MDSCs in local inflammatory sites compared to Gr-1+ CD11b+ cells present at peripheral tissues (44). It can now be appreciated, through our work and the work of Haverkamp et al. and others, that there are important functional differences between Gr-1+ CD11b+ MDSCs that infiltrate tumors and the Gr-1+ CD11b+ cells in the peripheral tissues.
The localized immune-suppressive conditions also suggest a difference between inflammatory conditions induced by spontaneous cancer models and those incited by subcutaneous or orthotopic xenograft models with established cancer cell lines. Although expansion of MDSCs in peripheral organs was largely absent from our studies, possibly due to the spontaneous nature of the initial insult and the early stage of cancer development, work by other groups has shown the expansion and immune-suppressive activities of MDSCs isolated from hematopoietic and nonhematopoietic organs of xenograft models (17, 45). Since most transplanted tumor models are of an aggressive nature with fast kinetics, the expansion and activation of MDSCs at hematopoietic and nonhematopoietic sites in these models may more closely resemble late stages of human disease.
The recent U.S. Food and Drug Administration approval of sipuleucel-T, a first-of-its-kind cancer vaccine for antigen-specific immunotherapy, uses a patient's own immature monocytes that have been exogenously stimulated and matured in order to mount an antitumor response. Although phase III clinical trial results showed improved survival when comparing sipuleucel-T and conventional therapy, disease-free progression was not changed significantly (46, 47). Our study suggests that immune-suppressive mechanisms mediated by MDSCs within the local tumor environment are directly influenced by epithelial cell-associated tumor-initiating events. Therefore, cotargeting of tumor-associated MDSCs and epithelial cell-mediated paracrine pathways may alleviate the immune-suppressive environment and benefit prostate cancer immunotherapy. Treatment of prostate-tumor-bearing mice with the selective CSF-1 receptor inhibitor GW2580 demonstrated that interrupting an epithelial cell-associated signaling cascade that drives MDSC infiltration to the tumor site can have ameliorative effects not only on tumor growth kinetics but also on the immune-suppressive status of the microenvironment. Our preclinical study clearly demonstrates the potential benefits of using this and similar therapies to alleviate the immunosuppressive and tumor-tolerant environments imposed by infiltrating MDSCs.
ACKNOWLEDGMENTS
We thank colleagues in our laboratories for suggestions and comments. We thank Dapei Li for microdissection assistance and Ilsa Coleman for assistance with the analysis of microarray data.
A.J.G. was supported by an NIH minority supplement award (R01 CA107166S); M.R. and L.M.T. were supported by NIH grant T32 CA009056. This work has been supported in part by awards from the Prostate Cancer Foundation (to H.W. and P.S.N.), a DOD idea development award (to H.W.), and grants from the NIH (R01 CA107166 and RO1 CA121110 to H.W., UO1 CA164188 to H.W. and P.S.N., R01 CA165573 P.S.N., and P50CA097186 to P.S.N.).
We have no conflicting interests to disclose.
Footnotes
Published ahead of print 24 March 2014
REFERENCES
- 1.Qian BZ, Pollard JW. 2010. Macrophage diversity enhances tumor progression and metastasis. Cell 141:39–51. 10.1016/j.cell.2010.03.014 [DOI] [PMC free article] [PubMed] [Google Scholar]
- 2.Grivennikov SI, Greten FR, Karin M. 2010. Immunity, inflammation, and cancer. Cell 140:883–899. 10.1016/j.cell.2010.01.025 [DOI] [PMC free article] [PubMed] [Google Scholar]
- 3.Chow A, Brown BD, Merad M. 2011. Studying the mononuclear phagocyte system in the molecular age. Nat. Rev. Immunol. 11:788–798. 10.1038/nri3087 [DOI] [PubMed] [Google Scholar]
- 4.Sinha P, Clements VK, Bunt SK, Albelda SM, Ostrand-Rosenberg S. 2007. Cross-talk between myeloid-derived suppressor cells and macrophages subverts tumor immunity toward a type 2 response. J. Immunol. 179:977–983 http://www.jimmunol.org/content/179/2/977.long [DOI] [PubMed] [Google Scholar]
- 5.Ostrand-Rosenberg S, Sinha P, Beury DW, Clements VK. 2012. Cross-talk between myeloid-derived suppressor cells (MDSC), macrophages, and dendritic cells enhances tumor-induced immune suppression. Semin. Cancer Biol. 22:275–281. 10.1016/j.semcancer.2012.01.011 [DOI] [PMC free article] [PubMed] [Google Scholar]
- 6.Mantovani M, Allavena P, Sica A, Balkwill F. 2008. Cancer-related inflammation. Nature 454:436–444. 10.1038/nature07205 [DOI] [PubMed] [Google Scholar]
- 7.Almand B, Clark JI, Nikitina E, van Beynen J, English NR, Knight SC, Carbone DP, Gabrilovich DI. 2001. Increased production of immature myeloid cells in cancer patients: a mechanism of immunosuppression in cancer. J. Immunol. 166:678–689 http://www.jimmunol.org/content/166/1/678.long [DOI] [PubMed] [Google Scholar]
- 8.Serafini P, Mgebroff S, Noonan K, Borrello I. 2008. Myeloid-derived suppressor cells promote cross-tolerance in B-cell lymphoma by expanding regulatory T cells. Cancer Res. 68:5439–5449. 10.1158/0008-5472.CAN-07-6621 [DOI] [PMC free article] [PubMed] [Google Scholar]
- 9.Li H, Han Y, Guo Q, Zhang M, Cao X. 2009. Cancer-expanded myeloid-derived suppressor cells induce anergy of NK cells through membrane-bound TGF-beta 1. J. Immunol. 182:240–249 http://www.jimmunol.org/content/182/1/240.long [DOI] [PubMed] [Google Scholar]
- 10.Sfanos KS, De Marzo AM. 2012. Prostate cancer and inflammation: the evidence. Histopathology 60:199–215. 10.1111/j.1365-2559.2011.04033.x [DOI] [PMC free article] [PubMed] [Google Scholar]
- 11.Nelson WG, De Marzo AM, DeWeese TL, Isaacs WB. 2004. The role of inflammation in the pathogenesis of prostate cancer. J. Urol. 172:S6–S11; discussion S11–S12. 10.1097/01.ju.0000142058.99614.ff [DOI] [PubMed] [Google Scholar]
- 12.Wang S, Gao J, Lei Q, Rozengurt N, Pritchard C, Jiao J, Thomas GV, Li G, Roy-Burman P, Nelson PS, Liu C, Wu H. 2003. Prostate-specific deletion of the murine Pten tumor suppressor gene leads to metastatic prostate cancer. Cancer Cell 4:209–221. 10.1016/S1535-6108(03)00215-0 [DOI] [PubMed] [Google Scholar]
- 13.Bianchi-Frias D, Vakar-Lopez F, Coleman IM, Plymate SR, Reed MJ, Nelson PS. 2010. The effects of aging on the molecular and cellular composition of the prostate microenvironment. PLoS One 5:e12501. 10.1371/journal.pone.0012501 [DOI] [PMC free article] [PubMed] [Google Scholar]
- 14.Jiao J, Wang S, Qiao R, Vivanco I, Watson PA, Sawyers CL, Wu H. 2007. Murine cell lines derived from Pten null prostate cancer show the critical role of PTEN in hormone refractory prostate cancer development. Cancer Res. 67:6083–6091. 10.1158/0008-5472.CAN-06-4202 [DOI] [PubMed] [Google Scholar]
- 15.Subramanian A, Tamayo P, Mootha VK, Mukherjee S, Ebert BL, Gillette MA, Paulovich A, Pomeroy SL, Golub TR, Lander ES, Mesirov JP. 2005. Gene set enrichment analysis: a knowledge-based approach for interpreting genome-wide expression profiles. Proc. Natl. Acad. Sci. U. S. A. 102:15545–15550. 10.1073/pnas.0506580102 [DOI] [PMC free article] [PubMed] [Google Scholar]
- 16.Benjamini Y, Hochberg Y. 1995. Controlling the false discovery rate: a practical and powerful approach to multiple testing. J. R. Stat. Soc. B 57:289–300 [Google Scholar]
- 17.Ilkovitch D, Lopez DM. 2009. The liver is a site for tumor-induced myeloid-derived suppressor cell accumulation and immunosuppression. Cancer Res. 69:5514–5521. 10.1158/0008-5472.CAN-08-4625 [DOI] [PMC free article] [PubMed] [Google Scholar]
- 18.Sfanos KS, Bruno TC, Maris CH, Xu L, Thoburn CJ, DeMarzo AM, Meeker AK, Isaacs WB, Drake CG. 2008. Phenotypic analysis of prostate-infiltrating lymphocytes reveals TH17 and Treg skewing. Clin. Cancer Res. 14:3254–3261. 10.1158/1078-0432.CCR-07-5164 [DOI] [PMC free article] [PubMed] [Google Scholar]
- 19.Youn JI, Nagaraj S, Collazo M, Gabrilovich DI. 2008. Subsets of myeloid-derived suppressor cells in tumor-bearing mice. J. Immunol. 181:5791–5802 http://www.jimmunol.org/content/181/8/5791.long [DOI] [PMC free article] [PubMed] [Google Scholar]
- 20.Taylor BS, Schultz N, Hieronymus H, Gopalan A, Xiao Y, Carver BS, Arora VK, Kaushik P, Cerami E, Reva B, Antipin Y, Mitsiades N, Landers T, Dolgalev I, Major JE, Wilson M, Socci ND, Lash AE, Heguy A, Eastham JA, Scher HI, Reuter VE, Scardino PT, Sander C, Sawyers CL, Gerald WL. 2010. Integrative genomic profiling of human prostate cancer. Cancer Cell 18:11–22. 10.1016/j.ccr.2010.05.026 [DOI] [PMC free article] [PubMed] [Google Scholar]
- 21.Kusmartsev S, Cheng F, Yu B, Nefedova Y, Sotomayor E, Lush R, Gabrilovich D. 2003. All-trans-retinoic acid eliminates immature myeloid cells from tumor-bearing mice and improves the effect of vaccination. Cancer Res. 63:4441–4449 http://cancerres.aacrjournals.org/content/63/15/4441.long [PubMed] [Google Scholar]
- 22.Priceman SJ, Sung JL, Shaposhnik Z, Burton JB, Torres-Collado AX, Moughon DL, Johnson M, Lusis AJ, Cohen DA, Iruela-Arispe ML, Wu L. 2010. Targeting distinct tumor-infiltrating myeloid cells by inhibiting CSF-1 receptor: combating tumor evasion of antiangiogenic therapy. Blood 115:1461–1471. 10.1182/blood-2009-08-237412 [DOI] [PMC free article] [PubMed] [Google Scholar]
- 23.Menetrier-Caux C, Montmain G, Dieu MC, Bain C, Favrot MC, Caux C, Blay JY. 1998. Inhibition of the differentiation of dendritic cells from CD34(+) progenitors by tumor cells: role of interleukin-6 and macrophage colony-stimulating factor. Blood 92:4778–4791 [PubMed] [Google Scholar]
- 24.Aharinejad S, Paulus P, Sioud M, Hofmann M, Zins K, Schafer R, Stanley ER, Abraham D. 2004. Colony-stimulating factor-1 blockade by antisense oligonucleotides and small interfering RNAs suppresses growth of human mammary tumor xenografts in mice. Cancer Res. 64:5378–5384. 10.1158/0008-5472.CAN-04-0961 [DOI] [PubMed] [Google Scholar]
- 25.Lin EY, Nguyen AV, Russell RG, Pollard JW. 2001. Colony-stimulating factor 1 promotes progression of mammary tumors to malignancy. J. Exp. Med. 193:727–740. 10.1084/jem.193.6.727 [DOI] [PMC free article] [PubMed] [Google Scholar]
- 26.Elkabets M, Ribeiro VS, Dinarello CA, Ostrand-Rosenberg S, Di Santo JP, Apte RN, Vosshenrich CA. 2010. IL-1beta regulates a novel myeloid-derived suppressor cell subset that impairs NK cell development and function. Eur. J. Immunol. 40:3347–3357. 10.1002/eji.201041037 [DOI] [PMC free article] [PubMed] [Google Scholar]
- 27.Tu S, Bhagat G, Cui G, Takaishi S, Kurt-Jones EA, Rickman B, Betz KS, Penz-Oesterreicher M, Bjorkdahl O, Fox JG, Wang TC. 2008. Overexpression of interleukin-1beta induces gastric inflammation and cancer and mobilizes myeloid-derived suppressor cells in mice. Cancer Cell 14:408–419. 10.1016/j.ccr.2008.10.011 [DOI] [PMC free article] [PubMed] [Google Scholar]
- 28.Song X, Krelin Y, Dvorkin T, Bjorkdahl O, Segal S, Dinarello CA, Voronov E, Apte RN. 2005. CD11b+/Gr-1+ immature myeloid cells mediate suppression of T cells in mice bearing tumors of IL-1beta-secreting cells. J. Immunol. 175:8200–8208 http://www.jimmunol.org/content/175/12/8200.long [DOI] [PubMed] [Google Scholar]
- 29.Condamine T, Gabrilovich DI. 2011. Molecular mechanisms regulating myeloid-derived suppressor cell differentiation and function. Trends Immunol. 32:19–25. 10.1016/j.it.2010.10.002 [DOI] [PMC free article] [PubMed] [Google Scholar]
- 30.Bronte V, Serafini P, De Santo C, Marigo I, Tosello V, Mazzoni A, Segal DM, Staib C, Lowel M, Sutter G, Colombo MP, Zanovello P. 2003. IL-4-induced arginase 1 suppresses alloreactive T cells in tumor-bearing mice. J. Immunol. 170:270–278 http://www.jimmunol.org/content/170/1/270.long [DOI] [PubMed] [Google Scholar]
- 31.Gabrilovich DI, Ostrand-Rosenberg S, Bronte V. 2012. Coordinated regulation of myeloid cells by tumours. Nat. Rev. Immunol. 12:253–268. 10.1038/nri3175 [DOI] [PMC free article] [PubMed] [Google Scholar]
- 32.Cederbaum SD, Yu H, Grody WW, Kern RM, Yoo P, Iyer RK. 2004. Arginases I and II: do their functions overlap? Mol. Genet. Metab. 81(Suppl 1):S38–S44. 10.1016/j.ymgme.2003.10.012 [DOI] [PubMed] [Google Scholar]
- 33.Chen DS, Mellman I. 2013. Oncology meets immunology: the cancer-immunity cycle. Immunity 39:1–10. 10.1016/j.immuni.2013.07.012 [DOI] [PubMed] [Google Scholar]
- 34.Hu CE, Gan J, Zhang RD, Cheng YR, Huang GJ. 2011. Up-regulated myeloid-derived suppressor cell contributes to hepatocellular carcinoma development by impairing dendritic cell function. Scand. J. Gastroenterol. 46:156–164. 10.3109/00365521.2010.516450 [DOI] [PubMed] [Google Scholar]
- 35.Vicari AP, Chiodoni C, Vaure C, Ait-Yahia S, Dercamp C, Matsos F, Reynard O, Taverne C, Merle P, Colombo MP, O'Garra A, Trinchieri G, Caux C. 2002. Reversal of tumor-induced dendritic cell paralysis by CpG immunostimulatory oligonucleotide and anti-interleukin 10 receptor antibody. J. Exp. Med. 196:541–549. 10.1084/jem.20020732 [DOI] [PMC free article] [PubMed] [Google Scholar]
- 36.Tagliani E, Shi C, Nancy P, Tay CS, Pamer EG, Erlebacher A. 2011. Coordinate regulation of tissue macrophage and dendritic cell population dynamics by CSF-1. J. Exp. Med. 208:1901–1916. 10.1084/jem.20110866 [DOI] [PMC free article] [PubMed] [Google Scholar]
- 37.Conway JG, McDonald B, Parham J, Keith B, Rusnak DW, Shaw E, Jansen M, Lin P, Payne A, Crosby RM, Johnson JH, Frick L, Lin MH, Depee S, Tadepalli S, Votta B, James I, Fuller K, Chambers TJ, Kull FC, Chamberlain SD, Hutchins JT. 2005. Inhibition of colony-stimulating-factor-1 signaling in vivo with the orally bioavailable cFMS kinase inhibitor GW2580. Proc. Natl. Acad. Sci. U. S. A. 102:16078–16083. 10.1073/pnas.0502000102 [DOI] [PMC free article] [PubMed] [Google Scholar]
- 38.Karaman MW, Herrgard S, Treiber DK, Gallant P, Atteridge CE, Campbell BT, Chan KW, Ciceri P, Davis MI, Edeen PT, Faraoni R, Floyd M, Hunt JP, Lockhart DJ, Milanov ZV, Morrison MJ, Pallares G, Patel HK, Pritchard S, Wodicka LM, Zarrinkar PP. 2008. A quantitative analysis of kinase inhibitor selectivity. Nat. Biotechnol. 26:127–132. 10.1038/nbt1358 [DOI] [PubMed] [Google Scholar]
- 39.Abe F, Dafferner AJ, Donkor M, Westphal SN, Scholar EM, Solheim JC, Singh RK, Hoke TA, Talmadge JE. 2010. Myeloid-derived suppressor cells in mammary tumor progression in FVB Neu transgenic mice. Cancer Immunol. Immunother. 59:47–62. 10.1007/s00262-009-0719-2 [DOI] [PMC free article] [PubMed] [Google Scholar]
- 40.Donkor MK, Lahue E, Hoke TA, Shafer LR, Coskun U, Solheim JC, Gulen D, Bishay J, Talmadge JE. 2009. Mammary tumor heterogeneity in the expansion of myeloid-derived suppressor cells. Int. Immunopharmacol. 9:937–948. 10.1016/j.intimp.2009.03.021 [DOI] [PubMed] [Google Scholar]
- 41.Patsialou A, Wyckoff J, Wang Y, Goswami S, Stanley ER, Condeelis JS. 2009. Invasion of human breast cancer cells in vivo requires both paracrine and autocrine loops involving the colony-stimulating factor-1 receptor. Cancer Res. 69:9498–9506. 10.1158/0008-5472.CAN-09-1868 [DOI] [PMC free article] [PubMed] [Google Scholar]
- 42.Denardo DG, Brennan DJ, Rexhepaj E, Ruffell B, Shiao SL, Madden SF, Gallagher WM, Wadhwani N, Keil SD, Junaid SA, Rugo HS, Hwang ES, Jirstrom K, West BL, Coussens LM. 2011. Leukocyte complexity predicts breast cancer survival and functionally regulates response to chemotherapy. Cancer Discov. 1:54–67. 10.1158/2159-8274.CD-10-0028 [DOI] [PMC free article] [PubMed] [Google Scholar]
- 43.Balkwill F, Mantovani A. 2001. Inflammation and cancer: back to Virchow? Lancet 357:539–545. 10.1016/S0140-6736(00)04046-0 [DOI] [PubMed] [Google Scholar]
- 44.Haverkamp JM, Charbonneau B, Crist SA, Meyerholz DK, Cohen MB, Snyder PW, Svensson RU, Henry MD, Wang HH, Ratliff TL. 2011. An inducible model of abacterial prostatitis induces antigen specific inflammatory and proliferative changes in the murine prostate. Prostate 71:1139–1150. 10.1002/pros.21327 [DOI] [PMC free article] [PubMed] [Google Scholar]
- 45.Kusmartsev SA, Li Y, Chen SH. 2000. Gr-1+ myeloid cells derived from tumor-bearing mice inhibit primary T cell activation induced through CD3/CD28 costimulation. J. Immunol. 165:779–785 http://www.jimmunol.org/content/165/2/779.long [DOI] [PubMed] [Google Scholar]
- 46.Small EJ, Schellhammer PF, Higano CS, Redfern CH, Nemunaitis JJ, Valone FH, Verjee SS, Jones LA, Hershberg RM. 2006. Placebo-controlled phase III trial of immunologic therapy with sipuleucel-T (APC8015) in patients with metastatic, asymptomatic hormone refractory prostate cancer. J. Clin. Oncol. 24:3089–3094. 10.1200/JCO.2005.04.5252 [DOI] [PubMed] [Google Scholar]
- 47.Higano CS, Schellhammer PF, Small EJ, Burch PA, Nemunaitis J, Yuh L, Provost N, Frohlich MW. 2009. Integrated data from 2 randomized, double-blind, placebo-controlled, phase 3 trials of active cellular immunotherapy with sipuleucel-T in advanced prostate cancer. Cancer 115:3670–3679. 10.1002/cncr.24429 [DOI] [PubMed] [Google Scholar]