

Abstract
Cynomolgus macaques infected with low-dose Mycobacterium tuberculosis develop both active tuberculosis and latent infection similar to those of humans, providing an opportunity to study the clinically silent early events in infection. 18Fluorodeoxyglucose radiotracer with positron emission tomography coregistered with computed tomography (FDG PET/CT) provides a noninvasive method to measure disease progression. We sought to determine temporal patterns of granuloma evolution that distinguished active-disease and latent outcomes. Macaques (n = 10) were infected with low-dose M. tuberculosis with FDG PET/CT performed during infection. At 24 weeks postinfection, animals were classified as having active disease (n = 3) or latent infection (n = 6), with one “percolator” monkey. Imaging characteristics (e.g., lesion number, metabolic activity, size, mineralization, and distribution of lesions) were compared among active and latent groups. As early as 3 weeks postinfection, more pulmonary granulomas were observed in animals that would later develop active disease than in those that would develop latent infection. Over time, new lesions developed in active-disease animals but not in latent animals. Granulomas and mediastinal lymph nodes from active-disease but not latent animals consistently increased in metabolic activity at early time points. The presence of fewer lesions at 3 weeks and the lack of new lesion development in animals with latent infection suggest that innate and rapid adaptive responses are critical to preventing active tuberculosis. A greater emphasis on innate responses and/or rapid recruitment of adaptive responses, especially in the airway, should be emphasized in newer vaccine strategies.
INTRODUCTION
The success of Mycobacterium tuberculosis as a human pathogen is underscored by the fact that one-third of the world's population is infected with the bacillus. The majority (90%) of humans infected with M. tuberculosis develop latent infection, an asymptomatic state, while the remaining will develop active tuberculosis (TB). In 2012, there were 8.6 million new cases of active TB and 1.3 million deaths worldwide (1). Little is known about what specific events in the course of infection lead to the outcomes of active disease or latent infection, which impedes development of new strategies to prevent infection and disease.
Tuberculous lesions can be detected by 18F-fluorodeoxyglucose with positron emission tomography coregistered with computed tomography (FDG PET/CT) in several animal models of tuberculosis, including the nonhuman primate, although this has mostly been reported in the context of drug efficacy studies (2–4). The use of PET/CT facilitates real-time, serial in vivo assessments of disease progression without the need for sacrificing experimental animals. After low-dose intrabronchial inoculation of M. tuberculosis, cynomolgus macaques develop both active and latent states of infection similar to those of humans (5, 6). Here, we used serial PET/CT imaging to quantify differences in evolution of lesions (granulomas) in animals that developed latent infection or active TB. These data strongly support that early events are crucial in determining the outcome of infection; thus, they will be important targets for immunologic interventions.
MATERIALS AND METHODS
M. tuberculosis infection in cynomolgus macaques.
Adult cynomolgus macaques (Macaca fascicularis) were infected via bronchoscopic inoculation of low-dose M. tuberculosis (Erdman strain; ∼16 CFU per animal) directly into the airway of the lower lobe after standard screening and quarantine practices (5, 6). During the course of infection, animals were monitored clinically, microbiologically (growth of M. tuberculosis by gastric aspirate [GA] and bronchoalveolar lavage [BAL] specimens), and for inflammatory state (erythrocyte sedimentation rate [ESR]) as previously described (5, 6). Six months after infection, animals were classified as having latent or active disease based on previously established criteria (5, 6). Briefly, macaques with latent infection had no clinical signs of active TB, with normal ESR, and no growth of M. tuberculosis on GA or BAL specimens beyond 2 months postinfection. Animals with active TB showed clinical signs of disease, growth of M. tuberculosis by GA or BAL specimens, and/or elevated ESR. Using these criteria, animals with active disease have more gross pathology, greater overall bacterial burden, and more bacterial dissemination than latent animals, as previously published (6). Once clinical classifications were made, imaging patterns were compared at each time point to determine whether there were differences among latent and active TB. All procedures and protocols were approved by the University of Pittsburgh's Institution for Animal Care and Use Committee.
FDG PET/CT imaging.
Serial 2-deoxy-2-[18F]-d-deoxyglucose (FDG) PET imaging with CT was performed using a microPET Focus 220 preclinical PET scanner (Siemens Molecular Solutions, Knoxville, TN) and a clinical 8-slide helical CT scanner (Neurologica Corp., Danvers, MA) in a biosafety level 3 facility as previously described (4). Lesions were identified by our analyst (M. T. Coleman) and measured in size by CT (based on an axial view of the lesion). A region of interest was drawn on the PET image in the axial view to measure metabolic activity (FDG avidity) by SUV (standard uptake volume ratio adjusted by size and normalized to muscle to reduce the variability between scans) as described previously (4). Scans were performed at baseline and 3, 6, 8, 12, 16, 20, and 24 weeks postinfection. All CT/PET measurements were made by the same imaging analyst (M. T. Coleman).
Statistical analysis.
Comparative analysis between latent and active groups of animals was performed without the data from the so-called percolator animal, as percolator animals might represent a different evolution of disease. (However, results were the same when the percolator animal was added to the latent group.) Statistical analysis was performed by pairwise analysis among active and latent groups of animals by Student's t test for normally distributed data and Mann-Whitney test for nonparametric data. Pairwise analysis for matched data was performed using the Wilcoxon rank-sum test.
RESULTS
Macaques develop variable disease patterns by PET/CT after M. tuberculosis infection.
Serial scans from baseline to 6 months after infection were analyzed in the context of their infection outcome. Of the 10 animals infected, 3 developed active disease and 6 developed classic latent infection, defined clinically as previously described (5). One animal (9811) had no signs of active disease, but M. tuberculosis was cultured from occasional GA samples 3 months postinfection, putting it into the percolator category that has been seen in macaques (5) and humans (7, 8). Percolators likely represent one part of the spectrum of latent infection (subclinical disease) in which intermittent shedding of M. tuberculosis occurs in asymptomatic individuals (5, 9). Of the 3 animals with active disease, one animal (9611) developed miliary disease at 3 months postinfection and was euthanized.
In this cohort of 10 animals, the first lung lesions appeared at 3 weeks postinfection; these early granulomas were FDG avid and appeared in the lower lobes at the site of inoculation. In ensuing serial scans, granulomas could remain stable or increase or decrease in size and/or in FDG avidity over the course of infection. Two patterns of lesion development occurred: a stable pattern in which few new lesions developed after 3 weeks postinfection, or a dissemination pattern in which new lesions appeared either adjacent to existing lesions or in other lung lobes (Fig. 1). Individual granulomas were both dynamic (in terms of FDG avidity and size) and independent over time within the same animal and even in the same lung lobe (see Fig. S1 in the supplemental material).
FIG 1.
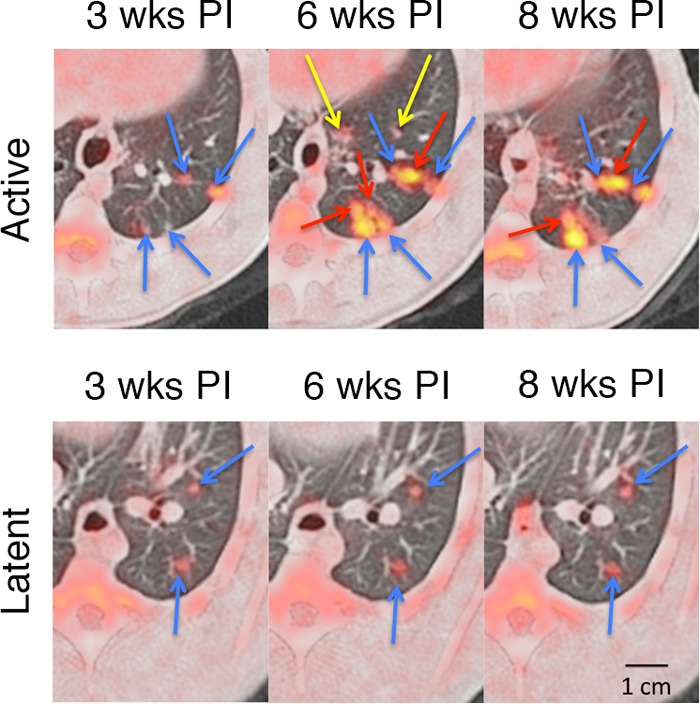
Serial FDG PET/CT images showing a disseminating and stable pattern of granuloma evolution during the course of early infection. (Top row) Primary lesions (blue arrows) were first established at 3 weeks postinfection, while new lesions developed adjacent to existing lesions (red arrows) or in new sites (yellow arrows). Animals that would later develop active TB developed more lesions during the course of infection. (Bottom row) Primary lesions (blue arrows) of latent animals usually remained stable, with few new granulomas developing through the course of infection. wks PI, weeks postinfection.
Mineralization of granulomas, often associated in the literature with contained infection (10), was observed as early as 20 weeks postinfection and was observed in both active and latent animals. By 6 months postinfection, 55% of granulomas (22 of 40) from latent animals were mineralized. In contrast, 36% (9 of 25) were mineralized in active animals, and this is likely an underestimate, as only 2 of the 3 active animals survived to 6 months. There was no association between the presence of mineralization and FDG avidity of granulomas, suggesting active metabolic changes were occurring in the presence of mineralization.
Lastly, extrapulmonary dissemination to the liver and/or spleen was observed only in the active TB animals. Two of 3 animals that would later develop active disease developed granulomas in the liver and spleen 12 to 18 weeks after infection, and these were confirmed at necropsy.
Trends in early lesion development are associated with latent and active outcomes.
To determine whether latent and active infection outcomes differed in patterns of lesion evolution, lung lesion location, number, size (separate from metabolic activity), and FDG avidity (SUV) were compared at each time point. As early as 3 weeks postinfection, a trend toward more granulomas was observed in the animals that later developed active disease compared to those that would later develop latent infection (Fig. 2) (a median of 12 for active versus a median of 7 for latent disease; P = 0.06 by Mann-Whitney test). Between 3 and 6 weeks postinfection, animals with active disease developed significantly more new lesions than latent animals (Fig. 2) (median of 8 new lesions among active-disease animals versus a median of 0.5 new lesions in latent animals; P < 0.05 by Mann-Whitney test). As a result, by 6 weeks postinfection, active-disease animals had significantly more lung granulomas than latently infected animals, and this remained true throughout the course of infection (Fig. 2) (P < 0.05 by Mann-Whitney test). In latently infected animals, the majority of lung lesions (89%) seen at 6 months after infection were already present by 3 weeks. In contrast, only 52% of the total lesions at 6 months in active-disease animals were present at 3 weeks postinfection, as animals with active disease continued to develop more granulomas throughout the course of infection.
FIG 2.
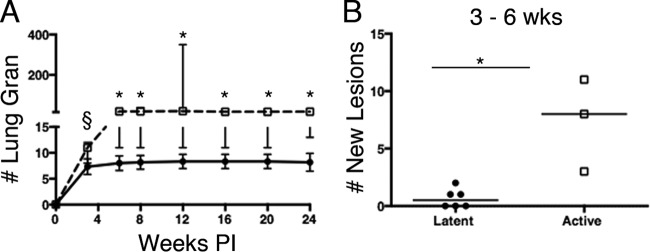
Granuloma number and metabolic activity during M. tuberculosis infection. (A) Active-disease animals (squares) had more lung granulomas (Lung Gran) than latently infected animals (circles) as early as 3 weeks after infection and throughout infection. (B) Active-disease animals had more new lesions develop between 3 and 6 weeks postinfection than did latently infected animals. Each dot represents the number of granulomas for a single animal. Bars indicate medians. P = 0.06 (§) and P < 0.05 (*) by Mann-Whitney test.
We then compared lesion-specific characteristics throughout the course of infection. Increases in FDG avidity (measured by SUV) were observed between 3 and 6 weeks postinfection in 100% of lesions from active-disease animals (Fig. 3A). In contrast, animals with latent infection had lesions that increased, decreased, or maintained the same SUV between 3 and 6 weeks postinfection (Fig. 3B). Overall, lesions from animals that later developed active TB had a greater change in SUV between 3 and 6 weeks after infection compared to lesions from animals that later developed latent infection (Fig. 3C) (P < 0.001 by Mann-Whitney test). Similar findings were observed when lesions were compared between lesions at 3 and 24 weeks postinfection (Fig. 3D) (P < 0.001 by Mann-Whitney test).
FIG 3.
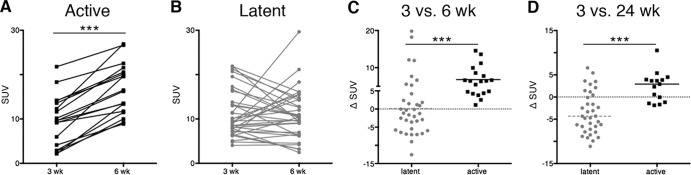
Metabolic activity of lung lesions differs between active and latent animals during early infection. (A) Individual granulomas from active-disease animals had a significant increase in metabolic activity (measured as standard uptake volume ratio [SUV]) between 3 and 6 weeks after infection. (B) Metabolic activity among individual granulomas from latent animals between 3 and 6 weeks postinfection is variable. (C) The change in metabolic activity between latent and active animals was compared. Active-disease animals had an overall increase in metabolic activity between 3 and 6 weeks. (D) Active-disease animals had an overall increase in metabolic activity between 3 and 24 weeks postinfection. Each dot represents a granuloma. Latent groups are colored gray, and active-disease groups are in black. The Wilcoxon rank-sum test was used to analyze data from panels A and B. For panels C and D, P < 0.001 (***) by Mann-Whitney test.
SUV takes into account the metabolic activity with respect to lesional size. We then analyzed size alone as an indicator of lesional progression. At 3 weeks postinfection, there was no difference in granuloma size between active-disease and latent animals (a median of 2.31 mm for active-disease animals versus a median of 2.38 mm for latently infected ones; not significant by Mann-Whitney test). Granulomas seen at 3 weeks postinfection in active-disease animals increased in size more than those of latent animals, so that by 6 weeks postinfection, lesions in active-TB animals were significantly larger than those of latently infected animals (median of 3.8 mm versus 2.5 mm, respectively; P < 0.05 by Mann-Whitney test) (see Fig. S2 in the supplemental material). These data suggest that patterns of infection (i.e., the number of lesions, change in SUV, or size) as early as 6 weeks after infection are associated with overall infection outcome, which is defined clinically.
MLNs had increased FDG avidity in animals with active TB.
The mediastinal lymph nodes (MLNs) are an important site for T cell priming and trafficking of immune cells during infection, and we have shown that they are an important bacterial reservoir during drug treatment and reactivation (11, 12). In contrast to lung granulomas (whose presence is easily detected by the contrast in soft-tissue density compared to that of air-filled lung), detection of MLNs is limited to those that are metabolically active. Three animals (1 active disease and 2 latent) had slightly elevated metabolic activity in the MLNs before infection. All animals had FDG avid MLNs by 3 weeks postinfection. The number of FDG avid mediastinal lymph nodes during the first 12 weeks postinfection between active and latent animals was similar, with a median of 4 and 3.5 per monkey, respectively. However, SUV of these lymph nodes was higher in active-disease animals at 6, 8, and 12 weeks postinfection than in latently infected animals (Fig. 4A) (P < 0.05 by Mann-Whitney test). The change in SUV of MLNs between active-disease and latent animals differed significantly between 3 and 6 weeks postinfection, increasing in active-TB animals while decreasing in latent animals (Fig. 4B) (P < 0.05 by Mann-Whitney test). While lung lesions were dynamic within the same animals during the course of infection, MLNs were less dynamic in FDG avidity (data not shown).
FIG 4.
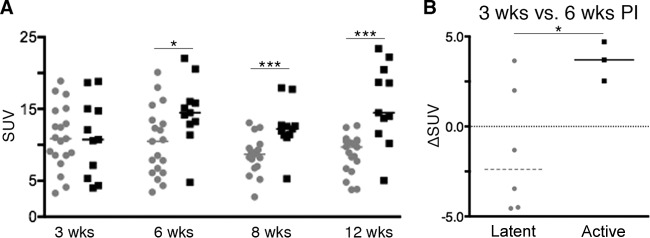
Mediastinal lymph nodes between active-disease and latent animals differ in metabolic activity. (A) Metabolic activity (measured as SUV) among active and latent groups during infection. The median SUV among lymph nodes at 6, 8, and 12 weeks postinfection was higher among active-disease animals than latently infected animals. Each dot represents a granuloma. (B) Median change in SUV between 3 and 6 weeks postinfection was higher in active-disease animals than latently infected animals. Each dot represents an animal. Latent groups are colored gray, and active-disease groups are in black. P = 0.06 (§), P < 0.05 (*), and P < 0.001 (***) by Mann-Whitney test.
DISCUSSION
In the cynomolgus macaque model, outbred animals develop either active TB or latent infection despite inoculation with the same dose and strain of M. tuberculosis. Taking advantage of this phenomenon, here we sought to better understand granuloma evolution through the course of infection and identify the changes that discriminate these outcomes of infection and when they occur. Use of PET/CT in our model as a noninvasive method of tracking M. tuberculosis infection pathology has led to major insights in our understanding of the dynamic character and progression of infection. By simply necropsying animals and assessing overall pathology and bacterial load, we were previously unable to detect the expected differences in disease outcome by 6 weeks postinfection (13). However, the increased sensitivity of PET/CT allows us to detect subtle differences in lesion number as early as 3 weeks after infection. Our data suggest that latent- and active-disease outcomes can be determined as early as 3 weeks and more definitively by 6 weeks after infection. These data are consistent with our previous observations that as early as 4 to 8 weeks postinfection, greater production of mycobacterium-specific gamma interferon (IFN-γ) from blood and airways cells was observed among macaques that would later develop active TB than for those that developed latent infection (7, 13), although there was substantial overlap in the IFN-γ production in the two groups of animals and large numbers of subjects were required to demonstrate this pattern. The current findings support our initial interpretation that the increase in IFN-γ reflects increased bacterial burden (defined here as increased numbers of granulomas or sites of infection) at these early time points. Animals that later developed active TB continued to develop new lesions in the lungs and, in some cases, in extrapulmonary sites by 12 weeks after infection.
We previously reported independent and dynamic changes in size and metabolic activity in animals infected with medium-dose M. tuberculosis that developed active tuberculosis (4). This phenomenon was also seen during low-dose infection among both active-disease and latent animals. We and others reported a loose correlation between bacterial burden and SUV and size of individual granulomas in active TB and latently infected animals at necropsy (3, 14). This range of lesional dynamics within the same host, and even lung lobe, likely accounts for the variety of granuloma types seen in our model and in humans (5, 15). The heterogeneity of granuloma types may contribute to the need for complex treatment regimens requiring multiple drugs for months. We speculate that the nonspecific uptake of FDG, which is taken up and retained in metabolically active cells, reflects inflammation that could be driven by increasing bacterial burden (especially early during the course of infection) or immune cells actively killing bacilli within the lesion. Evidence for the latter possibility is demonstrated by the fact that we can identify chromosomal equivalents of M. tuberculosis from FDG-avid, sterile granulomas during the course of infection (14). We also speculate that the increased SUV among granulomas between 3 and 6 weeks postinfection seen in active animals (Fig. 1A) reflects increasing bacterial burden for two reasons. First, we previously showed that the bacterial burden within individual granulomas peaks at about 4 weeks postinfection, with little evidence of killing within the granulomas (14). This same time point coincides with the initiation of the systemic signs of an adaptive immune response (13). Here, our data demonstrate that the numbers of initial granulomas and increasing inflammation and size in the first 6 weeks postinfection are associated with development of active TB. This strongly supports that early host-driven events are decisive in the outcome of infection.
These findings have important implications in the protection against active TB disease and vaccine development. Here, animals with latent infection were able to control infection and prevent dissemination very early (0 to 6 weeks postinfection) during the course of infection compared to those with active TB. In macaques, similar to humans, the first systemic signs of adaptive responses are measured at approximately 4 weeks postinfection (13). Thus, we speculate that differences in granuloma number as early as 3 weeks postinfection are due to innate immune responses modulating the establishment of initial infection. For example, airway factors that can be protective against active TB include alveolar macrophages, pattern recognition receptors, Toll-like receptors, surfactant proteins, and antimicrobial peptides (19–21). More creative methods of augmenting these first responders in the airway should be considered in the next generation of adjuvants and vaccines, as some authors have suggested (16, 17).
Animals with active disease developed new lung lesions between 3 and 6 weeks after infection, whereas latently infected animals did not. These data suggest that protection against development of active TB also requires a rapid and effective adaptive immune response to control bacterial dissemination. Understanding mechanisms that bridge innate and adaptive responses in the airway and lung may be an important strategy to promote bacterial killing and a brisk adaptive immune response in the lungs to control further bacterial growth and spread.
In this model, active and latent outcomes are determined at 6 months after infection based on clinical, microbiologic, radiographic, and inflammatory markers (5, 6). These criteria were developed to reflect human definitions of outcome that are very similar, although the outcome of infection generally occurs within the first 2 years after infection (18). Data regarding lesional evolution in humans does not exist, as the exact time of infection is unknown and early events are silent. In active disease, more lesions were observed over time that contributed to the increased bacterial burden seen in our model (Fig. 2). However, on a lesional level, there were no specific features of size or metabolic activity that could distinguish active or latent outcome at any given time point. These data are consistent with the notion that a spectrum of granuloma types is seen in both active TB and latent infection in this model and in humans (5, 14, 15), and this likely contributes to the complex regimen of treatment in both active-disease and latent cases. Lesion progression and development of new lesions over time, particularly early after infection, were more predictive of outcome, suggesting that PET/CT could be used as a method of assessing treatment outcome or risk of disease in humans. Clearly the advent of modern imaging modalities has the potential to improve our diagnostic and therapeutic abilities in the effort against tuberculosis.
Supplementary Material
ACKNOWLEDGMENTS
This work was supported by the Bill and Melinda Gates Foundation (Explorations Grant; principal investigator, P.L.L.).
We are indebted to Tara Rutledge, Mark Rodgers, Melanie O'Malley, Carolyn Bigbee, and Catherine Cochran for their tireless animal and laboratory technical support, as well as Charles Scanga for his assistance in coordination of support staff. We thank Eoin Jonathan Carney and Brian Lopresti for their technical assistance with the scanners. We thank Chelsea Chedrick for her technical assistance with the figures. A special thanks to JoAnne Flynn for her invaluable advice and critical review of the data and manuscript.
Footnotes
Published ahead of print 24 March 2014
Supplemental material for this article may be found at http://dx.doi.org/10.1128/IAI.01599-13.
REFERENCES
- 1.World Health Organization. 2013. Global tuberculosis report. World Health Organization, Geneva, Switzerland [Google Scholar]
- 2. Davis SL, Nuermberger EL, Um PK, Vidal C, Jedynak B, Pomper MG, Bishai WR, Jain SK. 2009. Noninvasive pulmonary [18F]-2-fluoro-deoxy-D-glucose positron emission tomography correlates with bactericidal activity of tuberculosis drug treatment. Antimicrob. Agents Chemother. 53:4879–4884. 10.1128/AAC.00789-09 [DOI] [PMC free article] [PubMed] [Google Scholar]
- 3. Via LE, Schimel D, Weiner DM, Dartois V, Dayao E, Cai Y, Yoon YS, Dreher MR, Kastenmayer RJ, Laymon CM, Carny JE, Flynn JL, Herscovitch P, Barry CE., III 2012. Infection dynamics and response to chemotherapy in a rabbit model of tuberculosis using [(1)(8)F]2-fluoro-deoxy-D-glucose positron emission tomography and computed tomography. Antimicrob. Agents Chemother. 56:4391–4402. 10.1128/AAC.00531-12 [DOI] [PMC free article] [PubMed] [Google Scholar]
- 4. Lin PL, Coleman T, Carney JP, Lopresti BJ, Tomko J, Fillmore D, Dartois V, Scanga C, Frye LJ, Janssen C, Klein E, Barry CE, III, Flynn JL. 2013. Radiologic responses in cynomolgus macaques for assessing tuberculosis chemotherapy regimens. Antimicrob. Agents Chemother. 57:4237–4244. 10.1128/AAC.00277-13 [DOI] [PMC free article] [PubMed] [Google Scholar]
- 5. Lin PL, Rodgers M, Smith L, Bigbee M, Myers A, Bigbee C, Chiosea I, Capuano SV, Fuhrman C, Klein E, Flynn JL. 2009. Quantitative comparison of active and latent tuberculosis in the cynomolgus macaque model. Infect. Immun. 77:4631–4642. 10.1128/IAI.00592-09 [DOI] [PMC free article] [PubMed] [Google Scholar]
- 6. Capuano SV, III, Croix DA, Pawar S, Zinovik A, Myers A, Lin PL, Bissel S, Fuhrman C, Klein E, Flynn JL. 2003. Experimental Mycobacterium tuberculosis infection of cynomolgus macaques closely resembles the various manifestations of human M. tuberculosis infection. Infect. Immun. 71:5831–5844. 10.1128/IAI.71.10.5831-5844.2003 [DOI] [PMC free article] [PubMed] [Google Scholar]
- 7. Barry CE, III, Boshoff HI, Dartois V, Dick T, Ehrt S, Flynn J, Schnappinger D, Wilkinson RJ, Young D. 2009. The spectrum of latent tuberculosis: rethinking the biology and intervention strategies. Nat. Rev. Microbiol. 7:845–855. 10.1038/nrmicro2236 [DOI] [PMC free article] [PubMed] [Google Scholar]
- 8. Berry MP, Graham CM, McNab FW, Xu Z, Bloch SA, Oni T, Wilkinson KA, Banchereau R, Skinner J, Wilkinson RJ, Quinn C, Blankenship D, Dhawan R, Cush JJ, Mejias A, Ramilo O, Kon OM, Pascual V, Banchereau J, Chaussabel D, O'Garra A. 2010. An interferon-inducible neutrophil-driven blood transcriptional signature in human tuberculosis. Nature 466:973–977. 10.1038/nature09247 [DOI] [PMC free article] [PubMed] [Google Scholar]
- 9. Lin PL, Flynn JL. 2010. Understanding latent tuberculosis: a moving target. J. Immunol. 185:15–22. 10.4049/jimmunol.0903856 [DOI] [PMC free article] [PubMed] [Google Scholar]
- 10. Andreu J, Caceres J, Pallisa E, Martinez-Rodriguez M. 2004. Radiological manifestations of pulmonary tuberculosis. Eur. J. Radiol. 51:139–149. 10.1016/j.ejrad.2004.03.009 [DOI] [PubMed] [Google Scholar]
- 11. Lin PL, Dartois V, Johnston PJ, Janssen C, Via L, Goodwin MB, Klein E, Barry CE, III, Flynn JL. 2012. Metronidazole prevents reactivation of latent Mycobacterium tuberculosis infection in macaques. Proc. Natl. Acad. Sci. U. S. A. 109:14188–14193. 10.1073/pnas.1121497109 [DOI] [PMC free article] [PubMed] [Google Scholar]
- 12. Lin PL, Myers A, Smith L, Bigbee C, Bigbee M, Fuhrman C, Grieser H, Chiosea I, Voitenek NN, Capuano SV, Klein E, Flynn JL. 2010. Tumor necrosis factor neutralization results in disseminated disease in acute and latent Mycobacterium tuberculosis infection with normal granuloma structure in a cynomolgus macaque model. Arthritis Rheum. 62:340–350. 10.1002/art.27271 [DOI] [PMC free article] [PubMed] [Google Scholar]
- 13. Lin PL, Pawar S, Myers A, Pegu A, Fuhrman C, Reinhart TA, Capuano SV, Klein E, Flynn JL. 2006. Early events in Mycobacterium tuberculosis infection in cynomolgus macaques. Infect. Immun. 74:3790–3803. 10.1128/IAI.00064-06 [DOI] [PMC free article] [PubMed] [Google Scholar]
- 14. Lin PL, Ford CB, Coleman MT, Myers A, Gawande R, Ioerger TR, Sacchettini JC, Fortune SM, Flynn JL. 2014. Sterilization of granulomas is common in both active and latent tuberculosis despite extensive within-host variability in bacterial killing. Nat. Med. 20:75–79. 10.1038/nm.3412 [DOI] [PMC free article] [PubMed] [Google Scholar]
- 15. Canetti G. 1955. The tubercle bacillus. Springer Publishing Co, Inc., New York, NY [Google Scholar]
- 16. Ottenhoff TH, Kaufmann SH. 2012. Vaccines against tuberculosis: where are we and where do we need to go? PLoS Pathog. 8:e1002607. 10.1371/journal.ppat.1002607 [DOI] [PMC free article] [PubMed] [Google Scholar]
- 17. Coffman RL, Sher A, Seder RA. 2010. Vaccine adjuvants: putting innate immunity to work. Immunity 33:492–503. 10.1016/j.immuni.2010.10.002 [DOI] [PMC free article] [PubMed] [Google Scholar]
- 18. Zumla A, Raviglione M, Hafner R, von Reyn CF. 2013. Tuberculosis. N. Engl. J. Med. 368:745–755. 10.1056/NEJMra1200894 [DOI] [PubMed] [Google Scholar]
- 19. Arentz M, Hawn TR. 2007. Tuberculosis infection: insight from immunogenomics. Drug Discov. Today Dis. Mech. 4:231–236. 10.1016/j.ddmec.2007.11.003 [DOI] [PMC free article] [PubMed] [Google Scholar]
- 20. Kleinnijenhuis J, Oosting M, Joosten LA, Netea MG, Van Crevel R. 2011. Innate immune recognition of Mycobacterium tuberculosis. Clin. Dev. Immunol. 2011:405310. 10.1155/2011/405310 [DOI] [PMC free article] [PubMed] [Google Scholar]
- 21. Li Y, Wang Y, Liu X. 2012. The role of airway epithelial cells in response to mycobacteria infection. Clin. Dev. Immunol. 2012:791392. 10.1155/2012/791392 [DOI] [PMC free article] [PubMed] [Google Scholar]
Associated Data
This section collects any data citations, data availability statements, or supplementary materials included in this article.