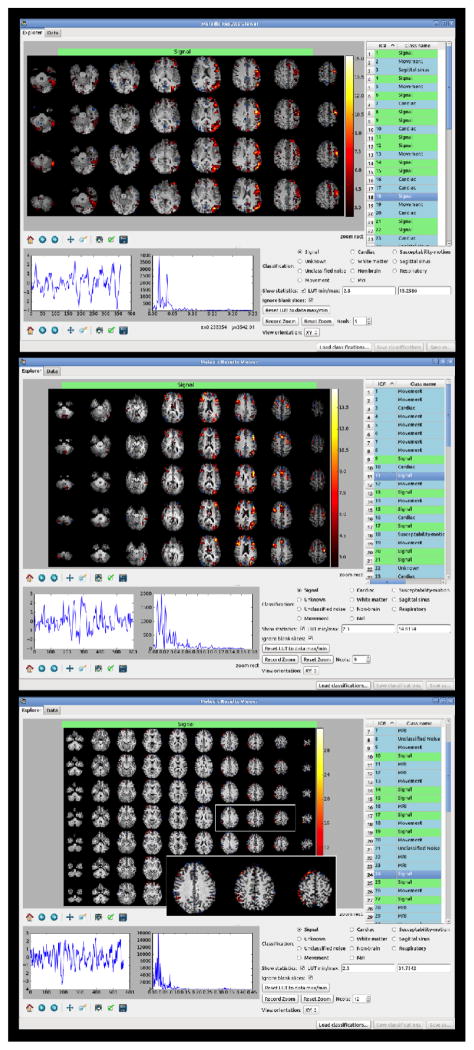
Figure 1.
Examples of “good” components from three different acquisitions. The spatial map for the high resolution, short TR acquisition (bottom; acquisition C, see text for more details) is visually strikingly different from a more standard acquisition (top and middle, acquisitions A and B, see text), with the signal above threshold following very closely the cortical gyrification. The spectral power lies primarily between 0 and 0.05 Hz for each component.

