Abstract
Graded and modular expressions of Eph-ephrins are known to provide positional information for the formation of topographic maps and patterning in the developing nervous system. Previously we have shown that ephrin-B2 is expressed in a continuous gradient across the tonotopic axis of the central nucleus of the inferior colliculus (CNIC), whereas patterns are discontinuous and modular in the lateral cortex of the IC (LCIC). The present study explores the involvement of ephrin-B2 signaling in the development of projections to the CNIC and LCIC arising from the lateral superior olivary nuclei (LSO) prior to hearing onset. Anterograde and retrograde fluorescent tracing methods in neonatal fixed tissue preparations were used to compare topographic mapping and the establishment of LSO layers/modules in wild-type and ephrin-B2lacZ/+ mice (severely compromised reverse signaling). At birth, pioneer LSO axons occupy the ipsilateral IC in both groups but are delayed contralaterally in ephrin-B2lacZ/+ mutants. By the onset of hearing, both wild-type and mutant projections form discernible layers bilaterally in the CNIC and modular arrangements within the ipsilateral LCIC. In contrast, ephrin-B2lacZ/+ mice lack a reliable topography in LSO-IC projections, suggesting that fully functional ephrin-B2 reverse signaling is required for normal projection mapping. Taken together, these ephrin-B2 findings paired with known coexpression of EphA4 suggest the importance of these signaling proteins in establishing functional auditory circuits prior to experience.
INDEXING TERMS: auditory, inferior colliculus, ephrin, Eph receptor, topography
The auditory system’s functionally organized topographic maps preserve spatial representations and signal attributes received by the periphery. Tonotopic maps of best frequency are the principal organizational feature exhibited by all auditory structures (Merzenich and Reid, 1974; Roth et al., 1978; Semple and Aitkin, 1979; Schreiner and Langner, 1988; Kandler et al., 2009). It has been proposed that, within patterned tonotopic arrangements, secondary ‘‘nucleotopic’’ maps exist in mosaic form in which discrete neuronal compartments or modules receive varying input arrays (Oliver and Heurta, 1992). Accurate alignment of inputs defines functional zones necessary for processing additional stimulus features (Schreiner and Langner, 1997; Fathke and Gabriele, 2009). Given the significance of topographic maps and the spatial precision necessary in defining functional auditory circuits, surprisingly little is known about the mechanisms that guide such connections early in development. The present study examines protein interactions thought to play a role in the establishment of orderly connections in the auditory midbrain or inferior colliculus (IC). The IC receives numerous converging inputs terminating within a single topographical framework (Fathke and Gabriele, 2009), making it an excellent model for studying targeting questions.
Previous studies from our laboratory revealed discrete afferent patterns in the central nucleus and lateral cortex of the IC (CNIC and LCIC, layered and modular, respectively) in a variety of species (Gabriele et al., 2000a,b, 2007, 2011; Henkel et al., 2005; Fathke and Gabriele, 2009). Similarly to inputs arising from the cochlear nuclei and nuclei of the lateral lemniscus (Oliver, 1984, 1987; Kandler and Friauf, 1993; Oliver et al., 1997; Gabriele et al., 2000a,b; Fathke and Gabriele, 2009), the lateral superior olive (LSO) sends bilateral layered projections to the CNIC (Shneiderman and Henkel, 1987; Gabriele et al., 2007; Fathke and Gabriele; 2009). Though initially diffuse, uncrossed and crossed LSO terminal fields segregate into clear, interdigitating axonal layers by hearing onset (Gabriele et al., 2007). In comparison with the CNIC, the LCIC receives less subcollicular input. However, recently we reported a patchy projection in rat and mouse to deep portions of the LCIC arising from the ipsilateral LSO (Gabriele et al., 2011). The input is robust and terminates in a series of discontinuous modules that span the rostrocaudal dimension of the LCIC. This distribution mimics that of the previously described LCIC modular organization (Chernock et al., 2004). Similar to their layered counterparts in the CNIC, LSO axonal modules emerge within the LCIC during the first postnatal week and are fully defined by hearing onset (Gabriele et al., 2011).
The spatial resolution necessary to establish an early topographic registry and the described LSO-IC patterning likely requires close cell-to-cell signaling via membrane-tethered guidance molecules. The Eph family of receptor tyrosine kinases, and their corresponding ligands, the ephrins, exhibit bidirectional attractant (adhesive) or repulsive (de-adhesive) binding behaviors that are known to serve as positional labels for guiding topographic map formation and precise patterning of spatially complex connections (Flanagan and Vanderhaeghen, 1998; Wilkinson 2001; Cowan and Henkemeyer, 2002; Kullander and Klein, 2002). Recently, we reported graded (CNIC) and modular (LCIC) ephrin-B2 expression that correlates temporally and spatially with developing LSO projection patterns (Gabriele et al., 2011). Furthermore, the LSO is EphA4 positive and is known to have a high binding affinity for ephrin-B2.
To understand better the role of ephrin-B2 in establishing order in the auditory midbrain, we examined the projection from the LSO to the IC in control and ephrin-B2 mutant mice. Though maintaining the ability for full activation of forward signaling (ephrin-to-Eph), our ephrin-B2 lacZ mutant’s ability to reverse signal (Eph-to-ephrin) is highly compromised (Dravis et al., 2004). We show that CNIC axonal layers and LCIC modules still form in ephrin-B2lacZ/+ mutants prior to experience, despite the diminished capability for reverse signaling. However, accurate LSO-IC topographic mapping was consistently disrupted in our mutants. Overall this suggests ephrin-B2 is essential for positional information and guidance of developing IC inputs but is perhaps not necessary for the subsequent segregation into characteristic axonal patterns.
MATERIALS AND METHODS
Mice
Experiments were performed on early postnatal mice at two developmental stages, birth and the functional onset of hearing (P11, 12). C57BL/6J (Jackson Laboratories, Bar Harbor, ME) and wild-type (WT) mice served as controls, and results were compared with mutant heterozygous ephrin-B2lacZ/+ mice, because ephrin-B2lacZ/lacZ mice are perinatally lethal (ephrin-B2 lacZ breeding pairs provided by Dr. Mark Henkemeyer, 129/CD1 background; Dravis et al., 2004). In total 36 mice were used (controls, n = 23; ephrin-B2lacZ/+, n = 13). Heterozygous mice have a lacZ insertion and maintain the ability to forward signal but exhibit highly compromised reverse signaling because of a deletion in a required cytoplasmic catalytic domain. Because the cytoplasmic domain was deleted, the ephrin-B2 β-galactosidase protein is unable to interact with intracellular PDZ domains required for reverse signaling. All experimental procedures were performed in compliance with the National Institutes of Health Guide for the Care and Use of Laboratory Animals (NIH Publications No. 80-23, revised 1996) and received prior approval from the Institutional Animal Care and Use Committee.
NeuroVue tracing of LSO-IC projections
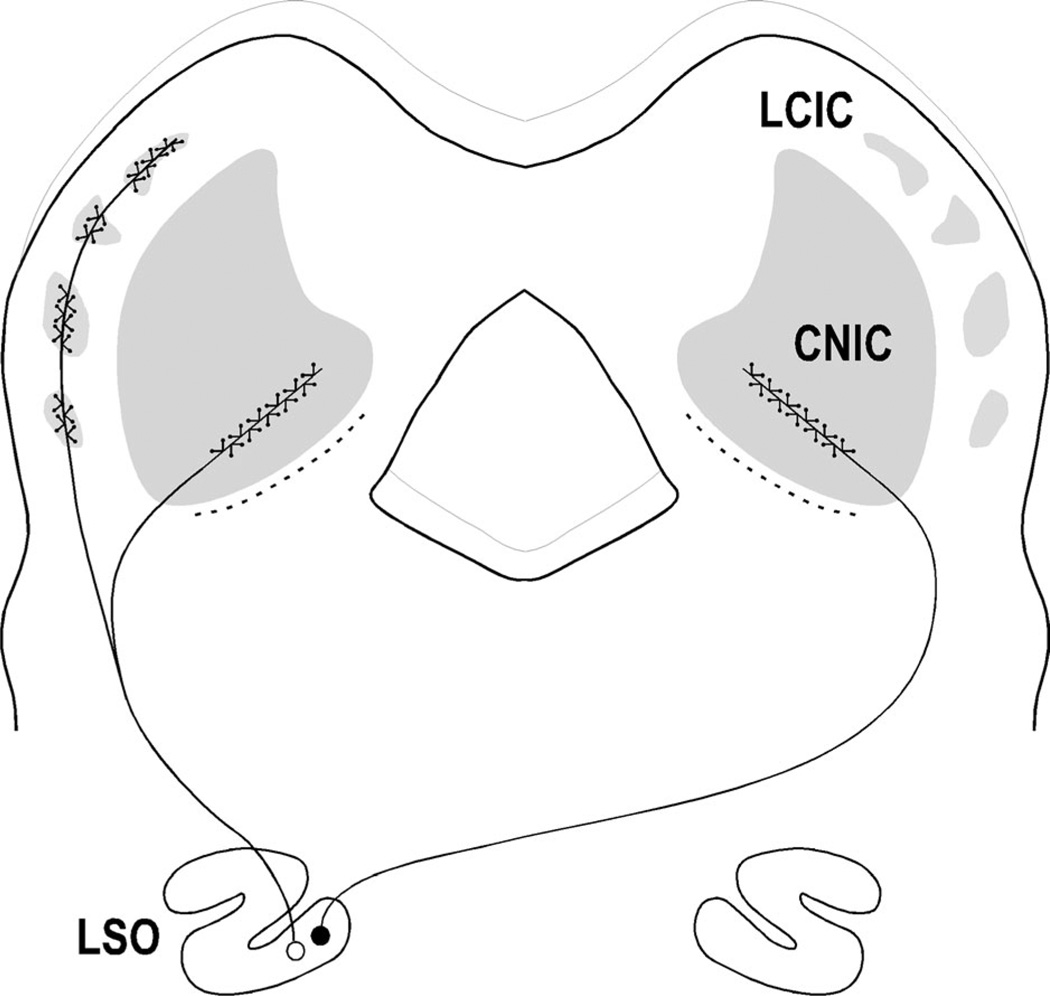
Postnatal mice were given an overdose of ketamine (200 mg/kg) and xylazine (20 mg/kg) and perfused through the heart (physiological rinse followed by 4% paraformaldehyde solution, pH 7.4). Brains were carefully removed from the skull and refrigerated overnight at 4°C in fixative solution. Brains were subsequently blocked in the coronal plane, embedded (5 ml 8% gelatin in dH2O/10 ml egg yolk), and sectioned from caudal-to-rostral at 75 µm on a Vibratome until the caudal extreme of the LSO was identifiable by darkfield microscopy (previously described in detail by Gabriele et al., 2007, 2011; Fathke and Gabriele, 2009). In each case, a sliver of lipophilic NeuroVue dye-soaked filter paper (Molecular Targeting Technologies, West Chester, PA) was cut with Micro-Vannas surgical scissors under the aid of a dissecting microscope. For each case, this approach was replicated so that the amount and spread of dye was kept as consistent as possible. However, even with the utmost care and attention, the precise amount of dye and relative spread varied slightly from case to case. Given this inevitable variation, multiple placements were made for each experimental group until several adequate, comparably sized placements had been achieved. Frequency-specific dye placements were localized along the tonotopic axis of the LSO (anterograde studies), resulting in bilateral layered inputs to the CNIC and ipsilateral LCIC modules (Fig. 1). Similar focal placements were made in the CNIC for retrograde studies. The remaining tissue block was incubated at 37°C in the dark for 1 month in fresh 4% paraformaldehyde fixative to facilitate dye diffusion. After the incubation period, the entirety of the block was sectioned at 75 µm and counterstained with bis-benzimide (Hoechst 33258; Invitrogen, Carlsbad, CA) for 5 min to visualize the LSO, CNIC, and LCIC cytoarchitectural boundaries. Sections were rinsed, mounted, and coverslipped while still wet with GelMount (BioMeda, Foster City, CA).
Figure 1.
Diagram illustrating layered CNIC and modular LCIC arrangements. LSO sends bilateral layered projections to CNIC and ipsilateral modular inputs to LCIC.
Genotyping
Ephrin-B2 mice were genotyped as previously described (Gabriele et al., 2011). Briefly, tail sample digestion, DNA extraction, and precipitation were performed with an Easy-DNA kit (Invitrogen, Carlsbad, CA). The following primer sequences were used for PCR amplification: EB2-forward 5′-TCTGTCAAGTTCGCTCTGAGG-3′, EB2-reverse 5′-CTTGTAGTAAATGTTGGCAGGACT-3′, lacZ 5′-AGGCGATTAAGTTGGGTAACG-3′ (Dravis et al., 2004; Miko et al., 2007). Gel electrophoresis yielded WT (500-bp) and/or mutant (400-bp) allele bands.
Microscopy and image capture
A monochrome cooled CCD CoolSnap HQ digital camera (Roper Scientific, Tuscon, AZ) and a Nikon TE 2000 microscope (Nikon, Melville, NY) were used to capture fluorescent images. R and B Phycoeythrin (NeuroVue) and DAPI (bis-benzimide) filter sets (ChromaTechnology, Brattleboro, VT) were used for unequivocal visualization of the two molecules. Two monochrome channels were acquired and then digitally merged and pseudocolored (green: NeuroVue axonal labeling; blue: bis-benzimide nuclear counterstain).
For both anterograde and retrograde studies, magnification series were collected throughout the rostrocadual extent of the IC and LSO. Z-stacks were acquired at 10× or higher to capture focused label throughout the entirety of the 75 µm section. Three-dimensional Z-stacks (Elements Software; Nikon) were then flattened into two dimensions via a maximum projection function. All images were saved as JPEG2000 files. Lookup tables were unmanipulated to preserve raw brightness and contrast values to facilitate accurate comparisons between WT and heterozygous ephrin-B2 mice. In some cases, brightness/contrast values were adjusted slightly for illustration purposes or to accentuate the bis-benzimide channel to aid in drawing cytoarchitectural boundaries (Adobe Photoshop, San Jose, CA).
Quantitative analysis
ImageJ software (NIH, Bethesda, MD) was utilized for quantification of topographic mapping and pattern formation. To assess topography, three sections along the rostrocaudal extent of both the LSO and the CNIC in each anterograde case were examined. For sections containing LSO, a freehand tool was used to draw a curved contour to calculate the total distance of its frequency axis. A second measurement to the center of the dye placement was taken to calculate the location of the dye as a percentage of LSO length (medial-to-lateral). In corresponding CNIC sections, a line tool was drawn perpendicular to fibrodendritic laminae to measure the full extent of the tonotopic axis (ventromedial-to-dorsolateral). A second line measurement of similar orientation was drawn to the center of the terminal zone (TZ) to determine the location of the resultant label (expressed as percentage distance). Averaged CNIC TZ percentage values were determined for both ipsilateral and contralateral LSO projections, plotted against corresponding averaged dye placement locations, and fit with a linear regression. To compare relative sizes of terminal fields in WT and ephrin-B2lacZ/+ mutants, the total ventromedial-to-dorsolateral spread of CNIC labeling was divided by the total medial-to-lateral spread of dye in the LSO (CNIC TZ area/LSO dye area). LSO dye area was calculated with curved contours drawn from the medial extreme of the LSO to the medial aspect of the dye spread and then again to the lateral extent of the dye. From this, the total dye spread was calculated and found not to be significantly different between the two groups (WT = 192.1 µm; ephrin-B2lacZ/+ = 168.9 µm; P > 0.05). WT values were set to 1, and normalized mutant values were used for comparisons between these groups (Student t-tests, two-tailed).
To assess layered (CNIC) and modular (LCIC) pattern formation, brightness profiles were generated in ImageJ for three representative sections in all cases. A series of ImageJ macros was written to set appropriate scaling and to convert acquired images to 8-bit grayscale with the application of a 2σ-factor Gaussian blur. For layering (CNIC), monochrome single-channel images (NeuroVue only) were imported and rotated to allow rectangular sampling along the tonotopic axis of the IC (i.e., orthogonal to CNIC fibrodendritic laminae, as previously described by Gabriele et al., 2007, and Fathke and Gabriele, 2009). Brightness profile functions were generated such that each x-value corresponded to the average grayscale value for all of the pixels in a single column of the sample area. To quantify presence of modules (LCIC), brightness profiles were generated from low-magnification images (4×) using curved contoured sampling that bisected LCIC labeling and encompassed the full extent of presumptive patches. Data from brightness profiles for both layering and modules were analyzed to confirm whether periodic trends were present in the label. Averaged autocorrelation function maxima >0.6 (1.0 = perfect periodic signal, 0 = no periodicity) served as objective criteria to verify the presence of periodic components of CNIC or LCIC axonal label distributions. Maxima fitting this criteria were checked for biological significance by reexamination of captured images used to generate original brightness profiles.
RESULTS
Anterograde studies
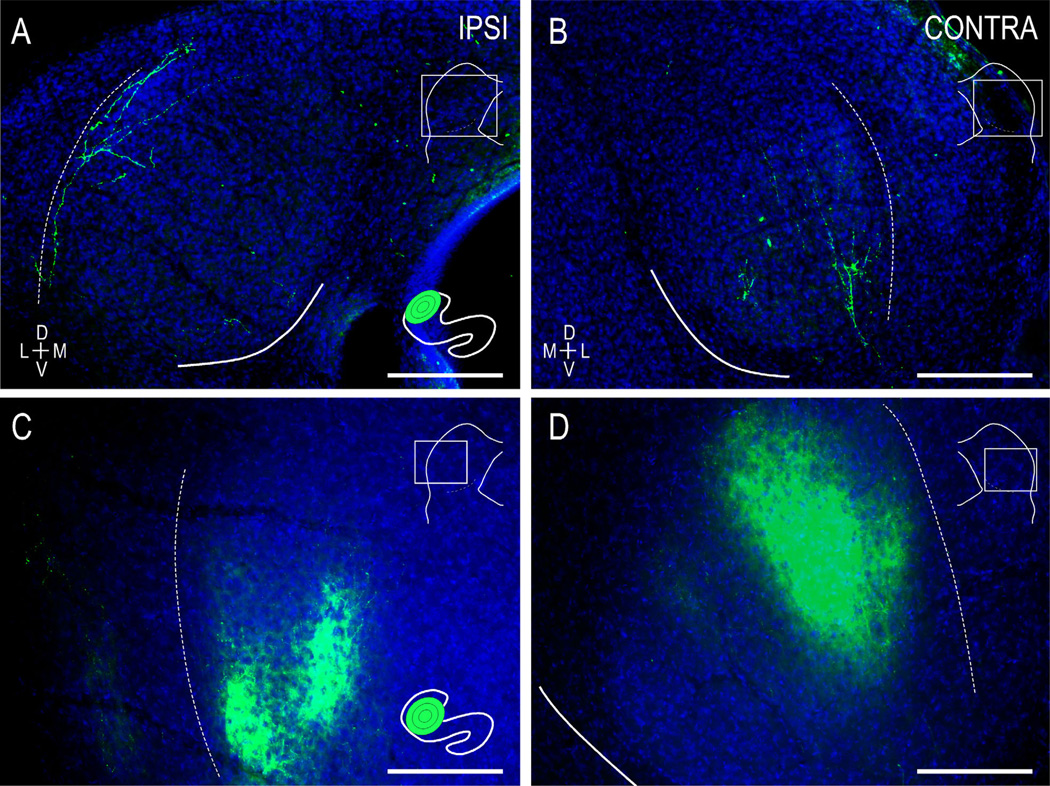
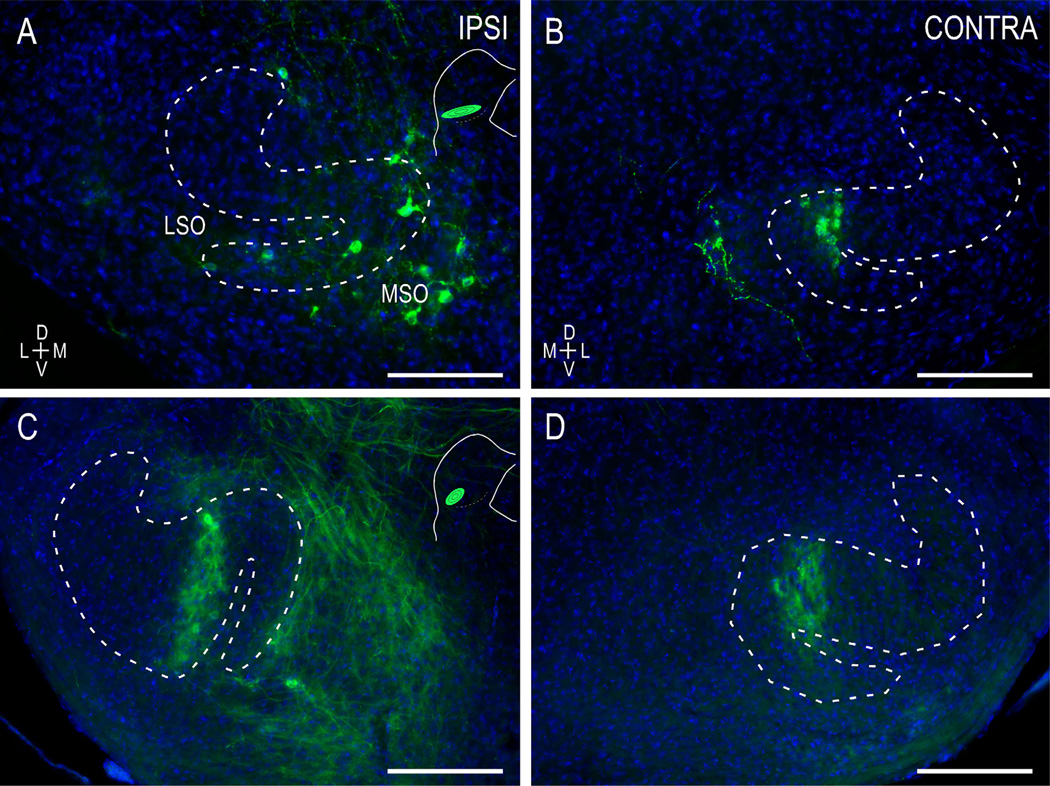
Focal placements of dye were made along the tonotopic axis of the LSO in WT and ephrin-B2lacZ/+ mice at birth or at hearing onset. In WT mice at birth, LSO pioneer fibers have invaded the ipsilateral and contralateral CNIC (Fig. 2A,B). Even at this earliest postnatal stage, both uncrossed and crossed projections exhibit a topography and relative adherence to the fibrodendritic architecture of the target CNIC. Minute dye placements in frequency-specific regions of the LSO yielded consistent label in appropriate isofrequency laminae (Fig. 2A,B; low-frequency case). Projection distributions at hearing onset maintain the same precise tonotopy observed in newborns. At P12, terminal fields are noticeably denser and have fully segregated into mature axonal layers (Fig. 2C,D; midfrequency case; also as previously described by Gabriele et al., 2011).
Figure 2.
Localized, frequency-matched LSO-IC topography in WT mice at birth (A,B) and hearing onset (C,D). At postnatal day 0 (P0), pioneer LSO axons have invaded the ipsilateral (A) and contralateral CNIC (B) and have trajectories that appear to recognize the resident fibrodendritic architecture. At hearing onset (C,D), localized LSO dye placements yield a consistent topography, with refined layers in frequency-matched regions of the target IC. LSO insets (A,C) illustrate quantified dye locales and relative spread in each case. IC insets demonstrate fields of view (rectangles) of anterograde CNIC labeling. Insets not to scale. Curved contours demarcate the ventromedial border of the CNIC (solid line) and the LCIC/CNIC boundary (dashed line). Scale bars = 200 µm. [Color figure can be viewed in the online issue, which is available at wileyonlinelibrary.com.]
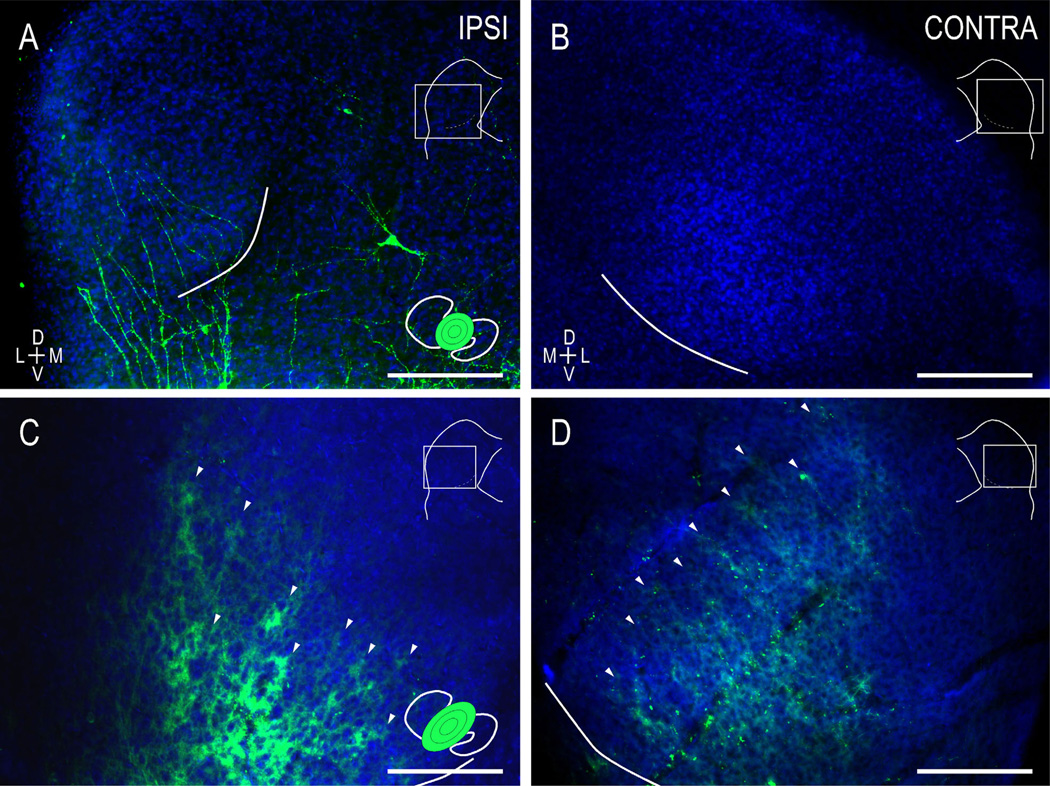
At these same developmental time points, several noteworthy differences were observed in ephrin-B2lacZ/+ mice. Pioneer axons were absent in the contralateral IC at birth (Fig. 3A,B). Though somewhat delayed, leading axons were apparent at P0 in dorsal aspects of the lateral lemniscus and within the CNIC by P4 (data not shown). Furthermore, a clear and reliable LSO-IC topography was lacking. Even in cases with highly localized LSO dye placements, resultant label was diffuse, filling the entire ipsilateral CNIC. At P12, significant projection distributions are established in both the ipsilateral and the contralateral IC. Although distinguishable axonal layers are quantifiable (see Fig. 7) for both the uncrossed and the crossed inputs, connections lack a topography at hearing onset (Fig. 3C,D).
Figure 3.
Ephrin-B2lacZ/+ mice lack a clear LSO-IC topography yet still form discernible afferent layers. At birth, LSO axons were consistently observed in the ipsilateral IC (A), but never contralaterally (B). By the onset of hearing (C,D), localized dye placements still result in widespread projection distributions. Although a tight topography was lacking, afferent layers were apparent in both the ipsilateral and the contralateral CNIC. Insets as in Figure 2. Scale bars = 200 µm. [Color figure can be viewed in the online issue, which is available at wileyonlinelibrary.com.]
Figure 7.
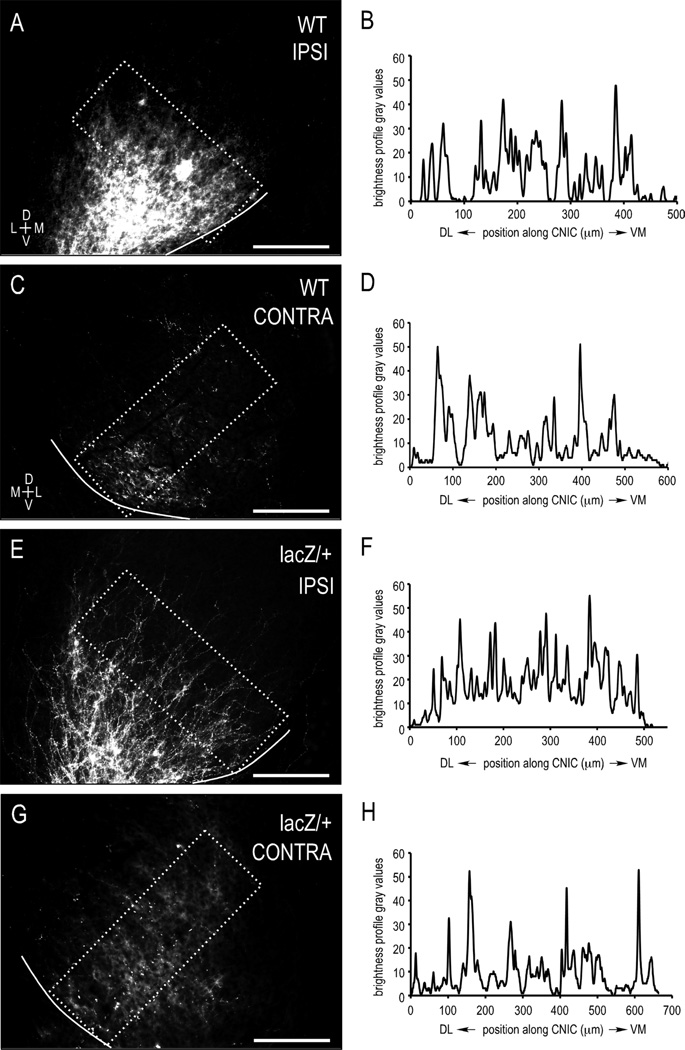
Brightness profiles and autocorrelation functions confirm periodic CNIC layering in both WT and ephrin-B2lacZ/+ mutants leading up to hearing onset. Single-channel images of anterograde labeling (A,C,E,G) for WT (A–D; cases with large dye placements) and mutants (E–H) were analyzed for periodicity (i.e., afferent layering). Brightness profiles (B,D,F,H) and corresponding autocorrelation function maxima (0.7709, 0.7894, 0.6817, 0.6830, respectively; all cases >0.6) show periodic signal components that were not significantly different (Student’s t-test results for all comparisons, P > 0.05) and closely match the observed biological layering data. Though lacking a strict topography, LSO projections still form discernible layers in the ipsilateral and contralateral CNIC of ephrin-B2lacZ/+ mice. Boxed areas depict orientation of sampling areas for brightness profiles. Scale bars =200 µm.
Figure 4 shows quantification of topography and targeting specificity for anterograde labeling studies. Plots of TZ center of the CNIC as a function of dye placement center reveal a reliable topography for both uncrossed and crossed inputs in WT mice (Fig. 4A). In contrast, similar plots in ephrin-B2lacZ/+ mutants illustrate a lack of correlation between LSO dye placement location and resultant CNIC labeling (Fig. 4B). With regard to projection distribution, WT and ephrin-B2lacZ/+ animals with comparably sized dye placements exhibit a significant difference (P < 0.001) in the TZ size for both LSO projections (Fig. 4C).
Figure 4.
LSO-IC projection differences in WT and ephrin-B2lacZ/+ mice. A: Quantification of WT projection topography (circles, ipsilateral; squares, contralateral) as a function of TZ center (%CNIC) vs. dye placement center (%LSO). Similar positive linear regression slopes verify topographic mapping of both inputs, such that low-frequency dye placements yield low-frequency TZs and high-frequency dye placements yield high-frequency TZs. B: Unlike WTs, ephrin-B2lacZ/+ mice have unrefined projection distributions, lack an obvious topography, and therefore show no correlation between relative TZ center and LSO dye placement location. C: Quantification of TZ size for both uncrossed and crossed LSO inputs in both WT and ephrin-B2lacZ/+ mutants. Although no significant difference is observed between projections in the two groups (P > 0.05), there is a significant difference for both inputs between WT and ephrin-B2lacZ/+ mice (*P < 0.001).
Retrograde studies
To support anterograde findings, complementary retrograde tract-tracing studies were performed, with localized dye placements in varying frequency domains of the CNIC. In newborn wild-type mice, focal placements consistently yield narrow bands of retrogradely labeled neurons in frequency-matched regions of the ipsilateral and contralateral LSO (Fig. 5A,B). At hearing onset, a precise topography remains, with highly refined bands of retrogradely labeled LSO neurons (Fig. 5C,D).
Figure 5.
Precise topography in WT mice evidenced by narrow bands of retrogradely labeled LSO neurons at birth (A,B) and hearing onset (C,D). Focal dye placements in the CNIC (insets A,C) reliably produce restricted bands of retrogradely labeled cells in matching frequency aspects of the ipsilateral (A,C) and contralateral LSO (B,D). Similar to anterograde findings, bilateral LSO-IC connections are established at birth (A,B), already displaying considerable projection topography. As experience ensues (C,D), an even finer topographic connectivity is apparent, with highly restricted bands of retrogradely labeled LSO cells. IC insets (A,C) illustrate quantified dyes locales and relative spread in each case. CNIC dye placements often resulted in some ipsilateral, retrogradely labeled MSO and/or periolivary neurons. MSO, medial superior olive. Scale bars = 200 µm. [Color figure can be viewed in the online issue, which is available at wileyonlinelibrary.com.]
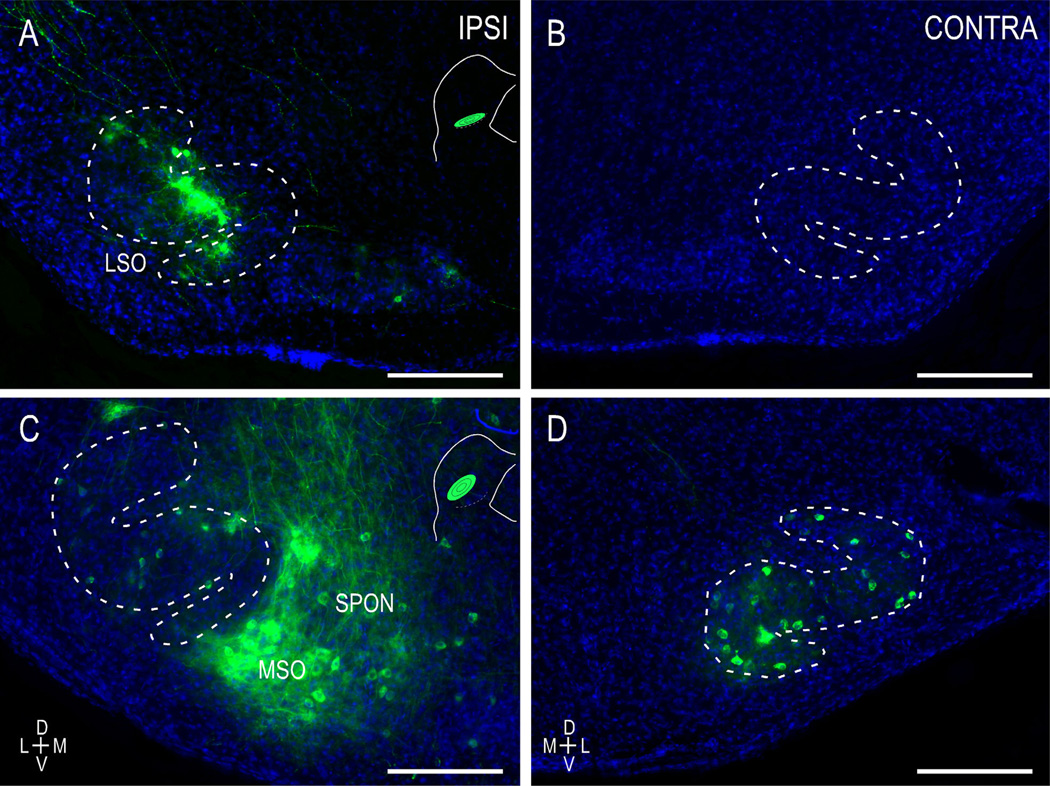
As in the anterograde studies in ephrin-B2lacZ/+ mutants at birth, LSO-IC connections are seen ipsilaterally, but never contralaterally (Fig. 6A,B). Furthermore, ephrin-B2lacZ/+ mice again lack a clear topography. Localized CNIC dye placements (Fig. 6A,C, insets) yield widely distributed retrogradely labeled neurons throughout the LSO both at birth (Fig. 6A) and at hearing onset (Fig. 6C,D). Again, though seemingly delayed at birth, substantial contralateral connections are present in ephrin-B2lacZ/+ mutants by the onset of hearing (Fig. 6D).
Figure 6.
Ephrin-B2lacZ/+ mice exhibit widely distributed retrograde LSO labeling despite focal IC dye placements. In contrast to the case in WT mice, localized CNIC dye placements result in retrogradely labeled neurons throughout the tonotopic axis of the LSO (A,C,D). Similar to anterograde findings in ephrin-B2lacZ/+ mutants at birth, diffuse LSO connections were observed ipsilaterally (A) but not contralaterally (B). An absence of topography persists for the uncrossed (C) and crossed (D) LSO projections leading up to hearing onset, with localized dye placements resulting in extensive labeling throughout the LSO tonotopic axis. Evidence of ipsilateral MSO and superior periolivary nuclear (SPON) labeling was not uncommon. Insets as in Figure 5. Scale bars = 200 µm. [Color figure can be viewed in the online issue, which is available at wileyonlinelibrary.com.]
CNIC layering and LCIC modules
Brightness profiles and autocorrelation analyses support qualitative observations that both WT and ephrin-B2lacZ/+ mice form discernible afferent layers in the CNIC prior to experience. Sampling across the tonotopic axes of the ipsilateral and contralateral CNIC in WT mice reveals a strong periodic component for both the uncrossed and the crossed projections (Fig. 7A,B and C,D respectively; average autocorrelation maxima consistent with periodic layering for both, WT ipsi = 0.726; WT contra = 0.723), with an approximate layer thickness of 75 µm (similar to that previously reported by Gabriele et al., 2011). Similarly, brightness profiles generated from ipsilateral (Fig. 7E,F) and contralateral (Fig. 7G,H) ephrin-B2lacZ/+ axonal distributions appear comparably layered with equally strong average autocorrelation maxima (lacZ/+ ipsi = 0.681; lacZ/+ contra = 0.689). No statistically significant differences for autocorrelation functions accessing periodicity were observed between groups or between projections within WT and ephrin-B2lacZ/+ groups (P > 0.05).
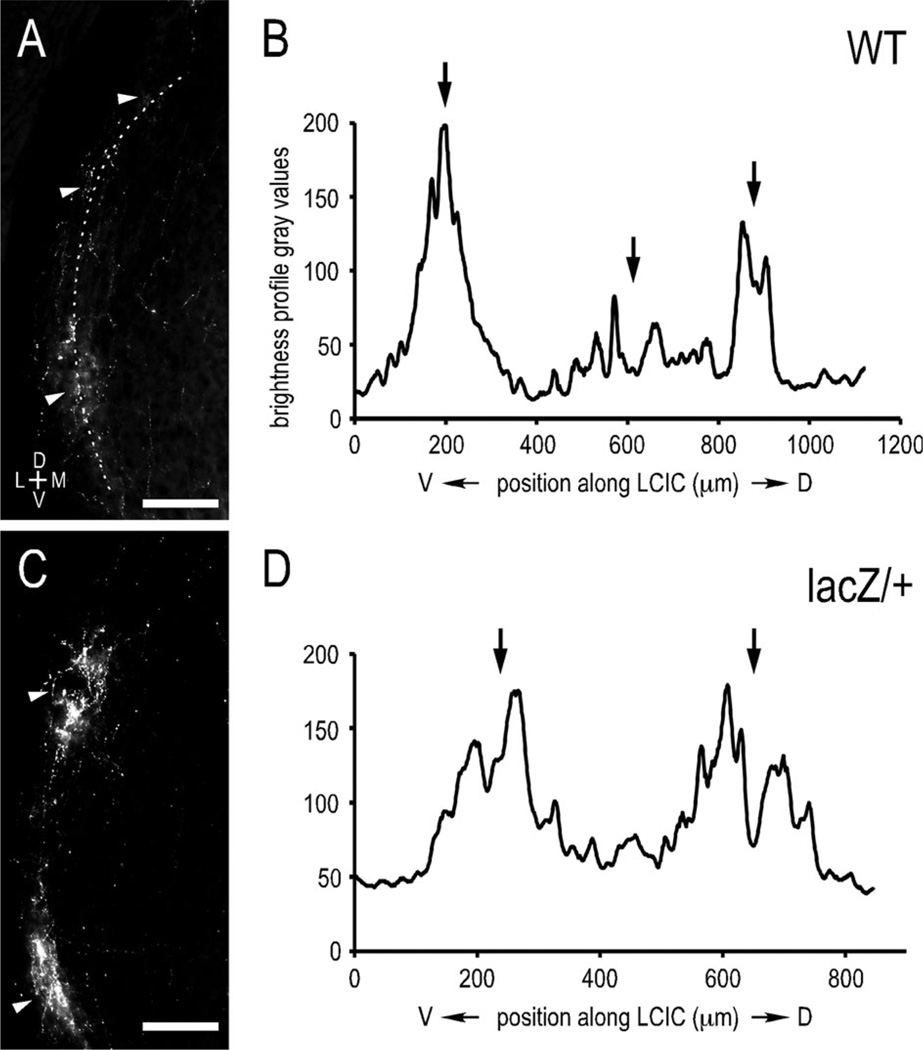
Similar quantitative measures reveal a periodic LSO modular input to the ipsilateral LCIC in both WT and ephrin-B2lacZ/+ mice prior to experience (Fig. 8A–D; average autocorrelation maxima, WT = 0.778; ephrin-B2lacZ/+ = 0.775; Student’s t-test, P > 0.05). Although normal ephrin-B2 reverse signaling is required for the topographic organization of LSO inputs into the IC, it appears not to be necessary for the formation of afferent CNIC layers or LCIC modules.
Figure 8.
Brightness profiles and autocorrelation functions of uncrossed LSO inputs in WT and ephrin-B2lacZ/+ mutants at P12. Curved contour sampling (dashed) of LSO axonal labeling in LCIC (A: WT; C: ephrin-B2lacZ/+) and corresponding brightness profiles (B,D; autocorrelation maxima = 0.774, 0.957, respectively). Modular axonal labeling (arrowheads, A,C) corresponds to peaks on matching brightness profiles (arrows, B,D). Strong autocorrelation maxima confirm modular compartmentalized LSO inputs to the LCIC in both WT and ephrin-B2lacZ/+ mutants, with no statistically significant difference between groups (Student’s t-test, P > 0.05). Scale bars = 200 µm.
DISCUSSION
The CNIC and its laminar arrangement organize multiple converging auditory inputs from a variety of brainstem structures into functional zones (Oliver et al., 1997; Loftus et al., 2004, 2010; Malmierca et al., 2005; Fathke and Gabriele, 2009). The modular LCIC, receiving the described patchy input from the LSO on the same side, is also the recipient of substantial multimodal inputs (Coleman and Clerici, 1987; Chernock et al., 2004; Oliver, 2005), descending cortical influences (Torii et al., 2012), and connections from the CNIC itself (Saldaña and Merchán, 1992). Each of these afferent inputs is topographically mapped and patterned in accordance with the underlying cytoarchitecture of the CNIC or LCIC. Their spatial registry with respect to neighboring or overlapping projection domains likely determines the types of auditory and multisensory processing that occur within these IC subdivisions (Schreiner and Langner, 1997). Here we show that both layered LSO inputs to the CNIC and its modular projection to the LCIC are established and highly refined by the onset of experience. Given that ephrin-B2 is transiently expressed during this period of pattern formation in both a graded (CNIC) and modular (LCIC) fashion (Gabriele et al., 2011), we examined the involvement of this signaling protein in guiding LSO-IC projection topography, terminal zone specificity, and the ability to form layered or modular projection distributions. We show a consistent and highly specific topographic mapping of inputs to the CNIC in controls that was lacking in our ephrin-B2lacZ/+ mice. In spite of this absence of topography, we found that ephrin-B2lacZ/+ mutants were able to establish discrete CNIC layers and LCIC modules that were comparable to those observed in WT animals. Thus, although fully functional ephrin-B2 reverse signaling is required for mapping of LSO-IC inputs, it appears subsequent patterning of LSO terminal fields into CNIC layers and LCIC modules occurs independently of this signaling mechanism.
Topography vs. pattern formation: different mechanisms?
LSO-IC projection mapping and pattern formation are likely driven by a combination of different mechanisms (i.e., both activity dependent and activity independent). It is now well established that primitive forms of activity are conveyed from the periphery all the way to the auditory cortex prior to hearing onset (Lippe, 1994; Kros et al., 1998; Jones et al., 2001; Kandler, 2004; Tritsch et al., 2007; Tritsch and Bergles, 2010), as has been previously shown for the developing visual system (Katz and Shatz, 1996; Torborg and Feller, 2005; Feller, 2009). Such orchestrated events of spontaneous activity generated in the immature cochlea appear to influence the ability of CNIC afferents to segregate fully into their layered arrangements (Gabriele et al., 2000b; Franklin et al., 2006, 2008). However, although these inputs are not able to establish or maintain characteristic layered patterns, their ability to recognize and distribute within topographically appropriate domains of the target CNIC remains unaffected.
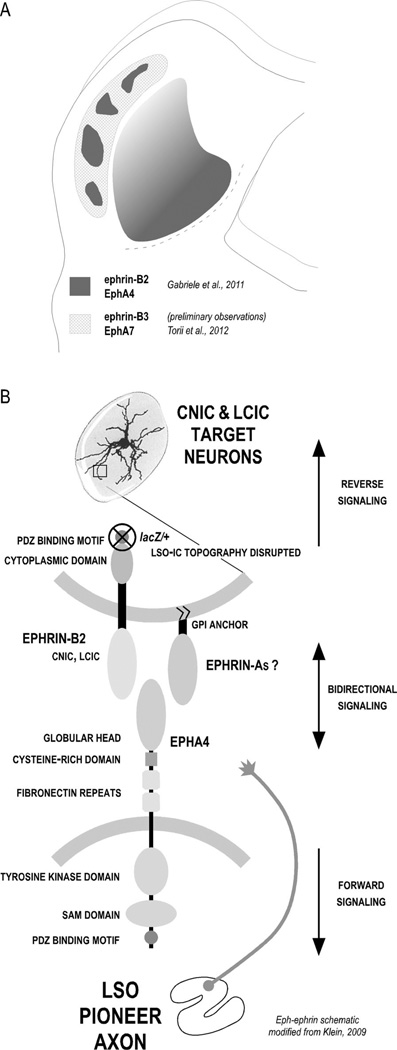
As relative levels of spontaneous activity appear to influence pattern formation in the developing IC, other activity-independent mechanisms are likely involved in other aspects of target recognition and topographic map formation. Considerable evidence suggests Eph-ephrin involvement in organizing subcollicular auditory connectivity (Cramer, 2005), yet less is known about similar Ephephrin roles in the developing IC (Miko et al., 2007; Gabriele et al., 2011; Torii et al., 2012). Previously, we described a transient expression of certain members of the Eph-ephrin signaling family leading up to the functional onset of hearing that correlates both temporally and spatially with developing inputs to the CNIC and LCIC (Gabriele et al., 2011). Ephrin-B2 and EphA4 expression patterns are graded across the tonotopic axis of the CNIC (Fig. 9A), with protein most concentrated in ventromedial, high-frequency domains (Miko et al., 2007; Gabriele et al., 2011). Perhaps even more conspicuous is the modular expression of these two proteins in the developing LCIC. The expression of ephrin-B2 and EphA4 within these IC subdivisions is morphologically distinct. Ephrin-B2 expression appears cellular, with positive somata dominating the CNIC and LCIC modules. In contrast, EphA4 labeling is punctate and axonal-like, with a relative absence of positive cell bodies. Within the CNIC, EphA4-positive fibers exhibit a ventrolateral-to-dorsomedial bias, consistent with the known orientation of fibrodendritic laminae and developing axonal layers. EphA4 expression in the LCIC is also axonal in its appearance, albeit confined to a modular organization. These observations, paired with the present findings and the known binding affinity for ephrin-B2 and EphA4, suggest their involvement in the mapping of afferents within the developing CNIC and LCIC (Fig. 9B).
Figure 9.
Summary of known Eph-ephrin IC expression and potential signaling model for LSO-IC projections. A: Schematic of Eph-ephrin protein expression in neonatal mouse leading up to the onset of hearing. EphA4 and ephrin-B2 are coexpressed in LCIC modules and graded across the CNIC. Additional experiments are ongoing to determine whether their LCIC modular expression is superimposed or complementary. In contrast, preliminary observations suggest that ephrin-B3 is absent in the CNIC and most concentrated in nonmodular LCIC zones, similar to what has been reported for EphA7 (Torii et al., 2012). Though not noted here, expression of each of these proteins is significantly downregulated as experience ensues (see Miko et al., 2007; Gabriele et al., 2011). B: Potential Eph-ephrin interactions in ordering developing LSO axons with target IC neurons. EphA4-expressing LSO axons likely encounter target IC neurons that express ephrin-B2 (CNIC and LCIC). Our ephrin-B2lacZ/+ mutant is capable of forward signaling (into the Eph-expressing axons; bottom) yet, because of a truncated cytoplasmic domain, is incapable of reverse signaling (into the ephrin-expressing target IC cell; top). Topographic mapping is disrupted in these mutants, but layered and modular IC pattern formation remains unaffected.
Eph-ephrin expression gradients/modules in the IC flatten and are downregulated as experience ensues (Miko et al., 2007; Gabriele et al., 2011). In all likelihood, IC circuit assembly requires both activity-mediated events and the coordinated function of ephrin-B2, EphA4, and additional members of the Eph-ephrin family (ephrin-B3 is also expressed in the neonatal IC [preliminary observations] and is known to bind EphA4, as well as other ephrinA/Bs and EphA/Bs). Thus, at present we support a model in which endogenously generated activity and Eph-ephrin signaling together establish an orderly blueprint of connections that is subsequently maintained and refined by experience.
Eph-ephrin commonalities in analogous sensory systems
The importance of highly organized circuits that preserve nearest-neighbor relationships is not unique to the auditory system. Rather, topographic mapping and projection patterns are common and well-established hallmarks of the visual, somatosensory, and olfactory systems (Godement and Mason, 2004; Miller et al., 2006; Imai et al., 2010; respectively). We can only speculate at present about potential complexities required for map refinement in the developing IC, but it appears that this process may share commonalities with aspects of axonal guidance and map generation in these other systems. In the developing visual system, retinal axons face midline decisions that are mediated in part by ephrin-B2-expressing radial glial cells at the optic chiasm (Williams et al., 2003; Lee et al., 2008; Petros et al., 2009). Similarly, midline regions of the auditory brainstem where LSO axons decussate appear to be positive for ephrin-B2 (unpublished findings from previous studies; see also Gabriele et al., 2011). Crossed pioneer LSO axons are consistently delayed at birth in our ephrin-B2lacZ/+ mutants, so an important issue will be to determine the role that ephrin-B2 plays (repulsive or permissive) for the navigation of auditory axons at this midline commissure.
Furthermore, the graded and transient expressions of ephrin-B2 and EphA4 along the tonotopic axis of the CNIC beg comparisons with retinotectal and retinocollicular inputs that employ Eph-ephrin countergradients for mapping both the target A-P (EphAs-ephrinAs) and the M-L (EphBs-ephrinBs) axes (Feldheim et al., 2000; Lyckman et al., 2001; Hindges et al., 2002; O’Leary and McLaughlin, 2005; McLaughlin and O’Leary, 2005; Rashid et al., 2005). It is plausible that graded expressions are similarly required along multiple axes of the CNIC to generate an analogous tonotopic representation. Despite known graded expression patterns along the frequency axis (VM-DL), CNIC gradients along additional axes (e.g., rostrocaudal) as well as complementary gradients of corresponding Eph-ephrins in source auditory brainstem nuclei have yet to be described.
Perhaps an even better comparison for developing LSO-IC inputs can be made with the recently described development of the multimodal projection from primary somatosensory cortex (S1) to the superior colliculus (SC; Triplett et al., 2012). This projection not only is topographically organized but also terminates throughout the deeper layers of the SC in a discontinuous patchy distribution that is reminiscent of modular LCIC terminal fields. Much like our present findings, graded Eph-ephrin signaling is required for topographic mapping, but not pattern formation, in the S1-SC projection. In fact, there is a similarly diffuse and comparably unrefined projection topography in the ephrin-A mutants that also maintains the ability to form afferent patches. TZs are still appropriately shaped in each case (layers and modules in LSO-IC projections, patches in S1-SC projection), so fibers may depend on competition-based segregation with other converging inputs that is not completely Eph-ephrin dependent. Furthermore, it is certainly conceivable that Eph-ephrin signaling and activity requirements necessary for IC map and pattern formation are not mutually exclusive, as has been shown to be the case in the sorting of axons in the developing olfactory bulb (Cutforth et al., 2003; Serizawa et al., 2006). Without question, correlated neuronal activity (both spontaneous and evoked) is capable of regulating genes that encode Eph-ephrin expression, thereby influencing the alignment and shaping of converging projection domains.
All told, the CNIC and LCIC provide a model system for examining emergent topographic, laminar, and modular arrangements in the auditory system prior to experience. Aside from the present findings and a recent study showing shifts in normal corticocollicular targeting in EphA7-overexpressing mice (Torii et al., 2012), little is known concerning the mechanisms that control the development of topographic maps and spatial patterning in the auditory midbrain. It remains to be seen whether topographically precise LSO arbors form via interstitial branching of parent fibers that initially overshoot their appropriate TZ, as has been described for retinotopic map development (O’Leary and McLaughlin, 2005; Rashid et al., 2005).
Although the present data identify ephrin-B2 signaling as partially accountable for guiding LSO-IC projection topography, it is likely that complex interactions between multiple guidance molecules are responsible for the elaborate connectivity of the many inputs to this midbrain hub. With a multitude of overlapping projection maps, it remains to be determined which of these are influenced by Eph-ephrin members and which inputs ultimately instruct the alignment and spatial registry of other locally converging projections. Ongoing experiments in our laboratory aim to determine Eph-ephrin roles in mapping of cochlear nuclear and lateral lemniscal inputs to the IC; however, further studies are needed to address which molecules/inputs instruct the alignment of ascending and descending multimodal modular inputs to the LCIC. Finally, organotypic (in vitro stripe assays) and physiological/behavioral (auditory brainstem responses/acoustic startle reflexes) studies will enable us to explore further the specific responses that growing auditory brainstem neurites have to varying concentrations of Eph-ephrins as well as determine how altered topographic projections affect an animal’s ability to detect and process sound.
ACKNOWLEDGMENTS
The authors thank Dr. Mark Henkemeyer for his help with the generation of the ephrin-B2 lacZ mutants, Dr. Thomas Gabriele for his guidance with signal processing and autocorrelation analyses, and Devon Cowan for his programming of quantitative ImageJ macros.
Grant sponsor: National Institutes of Health; Grant number: DC012421-01; Grant sponsor: Commonwealth Health Research Board; Grant number: 06-09; Grant sponsor: National Science Foundation; Grant number: DBI-0619207.
Footnotes
CONFLICT OF INTEREST STATEMENT
The authors have no conflict of interest.
ROLE OF AUTHORS
Each author takes full responsibility for the accuracy and integrity of the results and data analysis. M.M.W. participated in the experimental design, carried out all experimentation, performed the statistical analyses, and assisted in the editing and writing of the manuscript. S.M.K. was influential in starting the ephrin-B2 mutant colony and genotyping procedures. M.L.G. conceived the project, prepared the figures, wrote the manuscript, and was project supervisor.
LITERATURE CITED
- Chernock ML, Larue DT, Winer JA. A periodic network of neurochemical modules in the inferior colliculus. Hear Res. 2004;188:12–20. doi: 10.1016/S0378-5955(03)00340-X. [DOI] [PubMed] [Google Scholar]
- Coleman JR, Clerici WJ. Sources of projections to subdivisions of the inferior colliculus in rat. J Comp Neurol. 1987;262:215–226. doi: 10.1002/cne.902620204. [DOI] [PubMed] [Google Scholar]
- Cowan CA, Henkemeyer M. Ephrins in reverse, park and drive. Trends Cell Biol. 2002;12:339–346. doi: 10.1016/s0962-8924(02)02317-6. [DOI] [PubMed] [Google Scholar]
- Cramer KS. Eph proteins and the assembly of auditory circuits. Hear Res. 2005;206:42–51. doi: 10.1016/j.heares.2004.11.024. [DOI] [PubMed] [Google Scholar]
- Cutforth T, Moring L, Mendelsohn M, Nemes A, Shah NM, Kim MM, Frisén J, Axel R. Axonal ephrin-As and odorant receptors: coordinate determination of the olfactory sensory map. Cell. 2003;114:311–322. doi: 10.1016/s0092-8674(03)00568-3. [DOI] [PubMed] [Google Scholar]
- Dravis C, Yokoyama N, Chumley MJ, Cowan CA, Silvany RE, Shay J, Baker LA, Henkemeyer M. Bidirectional signaling mediated by ephrin-B2 and EphB2 controls urorectal development. Dev Biol. 2004;271:272–290. doi: 10.1016/j.ydbio.2004.03.027. [DOI] [PubMed] [Google Scholar]
- Fathke RL, Gabriele ML. Patterning of multiple layered projections to the auditory midbrain prior to experience. Hear Res. 2009;249:36–43. doi: 10.1016/j.heares.2009.01.004. [DOI] [PubMed] [Google Scholar]
- Feldheim DA, Kim YI, Bergemann AD, Frisen J, Barbacid M, Flanagan JG. Genetic analysis of ephrin-A2 and ephrin-A5 shows their requirement in multiple aspects of retinocollicular mapping. Neuron. 2000;25:563–574. doi: 10.1016/s0896-6273(00)81060-0. [DOI] [PubMed] [Google Scholar]
- Feller MB. Retinal waves are likely to instruct the formation of eye-specific retinogeniculate projections. Neural Dev. 2009;4:24. doi: 10.1186/1749-8104-4-24. [DOI] [PMC free article] [PubMed] [Google Scholar]
- Flanagan JG, Vanderhaeghen P. The ephrins and Eph receptors in neural development. Annu Rev Neurosci. 1998;21:309–345. doi: 10.1146/annurev.neuro.21.1.309. [DOI] [PubMed] [Google Scholar]
- Franklin SR, Brunso-Bechtold JK, Henkel CK. Unilateral cochlear ablation before hearing onset disrupts the maintenance of dorsal nucleus of the lateral lemniscus projection patterns in the rat inferior colliculus. Neuroscience. 2006;143:105–115. doi: 10.1016/j.neuroscience.2006.07.039. [DOI] [PMC free article] [PubMed] [Google Scholar]
- Franklin SR, Brunso-Bechtold JK, Henkel CK. Bilateral cochlear ablation in postnatal rat disrupts development of banded pattern of projections from the dorsal nucleus of the lateral lemniscus to the inferior colliculus. Neuroscience. 2008;154:346–354. doi: 10.1016/j.neuroscience.2008.02.011. [DOI] [PMC free article] [PubMed] [Google Scholar]
- Gabriele ML, Brunso-Bechtold JK, Henkel CK. Development of afferent patterns in the inferior colliculus of the rat: projection from the dorsal nucleus of the lateral lemniscus. J Comp Neurol. 2000a;416:368–382. doi: 10.1002/(sici)1096-9861(20000117)416:3<368::aid-cne8>3.0.co;2-c. [DOI] [PubMed] [Google Scholar]
- Gabriele ML, Brunso-Bechtold JK, Henkel CK. Plasticity in the development of afferent patterns in the inferior colliculus of the rat after unilateral cochlear ablation. J Neurosci. 2000b;20:6939–6949. doi: 10.1523/JNEUROSCI.20-18-06939.2000. [DOI] [PMC free article] [PubMed] [Google Scholar]
- Gabriele ML, Shahmoradian SH, French CC, Henkel CK, McHaffie JG. Early segregation of layered projections from the lateral superior olivary nucleus to the central nucleus of the inferior colliculus in the neonatal cat. Brain Res. 2007;1173:66–77. doi: 10.1016/j.brainres.2007.07.055. [DOI] [PMC free article] [PubMed] [Google Scholar]
- Gabriele ML, Brubaker DQ, Chamberlain KA, Kross KM, Simpson NS, Kavianpour SM. EphA4 and eprhin-B2 expression patterns during inferior colliculus projection shaping prior to experience. Dev Neurobiol. 2011;71:182–199. doi: 10.1002/dneu.20842. [DOI] [PubMed] [Google Scholar]
- Godement P, Mason CA. It’s all in the assay: a new model for retinotectal topographic mapping. Neuron. 2004;42:697–702. doi: 10.1016/j.neuron.2004.05.018. [DOI] [PubMed] [Google Scholar]
- Henkel CK, Gabriele ML, McHaffie JG. Quantitative assessment of developing afferent patterns in the cat inferior colliculus revealed with calbindin immunohistochemistry and tract tracing methods. Neuroscience. 2005;136:945–955. doi: 10.1016/j.neuroscience.2005.03.020. [DOI] [PMC free article] [PubMed] [Google Scholar]
- Hindges R, McLaughlin T, Genoud N, Henkemeyer M, O’Leary DDM. EphB forward signaling controls directional branch extension and arborization required for dorsal-ventral retinotopic mapping. Neuron. 2002;35:475–487. doi: 10.1016/s0896-6273(02)00799-7. [DOI] [PubMed] [Google Scholar]
- Imai T, Sakano H, Vosshall LB. Topographic mapping—the olfactory system. Cold Spring Harbor Perspect Biol. 2010 doi: 10.1101/cshperspect.a001776. [E-pub ahead of print] [DOI] [PMC free article] [PubMed] [Google Scholar]
- Jones TA, Jones SM, Paggett KC. Primordial rhythmic bursting in embryonic cochlear ganglion cells. J Neurosci. 2001;21:8129–8135. doi: 10.1523/JNEUROSCI.21-20-08129.2001. [DOI] [PMC free article] [PubMed] [Google Scholar]
- Kandler K. Activity-dependent organization of inhibitory circuits: lessons from the auditory system. Curr Opin Neurobiol. 2004;14:96–104. doi: 10.1016/j.conb.2004.01.017. [DOI] [PubMed] [Google Scholar]
- Kandler K, Friauf E. Pre- and postnatal development of efferent connections of the cochlear nucleus in the rat. J Comp Neurol. 1993;328:161–184. doi: 10.1002/cne.903280202. [DOI] [PubMed] [Google Scholar]
- Kandler K, Clause A, Noh J. Tonotopic reorganization of developing auditory brainstem circuits. Nat Neurosci. 2009;12:711–717. doi: 10.1038/nn.2332. [DOI] [PMC free article] [PubMed] [Google Scholar]
- Katz LC, Shatz CJ. Synaptic activity and the construction of cortical circuits. Science. 1996;274:1133–1138. doi: 10.1126/science.274.5290.1133. [DOI] [PubMed] [Google Scholar]
- Kros CJ, Ruppersberg JP, Rusch A. Expression of a potassium current in inner hair cells during development of hearing in mice. Nature. 1998;394:281–284. doi: 10.1038/28401. [DOI] [PubMed] [Google Scholar]
- Kullander K, Klein R. Mechanisms and functions of Eph and ephrin signaling. Nat Rev Mol Cell Biol. 2002;3:475–486. doi: 10.1038/nrm856. [DOI] [PubMed] [Google Scholar]
- Lee R, Petros TJ, Mason CA. Zic2 regulates retinal ganglion cell axon avoidance of ephrinB2 through inducing expression of the guidance receptor EphB1. J Neurosci. 2008;28:5910–5919. doi: 10.1523/JNEUROSCI.0632-08.2008. [DOI] [PMC free article] [PubMed] [Google Scholar]
- Lippe WR. Rhythmic spontaneous activity in the developing avian auditory system. J Neurosci. 1994;14:1486–1495. doi: 10.1523/JNEUROSCI.14-03-01486.1994. [DOI] [PMC free article] [PubMed] [Google Scholar]
- Loftus WC, Bishop DC, Saint Marie RL, Oliver DL. Organization of binaural excitatory and inhibitory inputs to the inferior colliculus from the superior olive. J Comp Neurol. 2004;472:330–344. doi: 10.1002/cne.20070. [DOI] [PubMed] [Google Scholar]
- Loftus WC, Bishop DC, Oliver DL. Differential patterns of inputs create functional zones in central nucleus of inferior colliculus. J Neurosci. 2010;30:13396–1408. doi: 10.1523/JNEUROSCI.0338-10.2010. [DOI] [PMC free article] [PubMed] [Google Scholar]
- Lyckman AW, Jhaveri S, Feldheim DA, Vanderhaeghen P, Flanagan JG, Sur M. Enhanced plasticity of retinothalamic projections in an ephrin-A2/A5 double mutant. J Neurosci. 2001;21:7684–7690. doi: 10.1523/JNEUROSCI.21-19-07684.2001. [DOI] [PMC free article] [PubMed] [Google Scholar]
- Malmierca MS, Saint Marie RL, Merchan MA, Oliver DL. Laminar inputs from dorsal cochlear nucleus and ventral cochlear nucleus to the central nucleus of the inferior colliculus: two patterns of convergence. Neuroscience. 2005;136:883–894. doi: 10.1016/j.neuroscience.2005.04.040. [DOI] [PubMed] [Google Scholar]
- McLaughlin T, O’Leary DDM. Molecular gradients and development of retinotopic maps. Annu Rev Neurosci. 2005;28:327–355. doi: 10.1146/annurev.neuro.28.061604.135714. [DOI] [PubMed] [Google Scholar]
- Merzenich MM, Reid MD. Representation of the cochlea within the inferior colliculus of the cat. Brain Res. 1974;77:397–415. doi: 10.1016/0006-8993(74)90630-1. [DOI] [PubMed] [Google Scholar]
- Miko IJ, Nakamura PA, Henkemeyer M, Cramer KS. Auditory brainstem neural activation patterns are altered in EphA4- and ephrin-B2-deficient mice. J Comp Neurol. 2007;505:669–681. doi: 10.1002/cne.21530. [DOI] [PubMed] [Google Scholar]
- Miller K, Kolk SM, Donoghue MJ. EphA7-ephrin-A5 signaling in mouse somatosensory cortex: developmental restriction of molecular domains and postnatal maintenance of functional compartments. J Comp Neurol. 2006;496:627–642. doi: 10.1002/cne.20926. [DOI] [PubMed] [Google Scholar]
- O’Leary DDM, McLaughlin T. Mechanisms of retinotopic map development: Ephs, ephrins, and spontaneous correlated retinal activity. Prog Brain Res. 2005;147:43–65. doi: 10.1016/S0079-6123(04)47005-8. [DOI] [PubMed] [Google Scholar]
- Oliver DL. Dorsal cochlear nucleus projections to the inferior colliculus in the cat: a light and electron microscopic study. J Comp Neurol. 1984;264:24–46. doi: 10.1002/cne.902240202. [DOI] [PubMed] [Google Scholar]
- Oliver DL. Projections to the inferior colliculus from the anteroventral cochlear nucleus in the cat: possible substrates for binaural interaction. J Comp Neurol. 1987;224:155–172. doi: 10.1002/cne.902640104. [DOI] [PubMed] [Google Scholar]
- Oliver DL. Neuronal organization in the inferior colliculus. In: Winer JA, Schreiner CE, editors. The inferior colliculus. New York: Springer; 2005. pp. 69–114. [Google Scholar]
- Oliver DL, Heurta MF. Inferior and superior colliculi. In: Webster DB, Popper AN, Fay RR, editors. The mammalian auditory pathway, 1st ed. Vol. 1. New York: Springer-Verlag; 1992. pp. 168–221. [Google Scholar]
- Oliver DL, Beckius GE, Bishop DC, Kuwada S. Simultaneous anterograde labeling of axonal layers from lateral superior olive and dorsal cochlear nucleus in the inferior colliculus of cat. J Comp Neurol. 1997;382:215–229. doi: 10.1002/(sici)1096-9861(19970602)382:2<215::aid-cne6>3.0.co;2-6. [DOI] [PubMed] [Google Scholar]
- Petros TJ, Shrestha BR, Mason CA. Specificity and sufficiency of EphB1 in driving the ipsilateral retinal projection. J Neurosci. 2009;29:3463–3474. doi: 10.1523/JNEUROSCI.5655-08.2009. [DOI] [PMC free article] [PubMed] [Google Scholar]
- Rashid T, Upton AL, Blentic A, Ciossek T, Knöll B, Thompson ID, Drescher U. Opposing gradients of ephrin-As and EphA7 in the superior colliculus are essential for topographic mapping in the mammalian visual system. Neuron. 2005;47:57–69. doi: 10.1016/j.neuron.2005.05.030. [DOI] [PubMed] [Google Scholar]
- Roth GL, Aitkin RA, Andersen RA, Merzenich MM. Some features of the spatial organization of the central nucleus of the inferior colliculus of the cat. J Comp Neurol. 1978;182:661–680. doi: 10.1002/cne.901820407. [DOI] [PubMed] [Google Scholar]
- Saldaña E, Merchán MA. Intrinsic and commissural connections of the rat inferior colliculus. J Comp Neurol. 1992;319:417–437. doi: 10.1002/cne.903190308. [DOI] [PubMed] [Google Scholar]
- Schreiner CE, Langner G. Periodicity coding in the inferior colliculus of the cat: II. Topographical organization. J Neurophysiol. 1988;60:1823–1840. doi: 10.1152/jn.1988.60.6.1823. [DOI] [PubMed] [Google Scholar]
- Schreiner CE, Langner G. Laminar fine structure of frequency organization in auditory midbrain. Nature. 1997;388:383–386. doi: 10.1038/41106. [DOI] [PubMed] [Google Scholar]
- Semple MN, Aitkin LM. Respresentation of sound frequency and laterality by units in central nucleus of cat inferior colliculus. J Neurophysiol. 1979;42:1626–1639. doi: 10.1152/jn.1979.42.6.1626. [DOI] [PubMed] [Google Scholar]
- Serizawa S, Miyamichi K, Takeuchi H, Yamagishi Y, Suzuki M, Sakano H. A neuronal identity code for the odorant receptor-specific and activity-dependent axon sorting. Cell. 2006;127:1057–1069. doi: 10.1016/j.cell.2006.10.031. [DOI] [PubMed] [Google Scholar]
- Shneiderman A, Henkel CK. Banding of lateral superior olivary nucleus afferents in the inferior colliculus: a possible substrate for sensory integration. J Comp Neurol. 1987;266:519–534. doi: 10.1002/cne.902660406. [DOI] [PubMed] [Google Scholar]
- Torborg CL, Feller MB. Spontaneous patterned retinal activity and the refinement of retinal projections. Prog Neurobiol. 2005;76:213–235. doi: 10.1016/j.pneurobio.2005.09.002. [DOI] [PubMed] [Google Scholar]
- Torii M, Hackett TA, Rakic P, Levitt P, Polley DB. EphA signaling impacts development of topographic connectivity in auditory cortiofugal systems. Cereb Cortex. 2012 doi: 10.1093/cercor/bhs066. [E-pub ahead of print] [DOI] [PMC free article] [PubMed] [Google Scholar]
- Triplett JW, Phan A, Yamada J, Feldheim DA. Alignment of multimodal sensory input in the superior colliculus through a gradient-matching mechanism. J Neurosci. 2012;32:5264–5271. doi: 10.1523/JNEUROSCI.0240-12.2012. [DOI] [PMC free article] [PubMed] [Google Scholar]
- Tritsch NX, Bergles DE. Developmental regulation of spontaneous activity in the mammalian cochlea. J Neurosci. 2010;328:161–184. doi: 10.1523/JNEUROSCI.3875-09.2010. [DOI] [PMC free article] [PubMed] [Google Scholar]
- Tritsch NX, Yi E, Gale JE, Glowatzki E, Bergles D. The origin of spontaneous activity in the developing auditory system. Nature. 2007;450:50–55. doi: 10.1038/nature06233. [DOI] [PubMed] [Google Scholar]
- Wilkinson DG. Multiple roles of Eph receptors and ephrins in neural development. Nat Rev Neurosci. 2001;2:155–164. doi: 10.1038/35058515. [DOI] [PubMed] [Google Scholar]
- Williams SE, Mann F, Erskine L, Sakurai T, Wei S, Rossi DJ, Gale NW, Holt CE, Mason CA, Henkemeyer M. Ephrin- B2 and EphB1 mediate retinal axon divergence at the optic chiasm. Neuron. 2003;39:919–935. doi: 10.1016/j.neuron.2003.08.017. [DOI] [PubMed] [Google Scholar]


