

Abstract
Aims/Introduction: Impaired fasting glucose (IFG) increases the risk of developing diabetes mellitus (DM). This study was carried out to characterize Japanese patients who have fasting glucose levels (FPG) between 100 and 109 mg/dL (IFG100–109).
Materials and Methods: A total of 1383 Japanese participants were examined by oral glucose tolerance test. We compared insulin secretory capacity (insulinogenic index) and insulin sensitivity (ISI composite) of IFG100–109/normal glucose tolerance (NGT; 100 ≤ FPG < 110 mg/dL and 2‐h postchallenge glucose level (2‐hPG) < 140 mg/dL) with NGT (100 mg/dL < FPG and 2‐hPG < 140 mg/dL) and IFG110–125/NGT (110 ≤ FPG < 126 mg/dL and 2‐hPG < 140 mg/dL). In addition, IFG100–109 patients were analyzed in three subgroups according to glucose intolerance by 2‐hPG.
Results: Of the three categories of IFG100–109, IFG100–109/DM had the lowest insulinogenic index despite an ISI composite showing only a small decline from IFG100–109/NGT through IFG100–109/IGT (100 ≤ FPG < 110 mg/dL and 140 ≤ 2‐hPG < 200 mg/dL) to IFG100–109/DM (100 ≤ FPG < 110 mg/dL and 200 mg/dL < 2‐hPG). By multiple regression analysis, the insulinogenic index showed a significant relationship with 2‐h PG levels. Both insulinogenic index and ISI composite were decreased significantly from NGT through IFG100–109/NGT to IFG110–125/NGT.
Conclusions: Although impaired early‐phase insulin secretion plays the more important role in the elevation of postchallenge glucose in IFG100–109 patients, both impaired early‐phase insulin secretion and decreased insulin sensitivity are involved in the deterioration of FPG in Japanese. In addition, insulin secretory defect and decreased insulin sensitivity already have begun in patients with IFG100–109.(J Diabetes Invest, doi: 10.1111/j.2040‐1124.2012.00201.x, 2012)
Keywords: Impaired fasting glucose, Insulin secretion, Insulin sensitivity
Introduction
The prevalence of type 2 diabetes is increasing dramatically throughout the world; early detection of developing glucose intolerance is important to delay and prevent the disease. The American Diabetes Association (ADA) has lowered the cut‐off value of impaired fasting glucose (IFG) from 110 to 100 mg/dL in 2003. Subjects with fasting plasma glucose (FPG) from 100 to 109 mg/dL together with normal postchallenge glucose levels have been classified as normal glucose tolerance (NGT) by the criteria of the World Health Organization (WHO) and the Japanese Diabetes Society (JDS), but are classified as IFG by the 2003 ADA criteria1–3. Insulin secretory capacity and insulin sensitivity are regulated differently with regard to fasting and postchallenge plasma glucose4,5, and therefore require separate evaluation. In addition, there are ethnic differences in the pathology of developing glucose intolerance. In our previous studies, impaired insulin secretion is shown to play an especially important role in both diabetic and pre‐diabetic Japanese subjects4,5, in contrast to the increasing insulin resistance that is the more important factor in Caucasian, Mexican American and Pima Indian populations6,7. In the present cross‐sectional study, we analyzed 1383 Japanese patients with fasting plasma glucose between 100 and 109 mg/dL (IFG100–109) to characterize and compare insulin secretory capacity, and insulin sensitivity of Japanese patients with IFG100–109 in the development of glucose intolerance.
Methods
Subjects
A total of 1835 Japanese patients undergoing 75‐g oral glucose tolerance test (OGTT) as a result of positive urine glucose test, ≥5.5% glycated hemoglobin (HbA1c) level, ≥100 mg/dL fasting plasma glucose (FPG) level, and family history of diabetes at initial examination for medical check‐up at Kyoto University Hospital, Ikeda Hospital, Kansai Electric Power Hospital, Kansai Health Management Center, Center for Preventive Medicine of St. Luke’s International Hospital and Kyoto Preventive Medical Center from 1993 to 2009 were examined. Originally, 358 patients who had hypertension, hepatic or renal dysfunction, endocrine or malignant disease, or history of heavy exercise, gastrectomy, or medication known to affect glucose metabolism were excluded from 2193 patients. Among the 1835 patients, 470 patients were excluded because of fasting glucose levels ≥ 126 mg/dL and postchallenge glucose levels ≥ 140 mg/dL with FPG ≥ 110 mg/dL and FPG < 100 for the present study, and 1383 patients were included. The study was designed in compliance with the ethics regulations of the Helsinki Declaration, and the study protocol was approved by the ethics committee of St. Luke’s International Hospital.
Standard OGTT with 75‐g glucose was given according to the National Diabetes Data Group recommendations8, which require patients to fast overnight for 10–16 h. Fasting, 0.5, 1, and 2‐h blood samples were obtained for measurement of plasma glucose and serum insulin after oral administration of 75‐g glucose. Blood samples for measurement of HbA1c, total cholesterol, high‐density lipoprotein cholesterol (HDL‐C) and triglyceride levels were collected after overnight fast.
The subjects that underwent 75‐g OGTT were divided into two groups: one having normal postchallenge glucose (2‐hPG < 140 mg/dL) and another having IFG100–109 (100 ≤ FPG < 110 mg/dL). The subjects of each group also were divided into three groups as shown in Figure 1.
Figure 1.
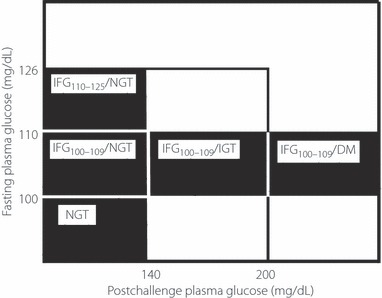
Subgroups of impaired fasting glucose. DM, diabetes mellitus; IFG, impaired fasting glucose; IGT, impaired glucose tolerance; NGT, normal glucose tolerance.
Group one had normal postchallenge glucose: NGT (n = 594); normal fasting glucose according to ADA (FPG < 100 mg/dL) with normal postchallenge glucose, IFG100–109/NGT (n = 369); IFG100–109 (100 ≤ FPG < 110 mg/dL) with normal postchallenge glucose, IFG110–125/NGT (n = 160); and IFG (110 ≤ FPG < 126 mg/dL) with normal postchallenge glucose. Group two had IFG100–109: IFG100–109/NGT (n = 369); IFG100–109 with normal postchallenge glucose, IFG100–109/IGT (n = 225); IFG100–109 with impaired glucose tolerance (IGT; 140 ≤ 2‐hPG < 200 mg/dL), and IFG100–109/diabetes mellitus (DM; n = 35); IFG100–109 with postchallenge hyperglycemia (200 mg/dL ≤ 2‐hPG; Figure 1).
Measurements
Plasma glucose level was measured by the glucose oxidase method using a Hitachi Automatic Clinical Analyzer 7170 (Hitachi, Tokyo, Japan). Serum insulin was measured by two‐site radioimmunoassay (Insulin Riabead II; Dainabot, Tokyo, Japan), as reported previously9. HbA1c was measured by HLC‐723G7 (Tosoh, Tokyo, Japan). Coefficients of variation (CVs) were 0.56% for plasma glucose, <7% for insulin and <2% for HbA1c. Serum total cholesterol and triglycerides levels were measured as reported previously10.
Blood samples were collected at 0, 30, 60 and 120 min after OGTT, and plasma glucose and serum insulin levels were measured for all subjects. Blood samples for measurements of HbA1c, total cholesterol, HDL‐C and triglycerides were drawn after an overnight fast. The HbA1c value was estimated as a National Glycohemoglobin Standardization Program (NGSP) equivalent value calculated by the formula: HbA1c (NGSP) = HbA1c (JDS) + 0.4%, considering the relational expression of HbA1c (JDS) measured by the previous Japanese standard substance and measurement methods and HbA1c (NGSP)2.
Early‐phase insulin secretion and systemic insulin sensitivity during OGTT were evaluated by insulinogenic index11–13, and Insulin sensitivity was determined by an OGTT based on the formula for the composite of insulin sensitivity index (ISI composite)14. Insulinogenic index < 0.4 is considered in Japanese to be decreased early‐phase insulin secretion according to the ‘Report of The Committee on the Classification and Diagnostic Criteria of Diabetes Mellitus’ by the Committee of the Japan Diabetes Society on the Diagnostic Criteria of Diabetes Mellitus2. The calculations were as follows:
We compared these two indices between IFG subgroups and NGT as shown in Figure 1 in this cross‐sectional study.
Statistical Analysis
All of the statistical analyses were carried out using SPSS version 19.0 (SPSS Japan, Tokyo, Japan). Clinical characteristics of the study subjects are described using mean ± standard deviation, and general analysis of variance (ANOVA) was carried out for between‐group comparisons. The differences were established by post‐hoc Bonferroni test for multiple comparisons. P‐values <0.05 were considered statistically significant. Multiple stepwise regression analysis was done using AUC‐G and 2‐h PG as the dependent variables, and age, body mass index (BMI), ISI composite and insulinogenic index as the independent variables among the IFG100–109 subgroups. In addition, simple regression analysis was applied between insulinogenic index and area under the curve of glucose (AUC‐G), and also between insulinogenic index and 2‐hPG, as the insulinogenic index showed the strongest relationship with these two factors.
Results
Comparison of NGT, IFG100–109/NGT and IFG110–125/NGT
Clinical Characteristics
Table 1 shows the clinical and metabolic characteristics of the 1123 Japanese patients classified with NGT, IFG100–109/NGT and IFG110–125/NGT. The age and BMI (mean ± standard error) of the total of the three groups were 51.3 ± 0.4 years and 22.9 ± 0.2, respectively. The mean age of the NGT group was significantly lower than that of the other two groups (P < 0.05). The differences in BMI were significant among the three groups (P < 0.05, respectively). There was no significant difference in triglycerides, total cholesterol or HDL‐C, although HbA1c showed significant differences among the three groups (P < 0.001, respectively).
Table 1. Clinical and metabolic characteristics of NGT, IFG100–109/NGT and IFG110–125/NGT.
| NGT | IFG100–109/NGT | IFG110–125/NGT | |
|---|---|---|---|
| n | 594 | 369 | 160 |
| Age (years) | 48.6 ± 0.6 | 54.2 ± 0.6* | 54.7 ± 0.7* |
| BMI (kg/m2) | 22.2 ± 0.1 | 23.1 ± 0.2 | 24.9 ± 1.2*,** |
| FPG (mg/dL) | 90.3 ± 0.3 | 104.1 ± 0.2* | 114.8 ± 0.3*,*** |
| 2‐h PG (mg/dL) | 104.5 ± 0.8 | 112.8 ± 0.9* | 112.5 ± 1.5* |
| Fasting insulin (pmol/L) | 33.3 ± 0.7 | 37.5 ± 1.0* | 40.2 ± 1.6* |
| HbA1c (%) | 5.3 ± 0.0 | 5.7 ± 0.0* | 5.9 ± 0.0*,*** |
| Triglycerides (mmol/L) | 1.26 ± 0.06 | 1.23 ± 0.05 | 1.28 ± 0.10 |
| Total cholesterol (mmol/L) | 5.28 ± 0.06 | 5.34 ± 0.05 | 5.38 ± 0.09 |
| HDL cholesterol (mmol/L) | 1.61 ± 0.03 | 1.63 ± 0.03 | 1.62 ± 0.05 |
Data are mean ± standard error. BMI, body mass index; FPG, fasting plasma glucose; HbA1c, glycated hemoglobin; HDL, high‐density lipoprotein; PG, plasma glucose. *P < 0.05 (vs normal glucose tolerance [NGT]); **P < 0.05 (vs impaired fasting glucose [IFG]100–109/NGT); ***P < 0.001 (vs IFG100–109/NGT).
Insulin Secretion
The insulinogenic indices of the three groups are shown in Figure 2a; NGT 0.48, IFG100–109/NGT 0.39, IFG110–125/NGT 0.27. The insulinogenic index in the NGT group was significantly higher than that in the other groups (P < 0.05). The insulinogenic index in the IFG100–109/NGT group was <0.4.
Figure 2.
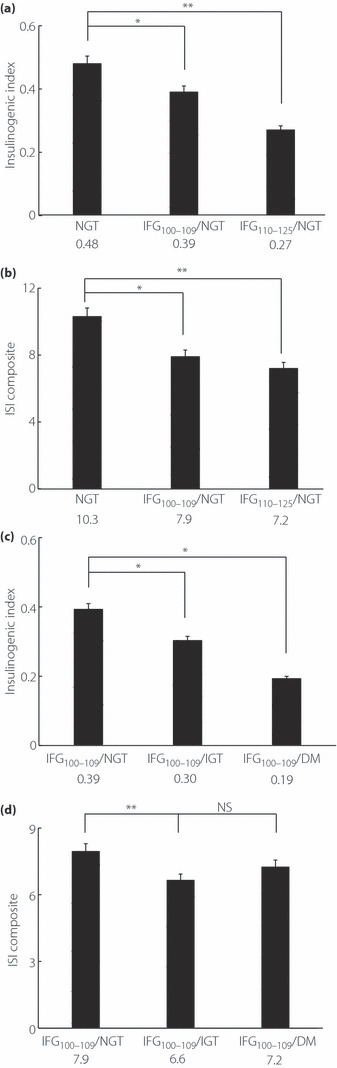
Indices of insulin secretion and sensitivity. (a) Early‐phase insulin secretion. Insulinogenic index in normal glucose tolerance (NGT) is highest and shows significant differences compared with the other two groups (NGT and impaired fasting glucose (IFG)100–109/NGT: P = 0.026, NGT and IFG110–125/NGT: P ≤ 0.001). (b) Insulin sensitivity. Insulin sensitivity index (ISI) composite in NGT is significantly higher than the other groups. (NGT and IFG100–109/NGT: P ≤ 0.001, NGT and IFG110–125/NGT: P ≤ 0.001). (c) Early‐phase insulin secretion. The difference of insulinogenic index is significant except between IFG100–109/impaired glucose tolerance (IGT) and IFG100–109/diabetes mellitus (DM; IFG100–109/NGT and IFG100–109/IGT: P = 0.023, IFG100–109/NGT and IFG100–109/DM: P = 0.013). (d) Insulin sensitivity. The difference of ISI composite is significant only between IFG100–109/NGT and IFG100–109/IGT (IFG100–109/NGT and IFG100–109/IGT: P ≤ 0.001). *P < 0.05; **P < 0.001. NS, not significant.
Insulin Sensitivity
Figure 2b shows the ISI composites: NGT 10.3, IFG100–109/NGT 7.9, IFG110–125/NGT 7.2. ISI composite in the NGT was significantly higher than in the other groups (P < 0.001).
Comparison of IFG100–109/NGT, IFG100–109/IGT and IFG100–109/DM
Clinical Characteristics
Table 2 shows the clinical and metabolic characteristics of the 629 Japanese patients classified with IFG100–109/NGT, IFG100–109/IGT and IFG100–109/DM. The age and BMI (mean ± standard error) of all of the patients were 55.2 ± 0.4 years and 23.5 ± 0.1, respectively. However, the BMI of IFG100–109/NGT subjects were significantly lower (P < 0.05). There was a significant difference in age only between IFG100–109/NGT and IFG100–109/DM. The differences in triglycerides and total cholesterol were significant only between IFG100–109/NGT and IFG100–109/IGT (P < 0.05). There was no significant difference in HDL‐C, except for HbA1c, which showed significant differences among the three groups (P < 0.001, respectively).
Table 2. Clinical and metabolic characteristics of IFG100–109/NGT, IFG100–109/IGT and IFG100–109/DM.
| IFG100–109/NGT | IFG100–109/IGT | IFG100–109/DM | |
|---|---|---|---|
| n | 369 | 225 | 35 |
| Age (years) | 54.2 ± 0.6 | 56.3 ± 0.7 | 58.9 ± 1.9* |
| BMI (kg/m2) | 23.1 ± 0.2 | 24.0 ± 0.2 | 24.6 ± 0.8* |
| FPG (mg/dL) | 104.1 ± 0.2 | 104.7 ± 0.3* | 105.1 ± 0.5 |
| 2‐h PG (mg/dL) | 112.8 ± 0.9 | 161.8 ± 1.1** | 223.8 ± 3.7**,*** |
| Fasting insulin (pmol/L) | 37.5 ± 1.0 | 44.6 ± 1.9** | 41.2 ± 3.9 |
| HbA1c (%) | 5.7 ± 0.0 | 5.8 ± 0.0** | 6.2 ± 0.1**,*** |
| Triglycerides (mmol/L) | 1.23 ± 0.05 | 1.64 ± 0.11** | 1.35 ± 0.13 |
| Total cholesterol (mmol/L) | 5.34 ± 0.05 | 5.54 ± 0.07* | 5.54 ± 0.17 |
| HDL cholesterol (mmol/L) | 1.63 ± 0.03 | 1.53 ± 0.04 | 1.59 ± 0.12 |
Data are mean ± standard error. BMI, body mass index; FPG, fasting plasma glucose; HbA1c, glycated hemoglobin; HDL, high‐density lipoprotein; PG, plasma glucose. *P < 0.05 (vs impaired fasting glucose [IFG]100–109/normal glucose tolerance [NGT]); **P < 0.001 (vs IFG100–109/NGT); ***P < 0.001 (vs IFG100–109/impaired glucose tolerance [IGT]).
Insulin Secretion
The insulinogenic indices of the three groups are shown in Figure 2c. The insulinogenic index showed a significant difference between IFG100–109/NGT and the others (P < 0.05), and the insulinogenic index of IFG100–109/DM (0.19) was nearly 50% compared with IFG100–109/NGT (0.39). The insulinogenic index (II) in the IFG100–109/NGT (0.39) group was <0.4.
Insulin Sensitivity
Figure 2d shows the ISI composite of the three groups. There was a significant difference only between IFG100–109/NGT and IFG100–109/IGT (P < 0.001), which showed a 9% decline from IFG100–109/NGT (7.9) to IFG100–109/DM (7.2).
Simple and Multiple Regression Analysis
We examined the relationship between the dependent variables AUC‐G and 2‐hPG, and the independent variables of age, BMI, ISI composite and insulinogenic index by multiple regression analysis. Insulinogenic index showed the strongest relationship with AUC‐G and 2‐hPG (β of 2 h‐PG: age 0.11, BMI 0.10, II −0.215, ISI composite −0.164; and β of AUC‐G: age 0.082, BMI 0.048, II −0.545, ISI composite −0.350). Figure 3a shows scattered plots of simple regression analysis of AUC‐G with insulinogenic index and ISI composite. Insulinogenic index (r = 0.454, P < 0.001, F‐value 16.3) had a stronger relationship with AUC‐G than with ISI composite (r = 0.232, P < 0.001, F‐value 35.7). Figure 3b shows scattered plots of simple regression analysis of 2‐hPG with insulinogenic index and ISI composite. Insulinogenic index (r = 0.165, P < 0.001, F‐value 17.5) was more related to 2‐hPG than to ISI composite (r = 0.150, P < 0.001, F‐value 14.5).
Figure 3.
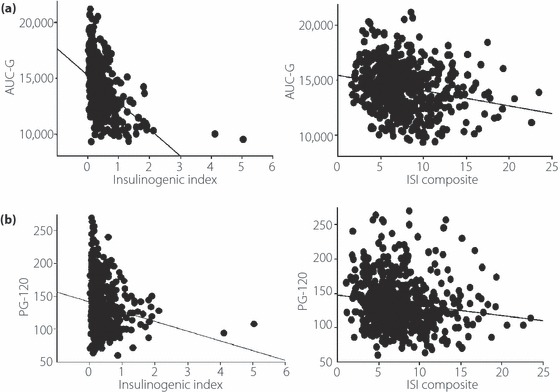
(a) The relationship between area under the curve of glucose (AUC‐G), and insulinogenic index and insulin sensitivity index (ISI) composite among the impaired fasting glucose (IFG)100–109 groups. Insulinogenic index (r = 0.454, P < 0.001, F‐value 16.3) was more related to AUC‐G than ISI composite (r = 0.232, P < 0.001, F‐value 35.7). (b) The relationship between 2‐h postchallenge glucose level (PG‐120), and insulinogenic index and ISI composite. Insulinogenic index (r = 0.165, P < 0.001, F‐value 17.5) was more related to PG‐120 than ISI composite (r = 0.150, P < 0.001, F‐value 14.5).
Discussion
In the present study, we analyzed insulin secretory capacity and insulin sensitivity in a cross‐sectional study in Japanese subjects who had IFG100–109 (IFG100–109; 100 ≤ FPG < 110 mg/dL). A reduction in the insulinogenic index, a measure of early‐phase insulin secretion, has already begun in IFG100–109/NGT subjects, for which the insulinogenic index was 0.39 (Figure 2a). The ISI composite, an index of systemic insulin sensitivity, is also decreased in the deterioration of FPG from NGT through IFG100–109/NGT to IFG110–125/NGT (Figure 2b). IFG100–109/NGT subjects are classified into normal fasting glucose tolerance according to the 1998 WHO criteria and the criteria of the JDS, although they are classified into IFG based on the 2003 ADA criteria. There are numerous studies of impaired fasting glucose that justify the new ADA criteria, but few studies focus on the borderline IFG100–109 group regarding the relevance of insulin secretory capacity and insulin sensitivity in the development of disease. The present study showed deterioration of both early‐phase insulin secretion and insulin sensitivity in IFG100–109/NGT. To clarify the pathology, we evaluated IFG100–109 subjects in three subgroups: IFG100–109/NGT, IFG100–109/IGT and IFG100–109/DM. The mean insulinogenic indices were found to decrease from IFG100–109/NGT through IFG100–109/IGT to IFG100–109/DM (0.39 [<0.40], 0.30 and 0.19, respectively), and those of IFG100–109/IGT and IFG100–109/DM were significantly lower than that of IFG100–109/NGT. In contrast, the differences among ISI composites in IFG100–109/NGT, IFG100–109/IGT and IFG100–109/DM were small. In addition, IFG100–109/DM showed a stronger deterioration in insulin secretory capacity and insulin sensitivity than in IFG110–125/NGT (P < 0.05). These results agree with those of our previous studies in Japanese subjects that show that impairment of early‐phase insulin secretion plays the more important role in the deterioration of postchallenge glucose tolerance, whereas insulin resistance plays a lesser role15.
It is notable that IFG100–109/IGT and IFG100–109/DM are included into IFG100–109 if judged only by FPG. Although this study is not a population‐based study, over 40% of the subjects with IFG100–109 also were classified as IGT or DM. This suggests that DM, as well as IGT, might be overlooked when screening by FPG among subjects with IFG100–109. IFG has been reported as high risk for developing type 2 diabetes. In a study of Japanese subjects, those with IFG100–109 developed type 2 diabetes at twice the rate as NGT during 4 years16. Bonora et al.17 found that diabetic incidence rates for 10 years of IGT, IFG and IFG/IGT were 3.9, 11 and 20.5 compared with that of NGT, respectively. Meigs et al.18 found that 40% of isolated IFG progressed to diabetes. According to the Funagata study, the risk for type 2 diabetes in Japanese with isolated IFG is 20.5 compared with that in NGT19. IFG subjects, therefore, require checking of postchallenge plasma glucose levels by OGTT to prevent or delay diabetes.
Regarding insulin secretory capacity and insulin sensitivity, fasting and postchallenge plasma glucose levels are regulated differently20. Hyperglycemia in Japanese patients is typically as a result of factors that differ from those in other ethnic groups, impaired insulin secretion and sensitivity being most notable. We have previously reported that although impaired early‐phase insulin secretion plays the more important role in deterioration from NGT through IGT to isolated postchallenge hyperglycemia in Japanese subjects9, progression from NGT through IFG to isolated fasting hyperglycemia is associated with both impaired insulin secretion and decreased insulin sensitivity21. However, impaired insulin secretion is the more important factor in Japanese subjects, whereas increasing insulin resistance is the more important factor in Caucasians, Mexican Americans and Pima Indians7,22. The mean BMI of Japanese diabetics is 23–25 according to various epidemiological studies, which is lower than that in other ethnic groups4,23. It has also been reported that the insulinogenic index in IGT is greater than that in NGT in Caucasians, in whom insulin secretion peaks at 121 mg/dL of plasma glucose24 compared with 100 mg/dL in Japanese25. The diversities in these groups suggest the importance of characterizing both insulin secretion and sensitivity in the different stages of glucose intolerance. In the present study, for the prevention of type 2 diabetes and the selection of suitable treatments, we analyzed IFG100–109, which has not been addressed with regard to insulin secretory capacity and insulin sensitivity. The present results in Japanese subjects with IFG100–109 show that lesser reserve capacity of insulin secretion rather than greater insulin resistance is involved in deteriorating 2‐hPG and AUC‐G.
We have found that deterioration of both insulin secretory capacity and insulin sensitivity has already begun in IFG100–109/NGT. In addition, early‐phase insulin secretion plays an important role in the deterioration of postchallenge glucose levels among Japanese subjects with slightly impaired fasting glucose of IFG100–109, whereas insulin sensitivity plays a more limited role. Over 40% of IFG100–109 subjects were classified into IGT or diabetes according to 2‐hPG during OGTT. Therefore, Japanese IFG100–109 subjects classified into normal glucose tolerance according to the WHO criteria and the JDS criteria are recommended to be screened by OGTT to identify whether they are NGT, IGT or diabetes.
Acknowledgements
This research was supported by the Leading Project of Biosimulation, Kobe Translational Research Cluster and the Knowledge Cluster Initiative from the Ministry of Education, Culture, Sports, Science and Technology, Japan, Research grant from Japan Diabetes Society and Manpei Suzuki Diabetes Foundation. The authors do not have any financial support or relationships that pose a conflict of interest. We thank Use Techno Corporation, Ono Pharmaceutical Co. Ltd., Abbott Japan Co. Ltd. and Dainippon Sumitomo Pharma Co. Ltd. for their help in this study.
References
- 1.Alberti KG, Zimmet PZ. Definition, diagnosis and classification of diabetes mellitus and its complications. Part 1: diagnosis and classification of diabetes mellitus provisional report of a WHO consultation. Diabet Med 1998; 15: 539–553 [DOI] [PubMed] [Google Scholar]
- 2.The Committee of the Japan Diabetes Society on the Diagnostic Criteria of Diabetes Mellitus . Report of the committee on the classification and diagnostic criteria of diabetes mellitus. J Diabetes Invest 2010; 1: 212–228 [DOI] [PMC free article] [PubMed] [Google Scholar]
- 3.The Expert Committee on the Diagnosis and Classification of Diabetes Mellitus . Follow‐up on the diagnosis of diabetes mellitus. Diabetes Care 2003; 26: 3160–3167 [DOI] [PubMed] [Google Scholar]
- 4.Fukushima M, Usami M, Ikeda Y, et al. Insulin secretion and insulin sensitivity at different stages of glucose tolerance: a cross‐sectional study of Japanese type 2 diabetes. Metabolism 2004; 53: 831–835 [DOI] [PubMed] [Google Scholar]
- 5.Mitsui R, Fukushima M, Nishi Y, et al. Factors responsible for deteriorating glucose tolerance in newly diagnosed type 2 diabetes in Japanese men. Metabolism 2006; 55: 53–58 [DOI] [PubMed] [Google Scholar]
- 6.Haffner SM, D’Agostino R, Saad MF, et al. Increased insulin resistance and insulin secretion in nondiabetic African‐Americans and Hispanics compared with non‐Hispanic whites. The Insulin Resistance Atherosclerosis Study. Diabetes 1995; 45: 742–748 [DOI] [PubMed] [Google Scholar]
- 7.Haffner SM, Stern MP, Hazuda HP, et al. Increased insulin concentrations in nondiabetic offspring of diabetic parents. N Engl J Med 1998; 319: 1297–1301 [DOI] [PubMed] [Google Scholar]
- 8.National Diabetes Data Group. Classification and diagnosis of diabetes mellitus and other categories of glucose intolerance. Diabetes 1979; 28: 1039–1057 [DOI] [PubMed] [Google Scholar]
- 9.Suzuki H, Fukushima M, Usami M, et al. Factors responsible for development from normal glucose tolerance to isolated post challenge hyperglycemia. Diabetes Care 2003; 26: 1211–1215 [DOI] [PubMed] [Google Scholar]
- 10.Taniguchi A, Fukushima M, Sakai M, et al. Remnant‐like particle cholesterol, triglycerides, and insulin resistance in nonobese Japanese type 2 diabetic patients. Diabetes Care 2000; 23: 1766–1769 [DOI] [PubMed] [Google Scholar]
- 11.Harada N, Fukushima M, Toyoda K, et al. Factors responsible for elevation of 1‐h postchallenge plasma glucose levels in Japanese men. Diabetes Res Clin Pract 2008; 81: 284–289 [DOI] [PubMed] [Google Scholar]
- 12.Abdul‐Ghani MA, Jenkinson CP, Richardson DK, et al. Insulin secretion and action in subjects with impaired fasting glucose and impaired glucose tolerance: results from the Veterans Administration Genetic Epidemiology Study. Diabetes 2006; 55: 1430–1435 [DOI] [PubMed] [Google Scholar]
- 13.Seltzer HS, Allen EW, Herron AL Jr, et al. Insulin secretion in response to glycemic stimulus: relation of delayed initial release to carbohydrate intolerance in mild diabetes. J Clin Invest 1967; 46: 323–335 [DOI] [PMC free article] [PubMed] [Google Scholar]
- 14.Matsuda M, Defronzo RA. Insulin sensitivity indices obtained from oral glucose tolerance testing: comparison with the euglycemic insulin clamp. Diabetes Care 1999; 22: 1462–1470 [DOI] [PubMed] [Google Scholar]
- 15.Fukushima M, Suzuki H, Seino Y. Insulin secretion capacity in the development from normal glucose tolerance to type 2 diabetes. Diabetes Res Clin Pract 2004; 66: S37–S43 [DOI] [PubMed] [Google Scholar]
- 16.Sato KK, Nakamura Y, Hayashi T, et al. Combined measurement of fasting plasma glucose and A1c is effective for the prediction of Type 2 diabetes. Diabetes Care 2009; 32: 644–646 [DOI] [PMC free article] [PubMed] [Google Scholar]
- 17.Bonora E, Kiechl S, Willeit J, et al. Population‐based incidence rates and risk factors for type 2 diabetes in white individuals: the Bruneck study. Diabetes 2004; 53: 1782–1789 [DOI] [PubMed] [Google Scholar]
- 18.Meigs JB, Muller DC, Nathan DM, et al. The natural history of progression from normal glucose tolerance to type 2 diabetes in the Baltimore Longitudinal Study of Aging. Diabetes 2003; 52: 1475–1484 [DOI] [PubMed] [Google Scholar]
- 19.Eguchi H, Kato T, Tominaga M. Significance of IGT and impaired fasting glucose on the risk of development of diabetes. The Funagata study. Diabetes (Japan) 1998; 41: A107–A109 [Google Scholar]
- 20.Faerch K, Borch‐Johnson K, Holsy JJ, et al. Pathophysiology and aetiology of impaired fasting glycaemia and impaired glucose tolerance: does it matter for prevention and treatment of type 2 diabetes? Diabetologia 2009; 52: 1714–1723 [DOI] [PubMed] [Google Scholar]
- 21.Nishi Y, Fukushima M, Mitsui R, et al. Insulin secretion and insulin sensitivity in Japanese subjects with impaired fasting glucose and isolated fasting hyperglycemia. Diabetes Res Clin Pract 2005; 70: 46–52 [DOI] [PubMed] [Google Scholar]
- 22.Saad MF, Knowler WC, Pettitt DJ, et al. A two‐step model for development of non–insulin‐dependent diabetes. Am J Med 1991; 90: 229–235 [PubMed] [Google Scholar]
- 23.Tripathy D, Carlsson M, Almgren P, et al. Insulin secretion and insulin sensitivity in relation to glucose tolerance: lessons from the Botnia Study. Diabetes 2000; 49: 975–980 [DOI] [PubMed] [Google Scholar]
- 24.DeFronzo RA. Lilly lecture 1987. The triumvirate: beta‐cell, muscle, liver. A collusion responsible for NIDDM. Diabetes 1998; 37: 667–687 [DOI] [PubMed] [Google Scholar]
- 25.Seino Y, Ikeda M, Yawata M, et al. The insulinogenic index in secondary diabetes. Horm Metab Res 1975; 7: 107–115 [Google Scholar]