

Abstract
Aims/Introduction
To compare safety and efficacy of the extended‐release formulation exenatide once weekly (EQW) vs exenatide twice daily (EBID) for 26 weeks in type 2 diabetes patients from China, India, Japan, South Korea and Taiwan.
Materials and Methods
A randomized, comparator‐controlled, open‐label study included 681 patients with type 2 diabetes inadequately controlled (hemoglobin A1c [HbA1c] ≥7 and ≤11%) with oral antihyperglycemic medications (OAMs). Patients added 2 mg EQW or 10 μg EBID to current OAMs. Safety was re‐evaluated 10 weeks after last treatment.
Results
EQW was superior to EBID on HbA1c measures at week 26 (Least‐squares mean treatment difference: −0.31% [95% confidence interval −0.49, −0.14%]). More EQW‐treated patients achieved target HbA1c ≤7.0% (P = 0.003), ≤6.5% (P < 0.001), or ≤6.0% (P = 0.003). Fasting serum glucose reductions were greater among EQW‐treated patients (P < 0.001). Blood glucose profiles improved in both treatment groups (P < 0.001). Weight loss occurred with both treatments, but was greater with EBID. Adverse events (≥10%, either group) were nausea, injection‐site induration, dyslipidemia and vomiting. Injection‐site induration was more frequent with EQW, whereas nausea, vomiting and hypoglycemia were less frequent. One episode each of major hypoglycemia (EBID) and pancreatitis (EQW) were reported.
Conclusion
In this population, EQW and EBID showed efficacious glucose and weight control; safety and tolerability were consistent with observations in non‐Asian patients. This trial was registered with ClinicalTrials.gov (no. NCT00917267).
Keywords: Asian, Exenatide, Type 2 diabetes
Introduction
Diabetes is an increasingly prevalent chronic condition in Asia. India, China and Japan are ranked among the top 10 countries with the highest estimated number of patients with diabetes1. Although less likely than Western populations to be overweight or obese2, Asian populations have a greater tendency for more visceral fat and less muscle mass4, characteristics that increase the risk for insulin resistance and diabetes at a lower body mass index (BMI). Rising insulin resistance is met with inadequate β‐cell response among Asian adults with relatively low bodyweight and BMI6, including those with normal glucose tolerance8. These factors help to explain the substantial prevalence of diabetes in Asia despite low obesity rates.
First‐line treatment for type 2 diabetes generally includes oral antihyperglycemic medications (OAMs). Metformin (MET) is typically recommended – largely due to the benefits observed in overweight patients9 – although sulfonylureas (SUs) are the most commonly prescribed OAMs in Asia, and thiazolidinediones (TZD) are also used11. Higher use of SUs might be due, in part, to the metabolic attributes and low BMI of Asians, relative to non‐Asians, with diabetes. Despite treatment with OAMs, patients eventually experience increasingly inadequate glycemic control as the duration of diabetes increases13, and must transition to more advanced therapy to maintain glycemic targets9.
Exenatide, a glucagon‐like peptide‐1 (GLP‐1) receptor agonist indicated for treatment of type 2 diabetes in adults not achieving adequate glycemic control on maximally tolerated doses of OAMs, has multiple glucoregulatory effects, including enhanced glucose‐dependent insulin secretion, suppression of inappropriately elevated postprandial glucagon secretion and slowing of gastric emptying16. The exenatide twice‐daily (EBID) formulation has been shown to improve glycemic control, as well as other metabolic measures, with a similar safety profile19 when used adjunctively with MET and/or a SU in Asian19 and non‐Asian patients with type 2 diabetes22.
An extended‐release formulation of exenatide (EQW), developed as a once‐weekly injection, has also been shown to improve glycemic control and other metabolic measures, without increasing the risk of clinically significant hypoglycemia26.
The present study assessed whether EQW 2‐mg given once weekly is non‐inferior to EBID 10‐μg given twice daily with regard to glycemic control and safety after 26 weeks of treatment in Asian patients with type 2 diabetes.
Materials and Methods
Participants, Materials and Methods
Patients were male and female, aged ≥20 years and had inadequate glycemic control (hemoglobin A1c [HbA1c] ≥7 and ≤11%) while treated with a stable dose of OAMs (i.e. MET, SU, TZD, MET plus SU, MET plus TZD, or SU plus TZD) for at least 3 months before screening. Before study entry, patients were required to have a stable bodyweight, and BMI ≥ 21 and ≤35 kg/m2. Female patients were not pregnant. Patients were excluded if they had other clinically significant medical conditions or had taken excluded medications within 90 days of screening, or had ≥2 episodes of severe hypoglycemia within 6 months of screening.
Patients from 49 sites in China, India, Japan, South Korea and Taiwan participated (August 2009 to September 2010). The clinical protocol was approved by an ethical review board at each study site and was in accordance with the ethical principles described in the Declaration of Helsinki. Before study start, informed consent was obtained from each patient in compliance with the International Conference on Harmonization Guideline on Good Clinical Practice.
This randomized, open‐label, multicenter, comparator‐controlled, two‐arm study was designed to evaluate glucose control and safety in patients with type 2 diabetes after 26 weeks of treatment with EQW vs EBID. In the 2‐week screening period, patients were screened for eligibility and discontinued from alpha glucosidase inhibitors or meglitinide derivatives. Patients were stratified by country and OAM treatment (±SU), and randomized by computer‐generated random sequence to add either EQW or EBID to current therapy. EBID patients subcutaneously injected 5 μg twice‐daily for the first 4 weeks, followed by EBID 10 μg twice‐daily for the remaining 22 weeks, while EQW patients injected 2 mg once‐weekly for 26 weeks. All patients continued the same doses of MET or TZD (SU dosages were decreased to the country‐specific minimum for the duration of the study). A follow‐up visit occurred approximately 10 weeks after the last study treatment visit.
If hypoglycemia occurred, SU treatment could be discontinued, but not restarted. Protocol‐required reasons for study withdrawal included need for treatment with another antidiabetes agent, MET or TZD dosage change for >14 days, insulin use for >7 days, evidence of pancreatitis, a serious adverse event (SAE) or abnormal laboratory value that warranted withdrawal.
Study Outcome Measures
The primary outcome measure was the difference between EQW 2 mg and EBID 10 μg in change in HbA1c from baseline to week 26. Secondary outcome measures included the proportion of patients achieving HbA1c ≤7, ≤6.5 and ≤ 6.0%; fasting serum glucose (FSG); 6‐point self‐monitoring blood glucose (SMBG; before and after morning, midday, and evening meals); change in bodyweight; fasting serum lipids; and homeostasis model assessment of β‐cell function (HOMA‐B) and insulin sensitivity (HOMA‐S). Incidence of hypoglycemic events, and changes in laboratory values and vital signs were also measured. Treatment‐emergent adverse events (TEAEs) were assessed at each visit, regardless of relationship to study drug.
Statistical Analysis
Analyses were carried out using sas version 9.1 (SAS Institute, Cary, NC, USA). In the primary analysis, if non‐inferiority was achieved, a test for superiority was carried out. A sample size of approximately 306 patients per treatment arm was estimated to provide 98% power to detect a true difference of 0.4% in change in HbA1c from baseline (α = 0.05; two‐sided t‐test). All analyses were carried out using the intent‐to‐treat (ITT) population, defined as patients who took at least one dose of study drug. HbA1c values are shown as National Glycohemoglobin Standardization Program values. The primary efficacy outcome was analyzed by maximum likelihood‐based, mixed‐model repeated measures (MMRM) analysis of covariance (ANCOVA) with treatment, baseline HbA1c, country, OAM stratum at screening, week of visit and treatment‐by‐week interaction as fixed effects, and with patient and error as random effects. Least‐squares means (LSMs) of the treatment difference and 95% confidence intervals (CI) estimated the magnitude of treatment difference. The LSMs difference estimated the magnitude of treatment effect. Non‐inferiority of EQW was concluded if the upper limit of the 95% CI for the treatment difference was <0.4%. Superiority was concluded if the upper limit of the 95% CI was <0.
The proportion of patients achieving HbA1c ≤7, ≤6.5 and ≤6.0% at week 26 was compared between treatment groups using a Cochran–Mantel–Haenszel test that controlled for country and SU use. The remaining treatment group comparisons were made using a MMRM ANCOVA model similar to that described earlier; the baseline values of the dependent variable were covariates. Triglyceride, HOMA‐B and HOMA‐S values were logarithmically transformed for the analysis of treatment group differences.
Clinical laboratory evaluations and incidences of TEAEs, SAEs and hypoglycemic episodes were summarized at baseline, end‐point and each visit. Treatment‐emergent adverse events were defined as those that occurred after the patient had received the first dose of exenatide. Minor hypoglycemia was defined as signs or symptoms of hypoglycemia with a concurrent blood glucose concentration of 54 mg/dL that either resolved on its own or with self‐treatment. Major hypoglycemia was defined as any episode with symptoms of hypoglycemia that resulted in loss of consciousness or seizure, which showed prompt recovery in response to administration of glucagon or glucose, or a documented blood glucose concentration of 54 mg/dL that required assistance from another person because of severe impairment in consciousness or behavior.
Results
Participant Disposition
A total of 681 patients were randomized; three patients discontinued before receiving study medication. A total of 678 (EQW = 340; EBID = 338) patients received at least one dose of exenatide (ITT population; Figure 1). On completion of treatment, 267 (78.5%) patients in the EQW group and 278 (82.2%) patients in the EBID group entered the 10‐week follow‐up period; 516 (94.7%) patients completed follow up (EQW = 258; EBID = 258).
Figure 1.
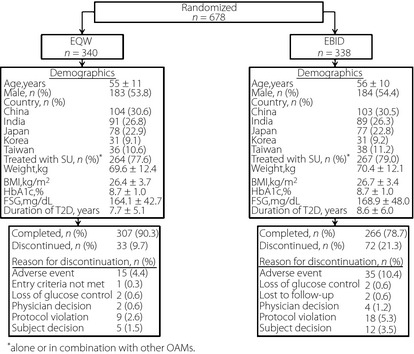
Patient disposition and baseline characteristics. Data are mean ± standard deviation, unless otherwise noted. BMI, body mass index; EBID, exenatide twice daily; EQW, exenatide once‐weekly; FSG, fasting serum glucose; HbA1c, hemoglobin A1c; MET, metformin; SU, sulfonylurea; T2D, type 2 diabetes; TZD, thiazolidinedione.
Baseline Demographics and Clinical Characteristics
On average, patients were aged 55–56 years, had a history of diabetes >7 years and HbA1c of 8.7% (Figure 1). Most patients (EQW = 77.6%; EBID = 79.0%) were taking SU alone or in combination with another OAM. Baseline weight (EQW = 69.6 kg; EBID = 70.4 kg) and BMI (EQW = 26.4 kg/m2; EBID = 26.7 kg/m2) were similar between groups.
Changes in Glycemic Control
At end‐point, EQW was superior to EBID in reducing HbA1c, with a −0.31% LSM treatment difference (95% CI −0.49%, −0.14%). HbA1c change from baseline was significantly greater with EQW vs EBID at the 26‐week end‐point (LSM ± standard error, −1.43 ± 0.07% vs −1.12 ± 0.07%, P < 0.001; Figure 2a). Improvements in HbA1c were observed with both treatments at each visit; EQW treatment resulted in significantly lower LSM HbA1c compared with EBID at week 12 (7.28 ± 0.05% vs 7.56 ± 0.05%, P < 0.001), week 20 (7.15 ± 0.06% vs 7.51 ± 0.06%, P < 0.001) and week 26 (7.26 ± 0.07% vs 7.57 ± 0.07%, P < 0.001; Figure 2b).
Figure 2.
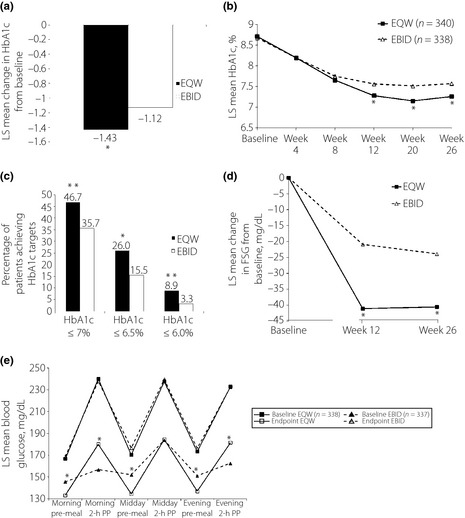
Glycemic parameters in patients treated with oral antihyperglycemic medications plus exenatide once‐weekly (EQW) or exenatide twice daily (EBID). (a) Change in hemoglobin A1c (HbA1c) from baseline at week 26. *P < 0.001, EQW vs EBID. (b) HbA1c values over the course of the study. *P < 0.001, EQW vs EBID. (c) Percentage of patients reaching target HbA1c at week 26. *P = 0.003; **P < 0.001, EQW vs EBID. (d) Change in fasting serum glucose (FSG) from baseline at week 26. (e) Changes from baseline to end‐point on 6‐point self‐monitoring blood glucose profiles. *P < 0.001, EQW vs EBID. LS, least squares; PP, postprandial.
A higher proportion of EQW patients achieved HbA1c targets of ≤7.0% (P = 0.003), ≤6.5% (P < 0.001) or ≤6.0% compared with EBID patients (P = 0.003; Figure 2c). Each analysis included only patients whose baseline HbA1c was above the specified target.
More improvement in HbA1c was observed in patients receiving EQW compared with those receiving EBID among patients with HbA1c ≥ 9% at baseline (LSM treatment difference: −0.29%; 95% CI −0.54, −0.03; P = 0.027). Similarly, more improvement in HbA1c was observed in patients receiving EQW compared with those receiving EBID among patients with HbA1c <9% at baseline (−0.31%; [95% CI −0.51, −0.11; P = 0.002).
Baseline FSG concentrations were similar between groups (Figure 1). Significant decreases from baseline were observed in both groups at week 26 (EQW = −40.57 ± 2.36 mg/dL; EBID = −23.90 ± 2.45 mg/dL, P < 0.001; Figure 2d). These reductions were significantly greater in patients treated with EQW compared with EBID at week 12 (−20.21 ± 2.85 mg/dL, P < 0.001) and week 26 (−16.67 ± 2.97 mg/dL, P < 0.001).
The 6‐point SMBG profile of both treatment groups significantly improved from baseline on all measures at each time point (P < 0.001 for all measures, both groups; Figure 2e). At the 26‐week end‐point, the EQW group had a significantly greater reduction from baseline than the EBID group at morning premeal (−36 ± 2 mg/dL vs −25 ± 2 mg/dL, P < 0.001), midday premeal (−39 ± 3 mg/dL vs −24 ± 3 mg/dL, P < 0.001) and evening premeal (−40 ± 2 mg/dL vs −28 ± 3 mg/dL, P < 0.001). Significantly greater reductions in postprandial blood glucose concentrations were observed in the EBID group compared with the EQW group, 2‐h post‐morning meal (−87 ± 3 mg/dL vs −63 ± 3 mg/dL, P < 0.001) and 2‐h post‐evening meal (−75 ± 3 mg/dL vs −55 ± 3 mg/dL, P < 0.001). Both groups had similar reductions in postprandial blood glucose concentrations at 2‐h post‐midday meal (EQW = −58 ± 3 mg/dL vs EBID = −60 ± 3 mg/dL, P = 0.548).
Bodyweight Changes and Bodyweight vs HbA1c
Significant decreases from baseline in weight were observed with both treatments at each visit (Figure 3a). At the 26‐week end‐point, the EBID group had a significantly greater LSM weight loss (−2.45 ± 0.16 kg) compared with the EQW group (−1.63 ± 0.16 kg, P < 0.001). The distribution of patients, based on changes in both HbA1c and bodyweight, is shown in Figure 3b. Significant reductions in HbA1c were observed with both treatments, independent of concomitant weight loss. Patients with baseline BMI ≥ 25 kg/m2 experienced greater mean weight decrease (EQW = −1.75 kg; EBID = −2.33 kg) than patients with BMI < 25 kg/m2 (EQW = −1.26 kg; EBID = −1.95 kg). At end‐point, weight decrease was greater with EBID compared with EQW for both BMI groups.
Figure 3.
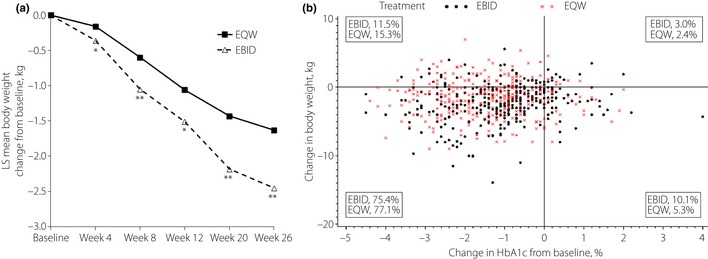
(a) Effects of exenatide once‐weekly (EQW) or exenatide twice daily (EBID) on bodyweight over the 26‐week treatment period. *P < 0.05; *P < 0.001, EQW vs EBID. (b) Scatterplot of change in hemoglobin A1c (HbA1c) vs change in bodyweight from baseline to week 26. LS, least squares.
Cardiovascular and Metabolic Measures
All fasting serum lipid values were similar between groups at end‐point (Table 1). Significant reductions from baseline were observed for total cholesterol and low‐density lipoprotein cholesterol with EQW and EBID. No notable changes from baseline were observed for high‐density lipoprotein cholesterol or triglycerides with either treatment.
Table 1. Cardiovascular and metabolic outcomes.
| EQW (n = 340) | EBID (n = 338) | P‐value for treatment comparison | |||
|---|---|---|---|---|---|
| Baseline | Change from baseline | Baseline | Change from baseline | ||
| Total cholesterol (mg/dL) | 182.08 (2.11) | −9.41 (1.96)‡ | 183.97 (2.12) | −8.10 (2.04)‡ | 0.609 |
| HDL (mg/dL) | 48.83 (0.68) | −0.11 (0.41) | 48.69 (0.69) | −0.48 (0.43) | 0.476 |
| LDL (mg/dL) | 102.65 (1.84) | −7.30 (1.48)‡ | 104.67 (1.83) | −8.13 (1.53)‡ | 0.653 |
| Triglycerides (mg/dL)† | 136.95 (4.00) | 0.97 (0.02) | 136.57 (3.77) | 0.97 (0.03) | 0.807 |
| Heart rate (b.p.m.) | 76.48 (0.52) | 3.03 (0.53)‡ | 76.86 (0.52) | 0.77 (0.56) | 0.001 |
| Systolic blood pressure (mmHg) | 131.09 (0.84) | −5.41 (0.82)‡ | 131.59 (0.84) | −5.38 (0.86)‡ | 0.974 |
| Diastolic blood pressure (mmHg) | 78.80 (0.51) | −1.62 (0.52)§ | 79.51 (0.51) | −2.26 (0.55)‡ | 0.349 |
| hsCRP (mg/dL)† | 0.13 (0.01) | 0.85 (0.06) | 0.13 (0.01) | 0.78 (0.05) | 0.368 |
| Urinary albumin‐to‐creatinine ratio† | 0.02 (0.00) | 0.78 (0.05) | 0.02 (0.00) | 0.72 (0.05) | 0.370 |
| Waist‐to‐hip ratio | 0.93 (0.00) | 0.00 (0.00) | 0.94 (0.00) | 0.00 (0.00) | 0.364 |
Data are presented as least‐squares (LS) mean (standard error) unless otherwise noted. †Geometric mean is presented at baseline and the geometric LS mean (standard error) ratio of week 26 to baseline is presented as change from baseline. ‡P < 0.001, difference from baseline; §P = 0.002, difference from baseline. b.p.m., Beats per minute; HDL, high density lipoprotein; hsCRP, high‐sensitivity C‐reactive protein; LDL, low density lipoprotein.
Changes from baseline to end‐point for high‐sensitivity C‐reactive protein (hsCRP), waist‐to‐hip ratio, urinary albumin‐to‐creatinine ratio and blood pressure were similar between groups, with both treatment groups showing decreases in systolic and diastolic blood pressure. Mean heart rate increased in the EQW group compared with the EBID group at end‐point; no other cardiovascular measures differed between the two groups.
Pancreatic β‐Cell Function and Insulin Sensitivity
At end‐point, the EQW group had significantly increased β‐cell function, as measured by the ratio of end‐point to baseline HOMA‐B (1.59 ± 0.06), compared with EBID (1.21 ± 0.05, P < 0.001). The EBID group had a significant increase in insulin sensitivity, as measured by HOMA‐S (1.18 ± 0.04), compared with the EQW group (1.08 ± 0.03, P = 0.026).
Safety and Tolerability
Gastrointestinal events were the most frequently reported TEAEs, and included nausea, vomiting and diarrhea (Table 2). Nausea and vomiting were highest from week 4 to week 8 for both treatment groups, and decreased in frequency as the study progressed. Most events were mild or moderate in intensity; however, one EQW‐treated patient had a SAE of acute gastritis, which resolved when treated with injectable anti‐emetics. The EQW group reported higher incidences of injection‐site reactions, including injection‐site induration, injection‐site pruritus and injection‐site nodule (n = 74; 21.8%) compared with the EBID group (n = 11; 3.3%). At end‐point, 112 of 266 patients (42.1%) in the EQW group and 121 of 276 patients (43.8%) in the EBID group had TEAEs that continued into the 10‐week follow‐up period. The TEAEs that were still ongoing in ≥2% of patients in either treatment group by the end of the 10‐week follow‐up period were dyslipidemia, microalbuminuria, diabetic nephropathy, hyperchlorhydria, injection‐site nodule, hyperlipidemia, hyperlipasemia and hypertension. The most frequent SAE overall by system organ class was for infections and infestations (EBID: 2 [0.6%], EQW: 3 [0.9%]). There was not a predominant (>1.0%) SAE by preferred term in either group. The following SAEs were reported: EBID (acute myocardial infarction, aortic aneurysm, tendon rupture, ankle fracture, acute pyelonephritis, vitreous hemorrhage, transient global amnesia, ileus, rotator cuff syndrome, pneumonia) and EQW (cerebral infarction, fall, lower limb fracture, vaginal hemorrhage, acute pancreatitis, increased blood calcitonin, bronchopneumonia, diabetic ketoacidosis, gastritis, cerebral artery occlusion, chronic sinusitis, coronary artery disease, pneumonia haemophilus, small intestine hemorrhage, atrial tachycardia, diplegia). No deaths were reported.
Table 2. Overview of treatment‐emergent adverse events.
| 26‐Week treatment period | ||
|---|---|---|
| EQW (n = 340) | EBID (n = 338) | |
| ≥1 SAE, n (%) | 13 (3.8) | 9 (2.7) |
| TEAEs, n (%) [in ≥5% patients] | 229 (67.4) | 250 (74.0) |
| Injection site reactions* | 74 (21.8) | 11 (3.3) |
| Nausea | 37 (10.9) | 89 (26.3) |
| Dyslipidemia | 34 (10.0) | 33 (9.8) |
| Diarrhea | 33 (9.7) | 28 (8.3) |
| Vomiting | 28 (8.2) | 41 (12.1) |
| Constipation | 20 (5.9) | 24 (7.1) |
| Microalbuminuria | 15 (4.4) | 18 (5.3) |
| Decreased appetite | 16 (4.7) | 32 (9.5) |
Injection‐site reactions include induration, pruritus and nodule. EBID, exenatide twice daily; EQW, exenatide once weekly; SAE, serious adverse event; TEAEs, treatment‐emergent adverse events.
More EBID‐treated patients (10.4%) discontinued as a result of TEAEs than in the EQW group (4.4%). In EBID‐treated patients, 12 (3.6%) and 6 (1.8%) discontinued because of nausea and vomiting, respectively, whereas no patients discontinued EQW because of nausea and 1 (0.3%) discontinued because of vomiting. The TEAEs most often cited as reasons for discontinuation with EQW were rash and injection‐site nodule. For each of these events, two patients (0.6%) discontinued.
In each group, similar proportions of both antibody‐positive and antibody‐negative patients reported one or more TEAE in each group, and both antibody‐positive and antibody‐negative patients showed a significant decrease in HbA1c from baseline to end‐point (Table 3). The majority of patients in both groups were taking a concomitant SU (Figure 1). Among patients taking a SU, fewer in the EQW group experienced minor hypoglycemia relative to the EBID group (6.8% vs 12.0%, P = 0.053). The incidence of minor hypoglycemia was similar in EQW‐ vs EBID‐treated patients who were not taking a SU (1.3% vs 1.4%). Symptoms of hypoglycemia were reported by fewer patients who were taking a SU in the EQW group, compared with the EBID group (19.7% vs 26.2%, P = 0.080). Of patients not taking a SU, 5.3% in the EQW group and 11.3% in the EBID group reported symptoms of hypoglycemia (P = 0.234). One EBID‐treated patient taking a concomitant SU experienced an event of major hypoglycemia, which resolved when treated with i.v. glucose. The patient recovered promptly and completed the study without discontinuing the study drug.
Table 3. Change in hemoglobin A1c and adverse event reporting by anti‐exenatide antibody status.
| Anti‐exenatide antibody status | ||
|---|---|---|
| Negative | Positive | |
| EQW | ||
| n | 130 | 206 |
| ≥1 TEAE, n (%) | 86 (66.2) | 142 (68.9) |
| Change in HbA1c | −1.67 ± 0.10* | −1.28 ± 0.09* |
| EBID | ||
| n | 226 | 107 |
| ≥1 TEAE, n (%) | 170 (75.2) | 77 (72.0) |
| Change in HbA1c | −1.15 ± 0.09* | −1.15 ± 0.11* |
Data are presented as least‐squares mean (SE) unless otherwise noted. *P < 0.001, difference from baseline. EBID, exenatide twice daily; EQW, exenatide once weekly; HbA1c, hemoglobin A1c; TEAE, treatment‐emergent adverse event.
Mean total amylase and lipase concentrations increased slightly, but remained within normal limits for both treatment groups. One patient who entered the study with elevated pancreatic enzyme concentrations and who was randomized to EQW treatment had further persistent increases in enzyme concentrations. A computed tomography scan was carried out, which showed the pancreas to be diffuse and mildly enlarged; acute pancreatitis was diagnosed based on this finding. The patient remained asymptomatic, except for increased enzyme concentrations, and was discontinued from the study. The patient was not hospitalized, and the event resolved without treatment.
Mean calcitonin concentrations remained within the normal range for both study arms. One EQW‐treated patient had increased calcitonin (18.3–26.1 pg/mL, normal range 0–18.2 pg/mL). A high‐resolution ultrasound scan of the thyroid was carried out and a small (<2 mm) clinically non‐significant thyroid nodule was identified, for which no treatment was required.
Discussion
The present study supports the general conclusions from previous studies that compared EQW and EBID, and in which continuous GLP‐1 receptor stimulation achieved with EQW therapy showed superiority to EBID in reducing HbA1c and other measures of metabolic control29. Over 26 weeks of treatment, EQW improved HbA1c to a greater degree than EBID, and a higher proportion of patients achieved target HbA1c ≤7 and ≤6.5%, and reduced FSG. Morning, midday and evening premeal glucose levels were reduced during treatment with EQW compared with EBID, whereas morning and evening 2‐h PPG levels were reduced with EBID compared with EQW treatment. Greater reductions in glucose in EQW‐treated vs EBID‐treated patients might be partly due to continuous exposure to exenatide with EQW, resulting in a greater reduction in FSG. The greater postprandial effects observed with EBID are also consistent with the observations of Drucker et al.29 and might be due to different effects of EQW and EBID on gastric emptying30. Previous studies of EQW therapy in Japanese28 and non‐Asian patients26, and EBID therapy in Asian19 and non‐Asian22 patients have shown analogous improvements on similar glycemia measures. Insulin sensitivity, as measured by HOMA‐S, was also improved with EBID relative to EQW. Conversely, the long‐acting EQW formulation was associated with improved β‐cell function, based on HOMA‐B.
In the present study, both the EQW and EBID formulations resulted in consistent gradual weight loss, which was notable, as various OAMs used concomitantly in the study (e.g. SUs and TZDs) have been shown to cause weight gain33. In non‐Asian populations, weight loss observed with exenatide has been similar with EQW and EBID formulations29. Among Japanese adults, bodyweight reduction with EQW28 (−0.8 kg) and EBID20 (−1.3 to −1.5 kg) have not been as great. This result might be partly attributed to the comparative leanness of Asian patients with type 2 diabetes. However, it should be noted that SU use in the present study and the aforementioned Japanese study (approximately 70%) was much higher than in previous studies of non‐Asian patients (approximately 30%) – this difference in SU use might also partly explain why bodyweight changes are less remarkable in the present study than previously reported. A small percentage of patients in each group gained weight and/or experienced increased HbA1c during the present study. Because of biological variation, not all patients will respond to every diabetes treatment. Additionally, factors such as patient compliance with therapy, diet, exercise, illness due to other conditions and other factors might influence individual patient responses.
Minor hypoglycemia occurred primarily in patients using a concomitant SU, and the incidence was higher among EBID‐treated than EQW‐treated patients. Overall, these data were consistent with clinical trials comparing EQW and EBID in non‐Asian patients29. Previous studies of EBID in predominantly non‐Asian patients have shown an increased incidence of hypoglycemia when SUs are used concomitantly, which might be a product of increased susceptibility to hypoglycemia in SU‐treated patients coupled with lower ambient glycemia.22
Both treatments were generally well‐tolerated; 90% of patients who took EQW and 79% of patients who took EBID completed the 26‐week study. The incidences of nausea and vomiting, the most common TEAEs in EBID‐treated patients, were considerably lower with EQW treatment. These results are consistent with earlier comparative studies of EQW and EBID29. It has been suggested that gradual increases in plasma exenatide concentrations decrease the occurrence of gastrointestinal TEAEs35. The pharmacokinetic profile of EQW, characterized by a gradual rise in plasma exenatide concentrations reaching steady state at approximately 6–10 weeks29 is consistent with the lower incidence of nausea and vomiting for EQW compared with EBID. A higher incidence of injection‐site reactions was observed with EQW treatment. It is likely that some injection‐site reactions are a result of the poly (D,L‐lactide‐co‐glycolide) technology used in the EQW formulation and not as a result of the drug itself36. Although exenatide has been reported to positively influence blood lipids21, several cases of dyslipidemia were reported in the present study. These cases were most likely pre‐existing conditions that were undiagnosed before study entry and the condition was subsequently detected during the study.
As previously reported in patients taking exenatide19, a subset of patients in both groups developed antibodies to exenatide, but both antibody‐positive and antibody‐negative patients showed a significant decrease in HbA1c from baseline to end‐point. A 10‐week follow‐up visit was included in the study design and was based on the detectable levels of exenatide that exist for approximately 8 weeks after the last 2‐mg dose of EQW. No safety concerns emerged during the follow‐up period, and the majority of TEAEs that continued at the end of the treatment period resolved by the end of the follow‐up period.
One limitation of the present study was the open‐label design. Because patients were not blinded to the treatment they were receiving, patient expectations and adherence to therapy might have biased the results. Another limitation was the relatively short study duration. Finally, the present study focused only on five Asian subgroups – there is some indication in the literature that there might be racial/ethnic differences in the treatment of type 2 diabetes; thus, there is a need for more studies to evaluate the impact of treatments by racial/ethnic groups to clarify these differences.
The present randomized comparator‐controlled study, carried out among Asian patients with type 2 diabetes, found that EQW was superior to EBID with regard to overall glycemic control. Both formulations resulted in weight loss, with EBID showing greater improvement than EQW. The long‐acting EQW formulation was associated with a lower incidence of hypoglycemia, nausea and vomiting, but higher incidence of injection‐site reactions compared with EBID. These findings might aid clinicians as they seek treatment options when OAM therapy fails to maintain adequate glycemic control in Asian patients with type 2 diabetes.
Acknowledgments
We thank all investigators and trial participants. We thank Gabriella Beck for study oversight and Michelle Carey (PharmaNet/i3) for writing contribution. Linong Ji has accepted lecturing and consulting fees from Eli Lilly and Company. Pankaj Agarwal has participated in and has been paid investigator's fees for clinical studies for Eli Lilly and Company, and has also participated in speaker panels for Eli Lilly and Company without payment. Marilyn Boardman is a full‐time employee and shareholder of Eli Lilly and Company. No other authors have competing interests to declare.
(J Diabetes Invest, doi: 10.1111/j.2040-1124.2012.00238.x, 2013)
References
- 1.Wild S, Roglic G, Green A, et al Global prevalence of diabetes: estimates for the year 2000 and projections for 2030. Diabetes Care 2004; 27: 1047–1053 [DOI] [PubMed] [Google Scholar]
- 2.Hu FB. Globalization of Diabetes: the role of diet, lifestyle, and genes. Diabetes Care 2011; 34: 1249–1257 [DOI] [PMC free article] [PubMed] [Google Scholar]
- 3.Chan JC, Malik V, Jia W, et al Diabetes in Asia: epidemiology, risk factors, and pathophysiology. JAMA 2009; 301: 2129–2140 [DOI] [PubMed] [Google Scholar]
- 4.Deurenberg P, Deurenberg‐Yap M, Guricci S. Asians are different from Caucasians and from each other in their body mass index/body fat per cent relationship. Obes Rev 2002; 3: 141–146 [DOI] [PubMed] [Google Scholar]
- 5.Nakagami T, Qiao Q, Carstensen B, et al Age, body mass index and Type 2 diabetes‐associations modified by ethnicity. Diabetologia 2003; 46: 1063–1070 [DOI] [PubMed] [Google Scholar]
- 6.Chan WB, Tong PC, Chow CC, et al The associations of body mass index, C‐peptide and metabolic status in Chinese Type 2 diabetic patients. Diabet Med 2004; 21: 349–353 [DOI] [PubMed] [Google Scholar]
- 7.Fukushima M, Usami M, Ikeda M, et al Insulin secretion and insulin sensitivity at different stages of glucose tolerance: a cross‐sectional study of Japanese type 2 diabetes. Metabolism 2004; 53: 831–835 [DOI] [PubMed] [Google Scholar]
- 8.Kuroe A, Fukushima M, Usami M, et al Impaired beta‐cell function and insulin sensitivity in Japanese subjects with normal glucose tolerance. Diabetes Res Clin Pract 2003; 59: 71–77 [DOI] [PubMed] [Google Scholar]
- 9.Nathan DM, Buse JB, Davidson MB, et al Medical management of hyperglycaemia in type 2 diabetes mellitus: a consensus algorithm for the initiation and adjustment of therapy: a consensus statement from the American Diabetes Association and the European Association for the Study of Diabetes. Diabetologia 2009; 52: 17–30 [DOI] [PubMed] [Google Scholar]
- 10.International Diabetes Federation . Global Guideline for Type 2 Diabetes. International Diabetes Federation, 2005. Available at http://www.idf.org/webdata/docs/IDF%20GGT2D.pdf (accessed 6 July 2011). [Google Scholar]
- 11.Kobayashi M, Yamazaki K, Hirao K, et al The status of diabetes control and antidiabetic drug therapy in Japan–a cross‐sectional survey of 17,000 patients with diabetes mellitus (JDDM 1). Diabetes Res Clin Pract 2006; 73: 198–204 [DOI] [PubMed] [Google Scholar]
- 12.Arai K, Matoba K, Hirao K, et al Present status of sulfonylurea treatment for type 2 diabetes in Japan: second report of a cross‐sectional survey of 15,652 patients. Endocr J 2010; 57: 499–507 [DOI] [PubMed] [Google Scholar]
- 13.UK Prospective Diabetes Study (UKPDS) Group . Effect of intensive blood‐glucose control with metformin on complications in overweight patients with type 2 diabetes (UKPDS 34). Lancet 1998; 352: 854–865 [PubMed] [Google Scholar]
- 14.UK Prospective Diabetes Study (UKPDS) Group. Intensive blood‐glucose control with sulphonylureas or insulin compared with conventional treatment and risk of complications in patients with type 2 diabetes (UKPDS 33). Lancet 1998; 352: 837–853 [PubMed] [Google Scholar]
- 15.UK Prospective Diabetes Study Group . UKPDS 28: a randomized trial of efficacy of early addition of metformin in sulfonylurea‐treated type 2 diabetes. Diabetes Care 1998; 21: 87–92 [DOI] [PubMed] [Google Scholar]
- 16.Bydureon (exenatide) [abbreviated prescribing information]. Eli Lilly and Company Limited, Basingstoke, 2011. Available at http://www.bydureonlaunch.co.uk/templates/lilly/bydureon/ downloads/prescribing-information.pdf (accessed 3 August 2011). [Google Scholar]
- 17.Kolterman OG, Kim DD, Shen L, et al Pharmacokinetics, pharmacodynamics, and safety of exenatide in patients with type 2 diabetes mellitus. Am J Health Syst Pharm 2005; 62: 173–181 [DOI] [PubMed] [Google Scholar]
- 18.Nielsen LL, Young AA, Parkes DG. Pharmacology of exenatide (synthetic exendin‐4): a potential therapeutic for improved glycemic control of type 2 diabetes. Regul Pept 2004; 117: 77–88 [DOI] [PubMed] [Google Scholar]
- 19.Gao Y, Yoon KH, Chuang LM, et al Efficacy and safety of exenatide in patients of Asian descent with type 2 diabetes inadequately controlled with metformin or metformin and a sulphonylurea. Diabetes Res Clin Pract 2009; 83: 69–76 [DOI] [PubMed] [Google Scholar]
- 20.Kadowaki T, Namba M, Imaoka T, et al Improved glycemic control and reduced bodyweight with exenatide: a double‐blind, randomized, phase 3 study in Japanese patients with suboptimally controlled type 2 diabetes over 24 weeks. J Diabetes Invest 2011; 2: 210–217 [DOI] [PMC free article] [PubMed] [Google Scholar]
- 21.Kadowaki T, Namba M, Yamamura A, et al Exenatide exhibits dose‐dependent effects on glycemic control over 12 weeks in Japanese patients with suboptimally controlled type 2 diabetes. Endocr J 2009; 56: 415–424 [DOI] [PubMed] [Google Scholar]
- 22.Kendall DM, Riddle MC, Rosenstock J, et al Effects of exenatide (exendin‐4) on glycemic control over 30 weeks in patients with type 2 diabetes treated with metformin and a sulfonylurea. Diabetes Care 2005; 28: 1083–1091 [DOI] [PubMed] [Google Scholar]
- 23.Zander M, Madsbad S, Madsen JL, et al Effect of 6‐week course of glucagon‐like peptide 1 on glycaemic control, insulin sensitivity, and beta‐cell function in type 2 diabetes: a parallel‐group study. Lancet 2002; 359: 824–830 [DOI] [PubMed] [Google Scholar]
- 24.Zinman B, Hoogwerf BJ, Duran GarciaS, et al The effect of adding exenatide to a thiazolidinedione in suboptimally controlled type 2 diabetes: a randomized trial. Ann Intern Med 2007; 146: 477–485 [DOI] [PubMed] [Google Scholar]
- 25.DeFronzo RA, Ratner RE, Han J, et al Effects of exenatide (exendin‐4) on glycemic control and weight over 30 weeks in metformin‐treated patients with type 2 diabetes. Diabetes Care 2005; 28: 1092–1100 [DOI] [PubMed] [Google Scholar]
- 26.Kim D, MacConell L, Zhuang D, et al Effects of once‐weekly dosing of a long‐acting release formulation of exenatide on glucose control and body weight in subjects with type 2 diabetes. Diabetes Care 2007; 30: 1487–1493 [DOI] [PubMed] [Google Scholar]
- 27.Wysham C, Bergenstal R, Malloy J, et al DURATION‐2: efficacy and safety of switching from maximum daily sitagliptin or pioglitazone to once‐weekly exenatide. Diabet Med 2011; 28: 705–714 [DOI] [PMC free article] [PubMed] [Google Scholar]
- 28.Iwamoto K, Nasu R, Yamamura A, et al Safety, tolerability, pharmacokinetics, and pharmacodynamics of exenatide once weekly in Japanese patients with type 2 diabetes. Endocr J 2009; 56: 951–962 [DOI] [PubMed] [Google Scholar]
- 29.Drucker DJ, Buse JB, Taylor K, et al Exenatide once weekly versus twice daily for the treatment of type 2 diabetes: a randomised, open‐label, non‐inferiority study. Lancet 2008; 372: 1240–1250 [DOI] [PubMed] [Google Scholar]
- 30.Linnebjerg H, Park S, Kothare PA, et al Effect of exenatide on gastric emptying and relationship to postprandial glycemia in type 2 diabetes. Regul Pept 2008; 151: 123–129 [DOI] [PubMed] [Google Scholar]
- 31.Blevins T, Pullman J, Malloy J, et al DURATION‐5: exenatide once weekly resulted in greater improvements in glycemic control compared with exenatide twice daily in patients with type 2 diabetes. J Clin Endocrinol Metab 2011; 96: 1301–1310 [DOI] [PubMed] [Google Scholar]
- 32.Diamant M, Van GaalL, Stranks S, et al Once weekly exenatide compared with insulin glargine titrated to target in patients with type 2 diabetes (DURATION‐3): an open‐label randomised trial. Lancet 2010; 375: 2234–2243 [DOI] [PubMed] [Google Scholar]
- 33.Riddle MC. Glycemic management of type 2 diabetes: an emerging strategy with oral agents, insulins, and combinations. Endocrinol Metab Clin North Am 2005; 34: 77–98 [DOI] [PubMed] [Google Scholar]
- 34.Buse JB, Henry RR, Han J, et al Effects of exenatide (exendin‐4) on glycemic control over 30 weeks in sulfonylurea‐treated patients with type 2 diabetes. Diabetes Care 2004; 27: 2628–2635 [DOI] [PubMed] [Google Scholar]
- 35.Fineman MS, Shen LZ, Taylor K, et al Effectiveness of progressive dose‐escalation of exenatide (exendin‐4) in reducing dose‐limiting side effects in subjects with type 2 diabetes. Diabetes Metab Res Rev 2004; 20: 411–417 [DOI] [PubMed] [Google Scholar]
- 36.Anderson J, Shive M. Biodegradation and biocompatibility of PLA and PLGA microspheres. Adv Drug Deliv Rev 1997; 28: 5–24 [DOI] [PubMed] [Google Scholar]
- 37.Fineman MS, Mace MF, Diamant M, et al Clinical relevance of anti‐exenatide antibodies: safety, efficacy and cross‐reactivity with long‐term treatment. Diabetes Obes Metab 2012; 14: 546–554 [DOI] [PubMed] [Google Scholar]