

Abstract
The aim of the present study was to establish a reference interval for homeostasis model assessment of insulin resistance (HOMA‐IR) in a Japanese population based on the C28‐A3 document from the Clinical and Laboratory Standards Institute (CLSI). We selected healthy subjects aged 20–79 years, with fasting plasma glucose < 100 mg/dL, body mass index < 25 kg/m2 and alanine aminotransferase < 31 U/L. HOMA‐IR values were log transformed, values beyond mean ± 3 standard deviations (SD) were truncated, and the mean ± 2 SD of log HOMA‐IR values were taken as the upper and lower reference limits of HOMA‐IR. We selected 2173 subjects as reference individuals, and 2153 subjects were used for analysis. The reference interval for HOMA‐IR was established as between 0.4 and 2.4. This represents the first reference interval study for HOMA‐IR that applies the stringent CLSI C28‐A3 document. HOMA‐IR ≥ 2.5 should be considered a reasonable indicator of insulin resistance in Japanese. (J Diabetes Invest, doi: 10.1111/j.2040‐1124.2011.00113.x, 2011)
Keywords: Homeostasis model assessment of insulin resistance, Reference interval, C28‐A3
Introduction
Insulin resistance (IR) is an important factor in the pathophysiology of type 2 diabetes and metabolic syndrome, and the homeostasis model assessment of IR (HOMA‐IR) has been widely used in numerous epidemiological studies. Although reference intervals are the most commonly used means for assessing and interpreting clinical laboratory results, reference intervals for HOMA‐IR have not been clearly established.
As diagnostic specificity and sensitivity are affected by the validity of the reference interval, the C28‐A3 document has been recommended by the Clinical and Laboratory Standards Institute (CLSI; formerly the National Committee for Clinical Laboratory Standards) for appropriate statistical determination of reference intervals1. Based on this document, reference intervals are to be determined by: (i) selection of a minimum of 120 healthy reference individuals using appropriately defined criteria; (ii) normalization of the data for parametric analysis; (iii) truncation of data for outlier rejection; and (iv) establishment of the reference interval between the 2.5th and 97.5th percentiles of the reference distribution.
The aim of the present study was to determine an optimal reference interval for HOMA‐IR in a Japanese population based on the CLSI C28‐A3 document.
Materials and Methods
Among 5297 health‐check examinees who first visited the Health Evaluation and Promotion Center at Tokai University Hachioji Hospital between April 2007 and March 2010, we excluded 962 subjects receiving medication for hypertension, dyslipidemia or diabetes and those with a history of coronary artery disease, cerebrovascular disease or chronic renal failure. Among the remaining 4335 subjects, 2173 subjects aged 20–79 years with fasting plasma glucose (FPG) < 100 mg/dL, body mass index (BMI) < 25 kg/m2 and alanine aminotransferase (ALT) < 31 U/L were selected as reference individuals. All measurements were included in the routine health‐check examinations and anonymized health records were used for analysis. The present study was designed in compliance with the ethics regulations outlined in the Helsinki Declaration, and the privacy of participants was protected by unlinkable anonymization.
Anthropometric measurements and blood sampling were carried out after overnight fasting. Blood pressure was measured at the right upper arm in a sitting position. Serum lipid levels were measured enzymatically. Liver enzymes were measured following the standardized procedure by the Japan Society of Clinical Chemistry. Fasting serum immunoreactive insulin (IRI) was measured by fluorescence‐enzyme immunoassay (ST AIA‐PACK IRI; Toso, Tokyo, Japan). The intra‐ and interassay coefficients of variation were 1.4–2.3 and 2.6–4.6%, respectively, and cross‐reactivity with proinsulin molecules was 2.0%. HOMA‐IR was calculated as: FPG (in mg/dL) × IRI (in mU/mL)/4052. Normality was examined using the Shapiro–Wilk test. Because the data for HOMA‐IR did not adhere to a Gaussian distribution, log‐transformed values (log HOMA‐IR) were used. Log HOMA‐IR values outside of mean ± 3 standard deviations (SD) were truncated as outliers. We then calculated mean ± 2 SD of log HOMA‐IR values, which covers the central 95% of the population. These values were inversely transformed and determined as the upper and lower reference limits. Data are given as mean ± SD. SPSS Statistics version 18.0 software (SPSS, Chicago, IL, USA) was used for all statistical analyses.
Results
Background characteristics of the subjects are shown in Table 1. The prevalence of hypertriglyceridemia (triglyceride ≥ 150 mg/dL) and hypertension (systolic blood pressure ≥ 140 mmHg or diastolic blood pressure ≥ 90 mmHg) was 6.1 and 6.2%, respectively (Table 1). HOMA‐IR showed a clear right‐skewed shift from the Gaussian distribution (Figure 1a). Log HOMA‐IR appeared more normally distributed, although the normality was not statistically significant (Figure 1b). After outlier rejection, we calculated mean ± 2 SD of log HOMA‐IR values (Figure 1c). Inverse transformation of log HOMA‐IR values corresponding to mean ± 2 SD yielded the reference limits for HOMA‐IR of 0.4 and 2.4. There was little difference in HOMA‐IR among different age groups (0.4–2.4 for those aged 20–29, 30–39, 40–49 and 50–59 years; 0.4–2.3 for those aged 60–69 years; and 0.3–2.2 for those aged 70–79 years). As a result, HOMA‐IR ≥ 2.5 was considered to represent IR.
Table 1. Background characteristics of study subjects.
| All | Men | Women | |
|---|---|---|---|
| n | 2153 | 817 | 1336 |
| Age (years) | 46.0 ± 11.0 | 46.3 ± 11.8 | 45.7 ± 10.5 |
| BMI (kg/m2) | 21.0 ± 2.0 | 21.8 ± 1.7 | 20.6 ± 2.0 |
| Waist circumference (cm) | 77.0 ± 6.9 | 79.4 ± 5.9 | 75.5 ± 7.1 |
| FPG (mg/dL) | 91.7 ± 4.9 | 93.2 ± 4.1 | 90.8 ± 5.1 |
| FIRI (mU/mL) | 4.55 ± 2.12 | 4.40 ± 2.06 | 4.68 ± 2.09 |
| HOMA‐IR | 1.0 ± 0.5 | 1.0 ± 0.5 | 1.1 ± 0.5 |
| LDL‐C (mg/dL) | 114.4 ± 30.5 | 117.7 ± 29.4 | 112.4 ± 31.0 |
| HDL‐C (mg/dL) | 69.7 ± 16.5 | 61.4 ± 14.4 | 74.8 ± 15.6 |
| TG (mg/dL) | 78.8 ± 42.7 | 93.8 ± 52.2 | 69.7 ± 32.4 |
| Systolic BP (mmHg) | 110.0 ± 14.5 | 112.3 ± 13.8 | 108.6 ± 14.7 |
| Diastolic BP (mmHg) | 69.1 ± 11.0 | 71.7 ± 11.0 | 67.6 ± 10.6 |
| AST (U/L) | 18.8 ± 4.5 | 19.3 ± 4.5 | 18.6 ± 4.4 |
| ALT (U/L) | 16.0 ± 5.3 | 18.2 ± 5.4 | 14.6 ± 4.8 |
| γ‐GT (U/L) | 22.6 ± 15.8 | 30.0 ± 19.7 | 18.1 ± 10.7 |
| TG ≥ 150 mg/dL | 6.1% | 11.0% | 3.2% |
| BP ≥ 140/90 mmHg | 6.2% | 7.8% | 5.1% |
Data are mean ± SD. ALT, alanine aminotransferase; AST, aspartate aminotransferase; BMI, body mass index; BP, blood pressure; FIRI, fasting immunoreactive insulin; FPG, fasting plasma glucose; γ‐GT, γ‐glutamyl transpeptidase; HDL‐C cholesterol, high‐density lipoprotein cholesterol; HOMA‐IR, homeostasis model assessment of insulin resistance; LDL‐C, low‐density lipoprotein cholesterol; TG, triglyceride.
Figure 1.
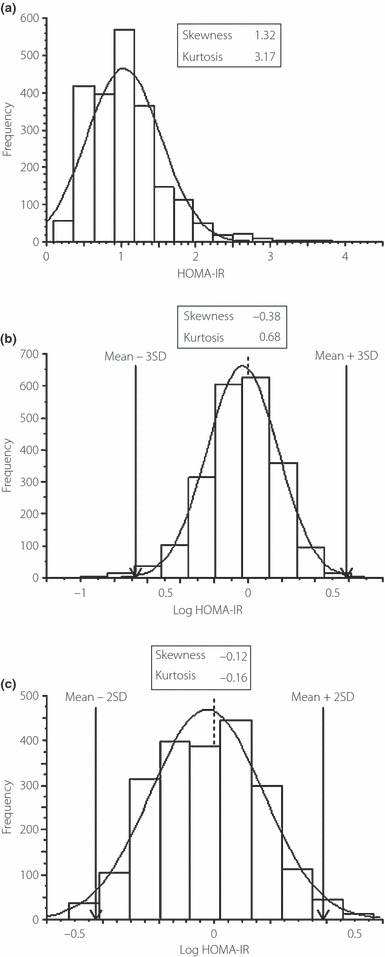
(a) Homeostasis model assessment of insulin resistance (HOMA‐IR) in reference individuals (n = 2173). (b) Log‐transformed HOMA‐IR (Log HOMA‐IR). (c) After truncation of log HOMA‐IR values outside of the mean ± 3 SD, mean ± 2 SD of log HOMA‐IR was calculated for 2153 subjects.
Discussion
To the best of our knowledge, this represents the first reference interval study of HOMA‐IR following the stringent CLSI C28‐A3 document. Reference intervals are of two types. The most common type has been termed ‘health‐associated’, derived from a reference sample of individuals who are in good health. The other type has been termed ‘decision‐based’, defining specific medical decision limits for use by clinicians to diagnose or manage patients. The present study attempted to establish a health‐associated interval for HOMA‐IR, and selected reference individuals based on criteria of freedom from chronic disorders requiring regular medication, aged 20–79 years, FPG < 100 mg/dL, BMI < 25 kg/m2 and ALT < 31 U/L. Although elderly subjects are known to be insulin resistant, there was little difference in HOMA‐IR among different age groups. We excluded subjects with FPG ≥ 100 mg/dL based on the latest global definition of metabolic syndrome3,4. Subjects with BMI ≥ 25 kg/m2 were excluded5,6, because IR is strongly associated with obesity. Furthermore, subjects with ALT ≥ 31 U/L were excluded because ALT is often used as a surrogate marker for fatty liver, which is associated with increased fasting insulin secondary to hepatic IR or decreased hepatic insulin clearance7. Although we excluded subjects receiving medication, bias from the inclusion of undiagnosed hypertriglyceridemia and hypertension might be a concern.
The Japan Diabetes Society has recommended HOMA‐IR ≤ 1.6 as indicating non‐IR and HOMA‐IR ≥ 2.5 as identifying IR in their ‘Treatment Guide for Diabetes 2010’8. However, HOMA‐IR ≤ 1.6 as non‐IR was described by only one Japanese report, which used the 90th percentile of absolute HOMA‐IR. There have been no studies showing the validity of HOMA‐IR ≥ 2.5 as IR, even though HOMA‐IR ≥ 2.5 has often been used in Asian studies9–12. The present study showed an upper reference limit for HOMA‐IR of 2.4, so defining HOMA‐IR ≥ 2.5 as indicating IR appears reasonable. Several reports have determined upper limits for HOMA‐IR of 1.713, 1.7314, 1.9715 and 2.016 in Japanese populations. Average BMI ranged from 21.2–21.6 kg/m2 across these reports, similar to that in the present study. Ohnishi et al.14 and Shimomura et al.16 used mean + 1 SD of absolute HOMA‐IR values, whereas Nakai et al.13 and Matsumoto et al.15 used the 90th percentile to define the upper limits. However, none of the studies stringently complied with the guideline in terms of selecting reference individuals, normalization and truncation of data, or interval settings. If we define IR using the upper 90 percentile, the threshold value can be calculated as 1.7 in our reference individuals. Again, there is no rationale for using the 90th percentile for appropriate statistical determination.
Few studies have examined HOMA‐IR reference limits in non‐Asian populations. In an Italian study, 2.77 was determined based on the lower limit of the top quintile of HOMA‐IR distribution in subjects with no apparent metabolic disorders (n = 888, aged 40–79 years, and mean BMI < 25 kg/m2)17. A small Spanish study of subjects without diabetes (n = 97, average BMI 22.2 kg/m2) proposed HOMA‐IR = 3.8 as the diagnostic criterion for IR using the upper 90 percentile18. A population‐based study in the USA using an appropriate reference population and interval setting showed an upper reference limit for HOMA‐IR of 4.39 among American adolescents (average BMI 24 kg/m2)19. The extent of IR might differ between Japanese and Caucasians, and heterogeneity in ethnicity might contribute to discrepancies in the degree of IR among different ethnic groups. One of the reasons might be the difference in BMI among the study groups. However, it is unreasonable to directly compare those studies unless HOMA‐IR reference limits are determined by a standardized procedure.
In conclusion, the present study is the first to establish a reference interval for HOMA‐IR by applying the stringent CLSI C28‐A3 document. We have established the reference interval for HOMA‐IR as between 0.4 and 2.4, and HOMA‐IR ≥ 2.5 can be considered a reasonable indicator of IR in Japanese subjects.
Acknowledgement
This study was supported in part by Grants‐in‐Aid for Young Scientists (B) to CY (22790493) from the Ministry of Education, Culture, Sports, Science and Technology, Japan. The authors declare no conflicts of interest.
References
- 1.Clinical and Laboratory Standards Institute (CLSI) . Defining, Establishing, and Verifying Reference Intervals in the Clinical laboratory; Approved Guideline – Third Edition CLSI document C28‐A3 (ISBN 1‐56238‐682‐4), 2008.
- 2.Matthews DR, Hosker JP, Rudenski AS, et al. Homeostasis model assessment: insulin resistance and beta‐cell function from fasting plasma glucose and insulin concentrations in man. Diabetologia 1985; 28: 412–419 [DOI] [PubMed] [Google Scholar]
- 3.Alberti KG, Eckel RH, Grundy SM, et al. ; International Diabetes Federation Task Force on Epidemiology and Prevention; National Heart, Lung, and Blood Institute; American Heart Association; World Heart Federation; International Atherosclerosis Society; International Association for the Study of Obesity . Harmonizing the metabolic syndrome: a joint interim statement of the International Diabetes Federation Task Force on Epidemiology and Prevention; National Heart, Lung, and Blood Institute; American Heart Association; World Heart Federation; International Atherosclerosis Society; and International Association for the Study of Obesity. Circulation 2009; 120: 1640–1645 [DOI] [PubMed] [Google Scholar]
- 4.Eckel RH, Alberti KG, Grundy SM, et al. The metabolic syndrome. Lancet 2010; 375: 181–183 [DOI] [PubMed] [Google Scholar]
- 5.WHO . Physical Status: The Use and Interpretation of Anthropometry. Report of a WHO Expert Consultation. WHO Technical Report Series Number 854. World Health Organization, Geneva, 1995. [PubMed] [Google Scholar]
- 6.WHO Expert Consultation . Appropriate body‐mass index for Asian populations and its implications for policy and intervention strategies. Lancet 2004; 363: 157–163 [DOI] [PubMed] [Google Scholar]
- 7.Schindhelm RK, Diamant M, Dekker JM, et al. Alanine aminotransferase as a marker of non‐alcoholic fatty liver disease in relation to type 2 diabetes mellitus and cardiovascular disease. Diabetes Metab Res Rev 2006; 22: 437–443 [DOI] [PubMed] [Google Scholar]
- 8.Japan Diabetes Society . Treatment Guide for Diabetes 2010. Treatment Guide for Diabetes Editorial Committee (eds). Bunkodo, Tokyo, 2010. (Japanese). [Google Scholar]
- 9.Taniguchi A, Fukushima M, Sakai M, et al. Remnant‐like particle cholesterol, triglycerides, and insulin resistance in nonobese Japanese type 2 diabetic patients. Diabetes Care 2000; 23: 1766–1769 [DOI] [PubMed] [Google Scholar]
- 10.Chang SA, Kim HS, Yoon KH, et al. Body mass index is the most important determining factor for the degree of insulin resistance in non‐obese type 2 diabetic patients in Korea. Metabolism 2004; 53: 142–146 [DOI] [PubMed] [Google Scholar]
- 11.Masuo K, Katsuya T, Ogihara T, et al. Acute hyperinsulinemia reduces plasma leptin levels in insulin‐sensitive Japanese men. Am J Hypertens 2005; 18: 235–243 [DOI] [PubMed] [Google Scholar]
- 12.Yoshitomi Y, Ishii T, Kaneki M, et al. Relationship between insulin resistance and effect of atorvastatin in non‐diabetic subjects. J Atheroscler Thromb 2005; 12: 9–13 [DOI] [PubMed] [Google Scholar]
- 13.Nakai Y, Nakaishi S, Kishimoto H, et al. The threshold value for insulin resistance on homeostasis model assessment of insulin sensitivity. Diabet Med 2002; 19: 346–347 [DOI] [PubMed] [Google Scholar]
- 14.Ohnishi H, Saitoh S, Takagi S, et al. Incidence of insulin resistance in obese subjects in a rural Japanese population: the Tanno and Sobetsu study. Diabetes Obes Metab 2004; 7: 83–87 [DOI] [PubMed] [Google Scholar]
- 15.Matsumoto K, Miyake S, Yano M, et al. Glucose tolerance, insulin secretion, and insulin sensitivity in nonobese and obese Japanese subjects. Diabetes Care 1997; 20: 1562–1568 [DOI] [PubMed] [Google Scholar]
- 16.Shimomura H, Maehata E, Kawaguchi T, et al. Trial setting of the insulin resistance index homeostasis model assessment ratio: HOMA‐R reference values for targeting recipients of medical examinations. Seitai Siryo Bunseki 2003; 26: 123–128 (Japanese). [Google Scholar]
- 17.Bonora E, Kiechl S, Willeit J, et al. Prevalence of insulin resistance in metabolic disorders: the Bruneck Study. Diabetes 1998; 47: 1643–1649 [DOI] [PubMed] [Google Scholar]
- 18.Ascaso JF, Romero P, Real JT, et al. Insulin resistance quantification by fasting insulin plasma values and HOMA index in a non‐diabetic population. Med Clin (Barc) 2001; 117: 530–533 (Spanish). [DOI] [PubMed] [Google Scholar]
- 19.Lee JM, Okumura MJ, Davis MM, et al. Prevalence and determinants of insulin resistance among U.S. adolescents: a population‐based study. Diabetes Care 2006; 29: 2427–2432 [DOI] [PubMed] [Google Scholar]