Abstract.
It is necessary to extract target specimens from bioholographic images for high-level analysis such as object identification, recognition, and tracking with the advent of application of digital holographic microscopy to transparent or semi-transparent biological specimens. We present an interactive graph cuts approach to segment the needed target specimens in the reconstructed bioholographic images. This method combines both regional and boundary information and is robust to extract targets with weak boundaries. Moreover, this technique can achieve globally optimal results while minimizing an energy function. We provide a convenient user interface, which can easily differentiate the foreground/background for various types of holographic images, as well as a dynamically modified coefficient, which specifies the importance of the regional and boundary information. The extracted results from our scheme have been compared with those from an advanced level-set-based segmentation method using an unbiased comparison algorithm. Experimental results show that this interactive graph cut technique can not only extract different kinds of target specimens in bioholographic images, but also yield good results when there are multiple similar objects in the holographic image or when the object boundaries are very weak.
Keywords: three-dimensional image processing, digital holography, interactive graph cuts, cell analysis
1. Introduction
Since holography was first presented by Gabor in 1948,1 three-dimensional (3-D) optical imaging systems based on digital holography2–6 are widely viewed as a promising approach in life sciences,7–10 defense and security,11–13 medical diagnoses,14–17 robotics,18,19 and medicine.20–22 These systems have the strengths of being able to acquire images rapidly, illustrate the amplitude and phase information conveniently, and apply advanced image-processing techniques to complex field data never possible before. The two-dimensional (2-D) bright-field images of transparent or semi-transparent cells resulting from conventional bright-field optical microscopes often have low-contrast and produce limited details of the cell structure for cell analysis.16 Even though some 2-D imaging systems, such as quantitative phase contrast and differential interference contrast microscopies,23,24 have the feature to quantitatively investigate the biological microorganisms to some extent, they cannot provide optical thickness information about cells.16 On the contrary, the holographic images reconstructed numerically from a hologram obtained by digital holography-based imaging systems can provide rich 3-D information, such as the surface morphological and optical thickness data of these microorganisms, which make it possible for the 3-D measurement of objects.25,26 However, to clearly explore targets in holographic images, one must eliminate unnecessary background information which affects the examination. Furthermore, for higher level image processing such as the kind needed for 3-D object identification, recognition, and tracking, segmentation as a preprocessing step is also inevitable.
Segmentation is a technique of partitioning an image into several regions, so that each region will have similar color, texture, or intensity value.27 For a successful segmentation, all of the needed targets should be separated from the background. Conventionally, segmentation approaches can be broadly categorized into three groups. The first one is the region-based method.27,28 The typical technique that belongs to this category is a threshold scheme.27,29 It is the simplest and most efficient algorithm, since it only uses a threshold to divide the image into foreground and background. However, when the object is complex or the intensity values of the foreground and background are similar, this method will fail to get a practical result. Moreover, finding a reasonable threshold is also not easy. Most of the time, this method is used in conjunction with other approaches. Another famous region-based algorithm is region growing and region splitting-merging.27 Nevertheless, these methods suffer from difficulties in finding appropriate stop criteria for region growing or splitting. They will also make the segmented boundary not smooth. The second type is the edge-based segmentation.30 Those well-known algorithms include Sobel, Roberts, Canny, and Hough transformations.27 All these methods require that the boundary between foreground and background should be distinct. They are also very sensitive to noise and easily get many false edges. When discontinuity exists at the edge, they will fail to get an isolated object. Another widely used edge-based method is a watershed transform algorithm.27,31 It has the advantage in being able to find an isolated target which will satisfy most of the analyzers. On the other hand, the watershed transform algorithm easily produces over-segmentation and results in complex postprocessing steps. The last segmentation category is the energy-based algorithms. This method is needed to establish an energy function which can reach a minimal value when the image is segmented. Live wire,32 level sets,33,34–37 and graph cut38,39 are all grouped into energy-based approaches. The live wire method requires the user to identify the seed points which have to be located at the object boundary. Then, an image is segmented by minimizing a predefined energy function. The disadvantage of this method is that it is difficult to accurately choose those seed points. As the level-set algorithm, the segmentation result is related to the given initial curve and it only utilizes a boundary or regional information in the image. Moreover, the level set may converge at a local minimal value and cannot be counted on to get an optimal minimum result for the energy function. In contrast, the energy function of a graph cut is constructed by combining regional information with boundary information. Furthermore, a graph cut can obtain the globally optimal value for the energy function. Compared with a level set, a graph cut is also faster, which is a significant benefit.40
In most of the bioholographic images, sole region-based or edge-based segmentation will not work appropriately, since a large number of amplitude or phase values within the 3-D object are very close to the values in the background and some of the object boundaries are very weak. In this article, in consideration of the property of bioholographic images, we apply the graph cut algorithm to the segmentation of these holographic images. However, totally automatic segmentation for various types of bioholographic images is impractical and is unable to perfectly extract 3-D target objects. Therefore, appropriate user interaction is necessary in order to create reasonable segmentation. Consequently, we offer three convenient input buttons which can identify the foreground and background by drawing lines, ellipses, or strokes according to the shape of the 3-D object for the implementation of an interactive graph cut. Moreover, the coefficient of importance factor between regional and boundary information in the graph cut can be dynamically modified by the user for the segmentation of different types of bioholographic images. Experimental results show that this interactive graph cut method can work well for the segmentation of a variety of bioholographic images, even when there are multiple 3-D objects or when the differences between the object and background are not distinct.
In a recent research,41 we have presented that it was possible to extract target specimens in the bioholographic image using the interactive graph cut method with a simple user interface. However, the proposed method in the work is short of strong persuasion, since only one kind of holographic image is tested, and lack of comparison among the segmentation results. In this present study, the procedure for extracting target biological specimens in holographic images with an interactive graph cut algorithm is the same as that in Ref. 41. However, various bioholographic images including simple and complex ones are used to evaluate the segmentation performance of the interactive graph cut algorithm. This article is focused on showing the robustness of the interactive graph cut-based holographic image segmentation scheme, whereas other segmentation approaches may only work well on a specific bioholographic image. Moreover, a very user-friendly interface difference from the previous study is provided in this article, which incorporates more input buttons and a much clearer button arrangement. The coefficient of importance factor between regional and boundary information is also provided as a slider in user interface, which can be dynamically changed by the user. It seems that more input buttons may make the operation more complicated. But, clear button arrangement can reduce this difficulty. For example, the three buttons, including Line, Ellipse, and Stroke under the Foreground button, can be arbitrarily selected to identify an object according to the various structures of target biological specimens. In addition to that, the segmentation results from the interactive graph cut in this study are compared with those from an advanced level-set-based segmentation technique in terms of segmentation accuracy, iteration times, and processing time with an unbiased comparison algorithm. In summary, the previous work is extended with detailed concepts, user-friendly interface, various tested holographic images for algorithm verification, as well as comparison of segmentation results using an unbiased technique in terms of segmentation accuracy, iteration times, and computational time.
This article is organized as follows. In Sec. 2, we briefly introduce digital holographic microscopy (DHM) with single exposure. The graph-cut approach is described in Sec. 3. In Sec. 4, we present a procedure for creating an interactive graph cut for bioholographic image segmentation. In Sec. 5, we illustrate the experimental results obtained by the interactive graph cut and compare them with other methods. Finally, we conclude this article in Sec. 6.
2. Digital Holographic Microscopy with a Single Exposure for Bioapplications
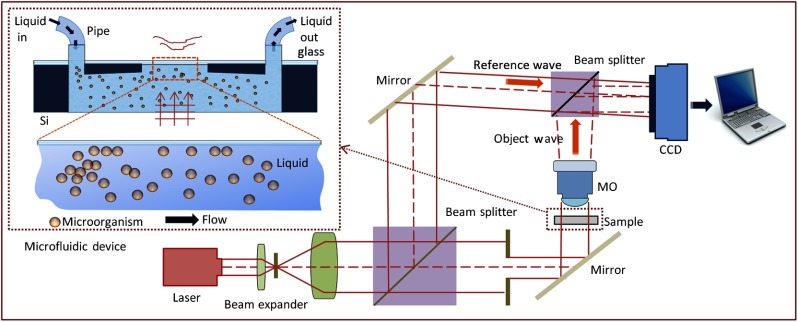
Among 3-D microscopy based on optical interferometry, DHM2–6 with single exposure comes to the forefront as the most promising tool for real-time 3-D microbial imaging, pattern recognition, and the study of their dynamics. The single-exposure DHM records digital Fresnel on- or off-axes holograms for 3-D biological imaging (see Fig. 1). The DHM having off-axis configuration provides a quantitative phase-contrast image by separating original and twin images in the reconstructed image with a limited angle between the object and reference beams. Meanwhile, the crosstalk between the original and twin images in the DHM having on-axis Gabor configuration is bound to low-spatial frequencies, so that the on-axis Gabor DHM can be utilized for investigation of microbial identification, dynamics, and distribution in 3-D space.
Fig. 1.
Schematic of the off-axis digital holographic microscopy (DHM).
To acquire the phase information of biological specimens, they are illuminated with coherent or temporally quasi-coherent light. The light starts to be diffracted from a biological specimen, and then the microbial digital hologram is obtained by magnifying diffracted light through a microscope objective. At the same time, the charge-coupled detector (CCD) sensor array, which is interfaced with a computer, records the digital hologram. The four components recorded by the CCD sensor are
| (1) |
where and denote the reference plane and the object waves, respectively. The magnified 3-D image or stack of 2-D images of the specimen is numerically reconstructed from their digital hologram at different depths with no mechanical scanning by using Fresnel transformation.9,42,43 Thus, it facilitates the analysis of the electric field variation of the specimen in the longitudinal dimension as well as in the transverse plane. In the Gabor DHM, the reference beam is automatically provided by ballistic photons, which pass through the specimen and its surrounding medium without any scattering. Since partially temporal incoherent light such as light-emitting diodes (LEDs) in Gabor geometry can be utilized instead of a laser beam, a much higher quality and lower cost 3-D holographic image can be obtained.
3. Graph-Cut Segmentation Algorithm
Since Yuri and Jolly first presented the graph-cut segmentation approach in 2001,38 graph cut-based algorithms have attracted great attention.39,40,44–48 It is an energy function-based method and can achieve a globally optimal result while minimizing the energy function.
3.1. Graph Cut
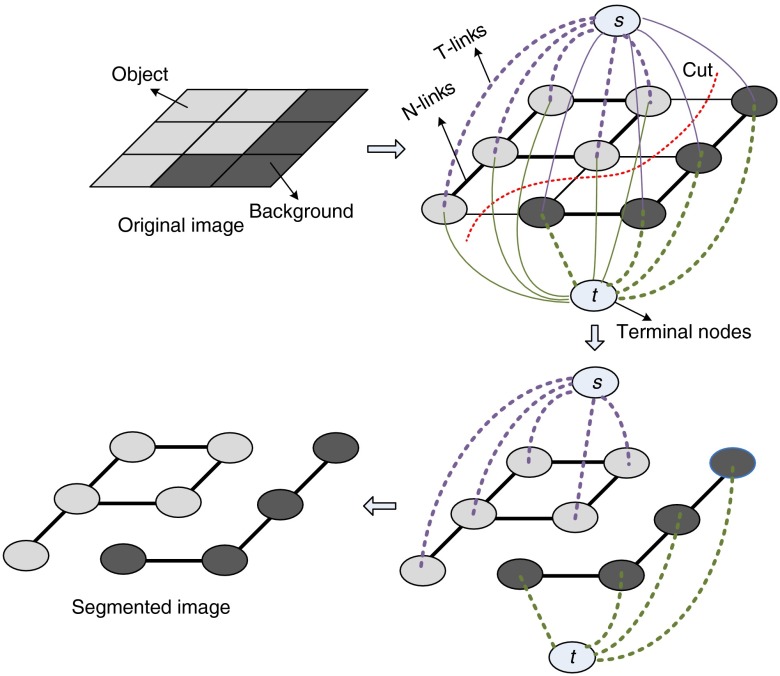
Let denotes an undirected graph, where is a set of nodes and is a set of edges.41 Nodes consist of two types of vertices. One is called the terminal nodes including (source) and (sink) and the other is the neighborhood nodes, which correspond to the pixels in the image. There are also two kinds of edges. The edges between two neighboring nodes are named -links, while the edges connecting terminal nodes with neighboring ones are described as -links. This kind of graph is regarded as an graph. For an graph, each edge will be given a non-negative weight . A cut is a subset of edges , and the cost of a cut is the sum of the weight on the edges in , which is expressed as . A minimum cut is a cut that has the minimum cost among all the cuts. For image segmentation, a minimum cut should hopefully occur at the position that can appropriately separate the object from the background. Min-cut is a method to obtain a minimum cut in a graph, and it can be implemented by finding the graph’s maximum flow.38,44 A min-cut/max-flow algorithm will disconnect the graph nodes into two clusters. However, nodes (source) and (sink) have to be grouped into different sets. Conventionally, a cluster with an node represents the foreground, while the other clusters denote the background. Figure 2 is the illustration of an graph and a min-cut.
Fig. 2.
Illustration of an graph and a min-cut. The thickness of the edge denotes the magnitude of the weight.
3.2. Energy Function for Graph Cut Segmentation Technique
Regarding graph-cut segmentation, the key step is to establish an energy function and assign weight to the two types of edges (- and -links).41 The energy function in a graph cut is defined by the following equation:38,39
| (2) |
where is a label assigned to pixel (node) in the image, is called the regional term, is a boundary term, and (between 0 to 1) is the coefficient which can specify the importance of the regional and boundary terms. The segmentation process can be explained as designating a different label for each pixel. When the pixel is labeled with 1, it can be classified as the foreground, and it can be viewed as the background when it is marked with 0. The graph-cut algorithm aims to find an assignment that can minimize the energy function. The regional term in Eq. (2) will comprise all the weights in -links, while the boundary term includes all the weights in -links. Thus, can be described as , where is one pixel in the image or one of the nodes in the neighborhood of . is the penalty for assigning node with label . Intuitively, when pixel is more likely to be the foreground, the penalty of should be bigger than , so as not to separate pixel from node and to make this pixel or node belong to the foreground. Consequently, the weight of the -links can be defined with the following equation:38,39
| (3) |
where and are the intensity models of the foreground and background, respectively. Equation (3) shows that when a pixel is inclined to be the object, which means , the weight of an edge between and is larger than that of nodes and . On the other hand, boundary term is expressed as , where nodes and are two neighboring pixels (neighborhood nodes) and belongs to set {0,1}. When , the value of will be 1. Otherwise, it is set to be 0. Instinctively, a high weight should be given to the -links edge when the two neighboring pixels are very similar, since they tend to belong to the same cluster. In this case, attempting to separate the two nodes will receive more penalties, which means that it will increase the energy. Accordingly, the weight of the -links edge can be specified as follows:38,39
| (4) |
where is regarded as camera noise.38,39,44 From the above description, a summary can be briefly given. In order to use the graph cut to segment the image and to minimize the energy function, the graph should be established first by using the image (see Fig. 2). Then, the intensity model of the foreground and background should be obtained in advance or calculated by the analysis of the image. The most important step for graph cut is to assign a weight to the - and -links edges. When one pixel (node) is more likely to be the object, the corresponding weight between this point and node should be larger than that with node . Otherwise, the weight of edge should be bigger than that of . Similarly, when the intensity of two neighboring pixels is very similar, the weight of the edge between them should be relatively large. After graph establishment and weight assignment to its edges, the max-flow algorithm can be used to get the min-cut in the graph,34,44,49 and the result will correspond to the image segmentation. At the same time, the minimum energy shown in Eq. (2) can be achieved in the segmented image.
4. Procedure of Interactive Graph-Cut Segmentation for Bioholographic Image
In this procedure, the bioholographic image obtained by DHM is first converted into a grayscale image, and the noise is removed by a median filter. Subsequently, the user has to interactively mark the foreground and background by drawing lines, strokes, or ellipses on the image according to the shape of the 3-D object in the bioholographic image. For a 3-D that is roughly linear or narrow, it is better to use a straight line to identify the object since it can accurately locate the foreground by two endpoints, whereas a stroke is little bit difficult to control, especially when the object is small or narrow. On the other hand, when the target appearance is inclined to be a circle or an ellipse, the user can also utilize the ellipse shape to identify it. The stroke is better to be used for identifying the incorrect segmented foreground and background obtained by previous segmentation results or some area without any specific characteristics. Anyway, we offer line, ellipse, and stroke options to conveniently mark the object and background for the interactive graph cut. When the segmentation result is not reasonable, more foreground and background points can be added interactively, so as to segment the image again by a graph cut based on the previous segmentation result. Furthermore, a user can also dynamically choose the coefficient of importance between regional and boundary information used in the graph-cut technique. When the regional information contributes more to segmentation compared with edge information, the coefficient can be set larger than 0.5. Otherwise, it is given a value of less than 0.5.
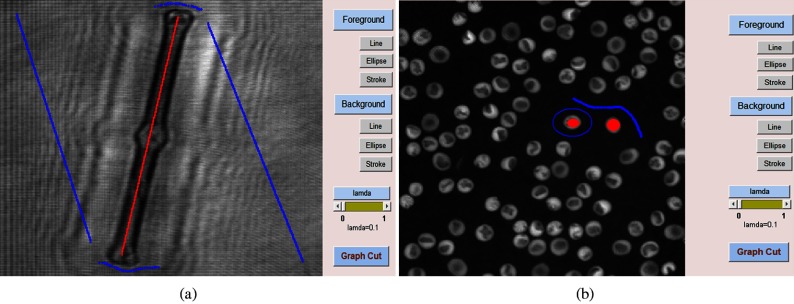
In summary, there are a total of six input buttons and one slider in this user interface [as shown in Fig. 4(a)]. The function of three buttons consisting of Line, Ellipse, and Stroke under Foreground is the same. These three buttons are used to identify the target biological specimens in the holographic image. To some extent, these buttons can be regarded as one button. Three different input buttons are adopted so as to make the identification convenient according to the structure of target biological specimens. Similarly, the three input buttons under Background play the same role in marking the background, which means that each of them can be equally used depending on the composition of the image. Theoretically, if more points are identified, a better segmentation will be achieved the first time, since more points are helpful to reconstruct the intensity model and set the weight in graph as described in Sec. 3.2. This step will not affect the final performance, since the uncorrected extraction results can be corrected in the revision process, although more computing time is needed. The slider in user interface decides the importance of regional and boundary terms [see Eq. (2)]. When the target region is much different from the background, it is better to set the slider value more than 0.5. On the other hand, the slider value should be less than 0.5 when the edge of the target biological specimens is more obvious. However, if it is difficult to judge which term, regional or boundary, is more important, the slider value can be set as 0.5. Once the slider value is set by above method, the segmentation results will not be varied much. The following subsections will describe these steps more clearly.
Fig. 4.
Foreground and background are marked. (a) Reconstructed Diatom alga amplitude image. (b) Reconstructed RBC phase image. Red color is for foreground, and blue color is for background.
4.1. Foreground and Background Identifications
In this procedure of interactive graph-cut segmentation, when most of the 3-D objects in the bioholographic images are very similar and very distinct from the background [see Fig. 3(c)], only some of the targets are needed to be marked as foreground by choosing one of the convenient input buttons. However, when the bioholographic images are extremely complex and the 3-D objects are very similar to the background [see Fig. 3(a)], it is better for the user to identify all the objects directly. In this process, when some of the targets in the holographic image are very small and narrow [see Fig. 3(b)], we can choose the line button to mark the needed object, since it is relatively easy and accurate to make the identification because we only need to click two endpoints for drawing a straight line. All the points passing the line will be regarded as the foreground or background. On the other hand, when the target is inclined to be a circle or an ellipse [see Fig. 3(c)], it is better to apply the ellipse button to mark these objects, since this is easy to be controlled. All the points within the ellipse will be taken as the foreground, and only the boundary points are viewed as a background when using the ellipse button for background identification. The stroke button can be used at any step, especially in the revision when the previous segmentation is not good, since it is easy to identify a small area using a stroke when some parts are mis-segmented. After finishing the marking, all the marked points will be expanded by morphological dilation operations with a small structuring element.27,50 The aim of this step is to increase the number of foreground and background pixels that will be beneficial to establish the foreground/background intensity models, which can be represented by a histogram with the obtained points. These intensity models will be used as standards to decide the weight of the points without being marked in the graph. In order to avoid the case that some points will be marked as both foreground and background in this step or in the revision step, we make a decision that the current identified points will replace the previous ones. That is, when a point is first marked as foreground and then identified as background, this point will be only viewed as background and the previous mark ignored.
Fig. 3.

Different types of 3-D objects in bioholographic images. (a) Target is not distinct from the background. (b) Target is very small and narrow. (c) Multiple similar targets are different from the background.
4.2. Graph-Cut Segmentation
For the graph segmentation, the most important step is to assign weight to the - and -links for establishing an graph.41 After the foreground and background are approximately marked in the previous step, the foreground/background intensity models, expressed as and , respectively, are achieved using the corresponding histogram. Then, the weight of the edges in the graph can be assigned as in Table 1.38,39,44 The marked points, which can be determined as belonging to either the foreground or background, are regarded as hard constraints. The weight between the marked foreground point and the node will be high, whereas it is low with the node in the graph. Similarly, the weight between the node and the marked background point will be small or large with the node. Thus, this can guarantee that the marked points will not be separated with a corresponding foreground or background.
Table 1.
Weight of the edge in the graph.
| Edge | Weight | Condition |
|---|---|---|
| (Unknown) | ||
| 0 | ||
| (Unknown) | ||
| 0 | ||
In Table 1, set includes all pixels in the reconstructed bioholographic image, nodes or are one of the pixels, denotes the neighborhood relationship, while and are the values of pixels and , respectively. When the weight of the edge is successfully set, the graph cut can be executed with a max-flow algorithm, and the segmentation result can be obtained. In this article, the default value is set to be 0.1, since edge information is more obvious compared with the regional information in our data. However, this value can be dynamically modified by the user at any time during segmenting.
4.3. Further Segmentation
When the segmentation result of the first time is not good, the user can revise the segmentation even further.41 The user can use any one of the input buttons to mark the foreground and background. Especially, the stroke button is convenient for the revision process. Newly marked points are added as hard constraints, and the weight of the edge has to be updated. When there is no overlap between previously marked foreground points and newly added background ones or previously marked background points and newly identified foreground ones, the max-flow algorithm can be conducted based on the previous result, which already found a maximum flow in the graph with the previous edge weight.38–44 However, when some already marked points change their status in the revision step, which means that some points identified as foreground or background previously are varied to background or foreground, the max-flow algorithm has to be run first. During the revision step, only the weight of the newly added points, which are also viewed as hard constraints, are updated, whereas the weight of other points remain the same. The weights of the edges that are related to the newly added pixels are given in Table 2.38,39
Table 2.
Edge weight for newly added points.
| Edge | Weight | Condition |
|---|---|---|
Similarly, when the segmentation result is still not perfect, the user should identify more foreground or background points with the input buttons in the user interface based on the previous extraction result. Then, the graph-cut segmentation method is executed again. If the user is satisfied with the segmentation result, the interactive process can be avoided, and the extracted target specimens can be used for high-level analysis directly. Otherwise, the revision step should be repeatedly conducted until the extraction results are visually satisfied by the user, which means that the target biological specimens are mostly segmented. In this experiment, the criteria for stopping the revision process can be quantitatively achieved by comparing the segmented target specimens with the reference image and computing the correlation between the two. For example, when the correlation value reaches 0.95, then the user may stop further revision. However, the criterion for stopping revision is not easy to be measured in the practical situation, since there is no reference image. This can only be done by the user. That is, when the segmented target specimen is satisfied, the user can decide not to revise the segmentation results anymore and thus use the extracted target specimens directly without further revision.
5. Experimental Results
In our experiment, the Gabor digital holograms of the Diatom alga and the Sunflower stem cell were recorded with an image sensor array of with a pixel size of , where the specimens were sandwiched between two transparent cover slips. Diatom alga and Sunflower stem cell holographic images (complex amplitude wavefronts in focus) were numerically reconstructed at a distance of 25 and 9 μm, respectively, from their own Gabor digital holograms by using the numerical algorithm described in Ref. 9. It is noted that the reconstructed image, which is the multiplication of the amplitude and the phase terms, means the wavefront of the original 3-D biological specimen. Also, the off-axis digital holograms of the red blood cells (RBCs) were recorded with an image sensor array of with a pixel size of . Quantitative phase images of RBCs in focus were reconstructed from the off-axis digital holograms obtained by DHM. It is noted that the reconstructed image means the phase term in the wavefront of the original 3-D biological specimen. The automated reconstruction and aberration compensation of the RBC wavefront are obtained by using the numerical algorithm described in Refs. 42 and 43. The original RBCs were donated by healthy people and stored in a transfusion bag, which were obtained from the Service Régional Vaudois de Transfusion Sanguine, at 4°C during the storage period.51 These holographic images were used to test the segmentation performance by an interactive graph cut. The coefficient , which decides the importance of regional and boundary terms, is set to be 0.1, since the boundary takes more importance in our most reconstructed bioholographic images. Depending on the shape of the 3-D object in the holographic image, we can choose the appropriate input button in order to identify the foreground and background. In Fig. 4(a), the reconstructed image of Diatom alga tends to be long and narrow, so it is better to use a straight line to mark the objects. Conversely, when the shape of the reconstructed image of RBCs [Fig. 4(b)] is close to a circle, the ellipse button will be utilized. Figure 4 shows the holographic images with object and background marked.
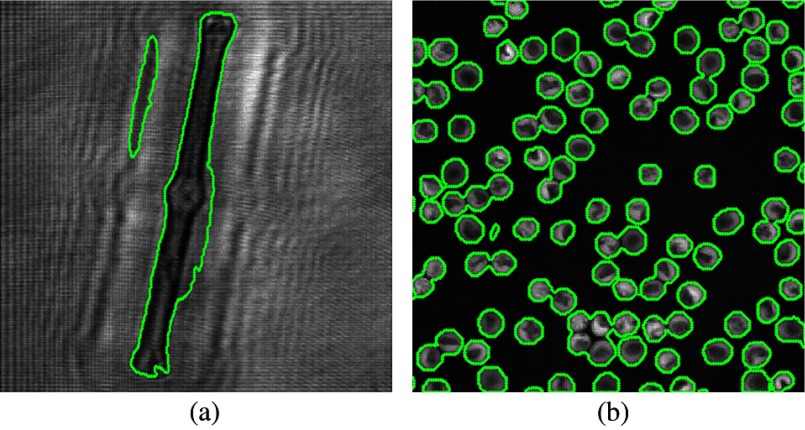
One of the segmentation steps by the interactive graph cut is presented in Fig. 5. It is noted that some of the parts are misclassified. Thus, further revision is needed. At the revision process, the user should add these misclassified points to their correct group (foreground or background). In this article, it is assumed that there is no hole for each object, which means that we will fill in the foreground after segmentation. Also, we will remove some small regions. Without filling in the holes, some holes in Fig. 4(b) will appear. In Fig. 5, the green maker indicates the segmented boundary. In Fig. 5(b), we can find that even if only a few of objects are marked, the graph-cut method can automatically get the other similar objects. However, when all the objects are totally different, most of the objects have to be identified in order to obtain a relative good segmentation result.
Fig. 5.
First segmentation result for a graph cut. (a) Reconstructed Diatom alga amplitude image. (b) Reconstructed RBC phase image.
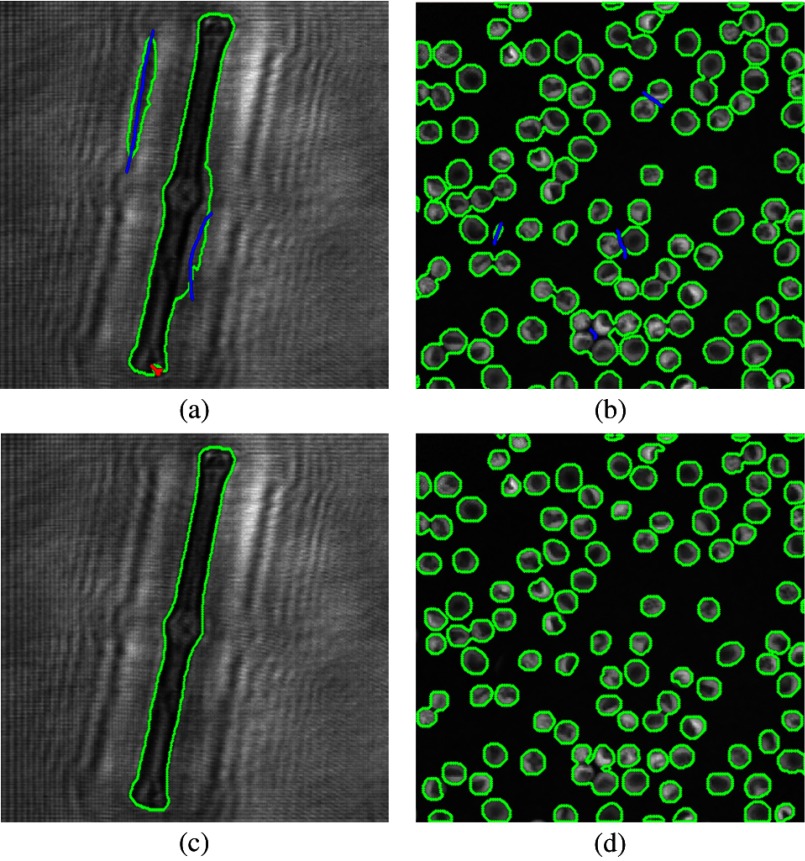
Due to the inaccuracy of the first segmentation result, more points have to be added to either the object or background. Thus, further segmentation needs to be executed again, based on a previous result. In Fig. 6, some further marks for the foreground/background and the final segmentation results are shown. This process will be conducted repeatedly until the interactive graph-cut segmentation results are visually satisfied by the user. In Fig. 6, three revision steps are performed to get reasonable targets.
Fig. 6.
Interactive revision steps. (a and b) The added points for the foreground/background. (c and d) A reasonable segmentation result after a two-step revision process.
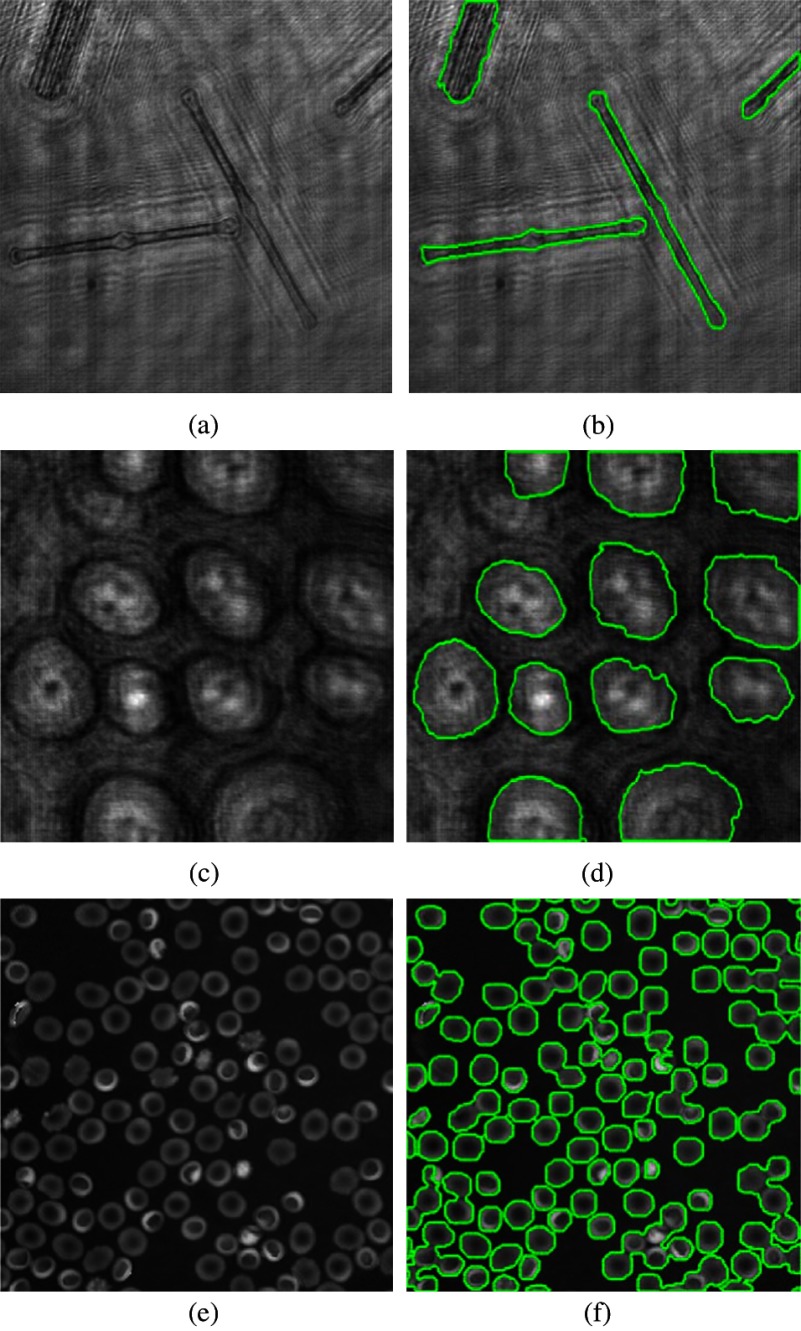
In Fig. 7, more holographic images [Fig. 7(a): Diatom alga, Fig. 7(c): Sunflower stem cell, and Fig 7(e): RBC] were used to test the interactive graph-cut method. Most of the targets can be successfully segmented within four steps in our experiment. However, for images where the targets are very similar to the background and the boundaries are not obvious, more than five steps are needed. For example, about five steps are conducted for the segmentation of bioholographic images in Fig. 7(c).
Fig. 7.
Segmentation of bioholographic images. (a) Reconstructed Diatom alga holographic image. (c) Reconstructed Sunflower stem cell holographic image. (e) Reconstructed red blood cell (RBC) holographic image. (b, d, and f) The corresponding segmentation results by the interactive graph-cut method.
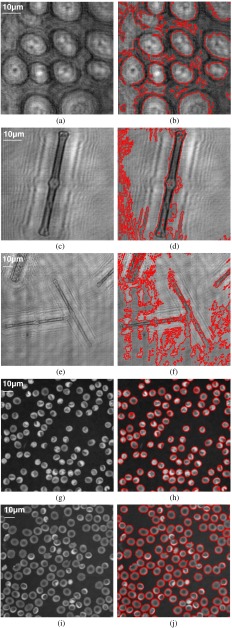
In addition, the experimental results obtained by an interactive graph cut are compared with those from a level-set approach presented in Ref. 35, which is a robust region-based active contour model achieving better performance than traditional geodesic active contours and Chan–Vese active contours36,37 in terms of both efficiency and accuracy. Figure 8 shows the segmentation results from the level set in Ref. 33. It is noted that this level-set method generates many over-segmentation problems when the object region is not different from that in the background, such as the results in Figs. 8(a), 8(c), and 8(e), whereas the results are accepted when the object intensity is dissimilar to the background, such as the results shown in Figs. 8(g) and 8(i), even though the weak boundary cannot be appropriately detected.
Fig. 8.
Segmentation of bioholographic images with the method in Ref. 35. (a, c, e, g and i) The reconstructed holographic images. (b, d, f, h, and j) The corresponding segmentation results by the active contour method in Ref. 35. The scale bar in the -axis is the same as that in the -axis.
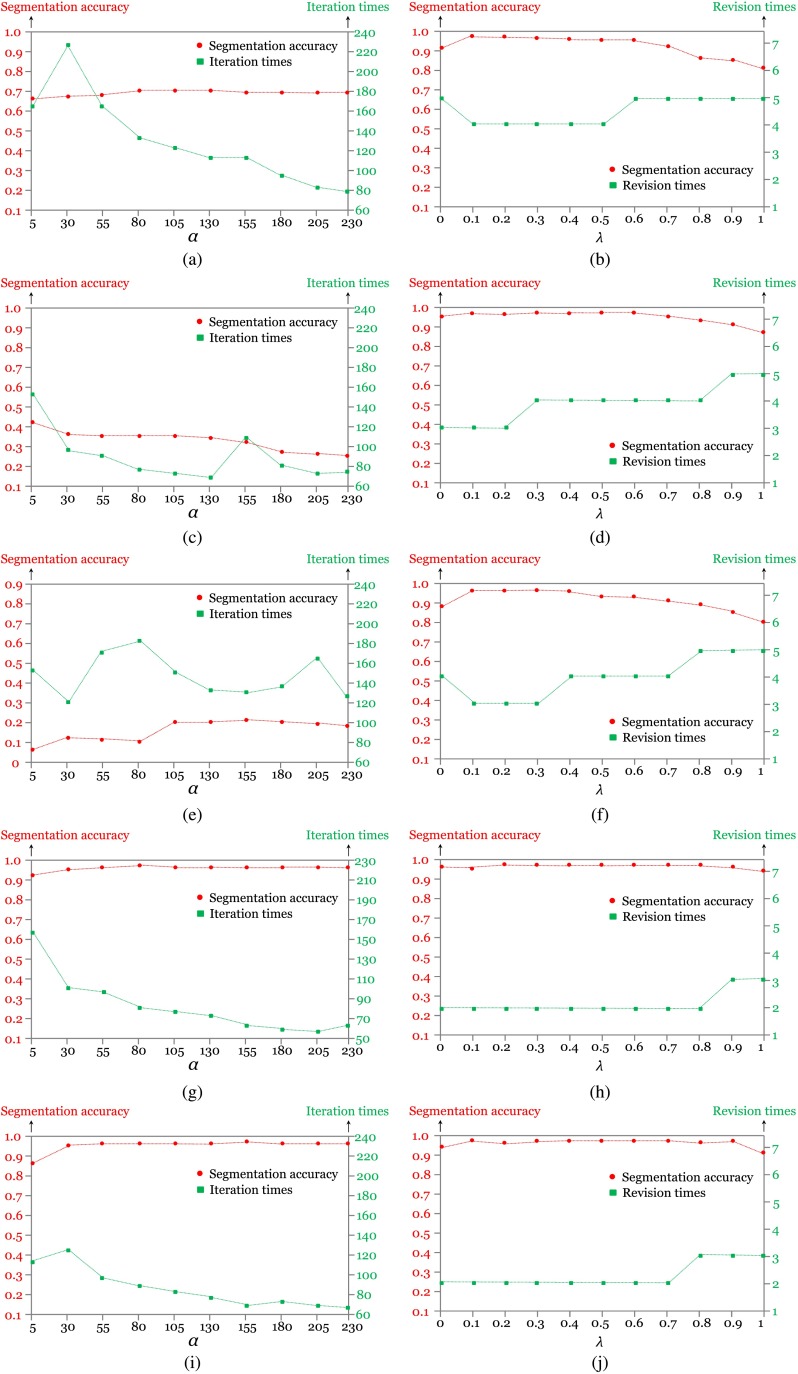
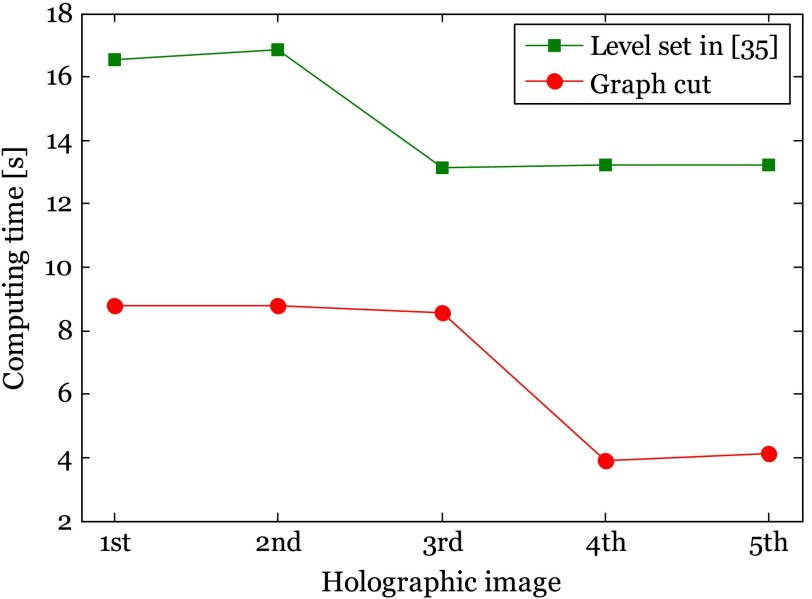
In order to avoid biased comparison results caused by varied parameters existing in different algorithms (e.g., the comparison between the best segmentation result in one algorithm and the worst segmentation result in the other algorithm), segmentation performance is evaluated by varying the parameter in both algorithms with the method in Ref. 52. The primary parameter in this interactive graph cut is the coefficient , which decides the importance of regional and boundary terms, whereas the primary parameter in Ref. 35 is the value of that controls the propagation speed. The segmentation accuracy is defined as the correlation between the segmented image and reference that is manually obtained. When the correlation value tends to be 1, it means high-segmentation accuracy. Moreover, the iteration and revision times for the two methods are measured in this experiment as well as the computing time. Figure 9 quantitatively shows the performance models for the five bioholographic images (Sunflower stem cell, Diatom alga with single target, Diatom alga with multiple targets, RBCs with predominantly stomatocyte shape, and RBCs with predominantly discocyte shape, as in the order shown in Fig. 8) between the level-set method in Ref. 35 and the interactive graph-cut method in this article. Figure 10 presents a comparison of computation times of the two algorithms. Here, we only consider the total execution time of the automatic segmentation part in the interactive graph cut which is the time taken in the automatic graph cut, excluding the time for the user interaction process. It is noted from Fig. 9 that the best performance from the interactive graph cut is superior to that from the level set segmentation in Ref. 35 on average. Especially, the experimental result shows that for the segmentation of the holographic images with twin image noises reconstructed from the Gabor digital hologram [see Figs. 8(a), 8(c), and 8(e)], the interactive graph-cut method achieves much better performance in terms of segmentation accuracy. It is also noted that, in our experiment, most of the bioholographic images can be successfully segmented within five revision steps without considering the specific 3-D shape using the interactive graph-cut segmentation approach, whereas the level-set method requires a large number of iterations for the segmentation of the holographic images. Even though the two methods can achieve similar performance results with some images, the interactive graph-cut approach definitely outperforms the level-set method for complex bioholographic images. Undeniably, most of the bioholographic images are very complex with multiple objects. Thus, the interactive graph-cut method is a better method for the application of segmentation to all kinds of bioholographic images. As the computing time in Fig. 10 shows, the automatic segmentation part in the interactive graph cut is superior to the level set in Ref. 35. However, we have to point out that we do not count the time taken for the user interaction process. On average, 40 s is needed for the user interaction for each image, which will increase the total segmentation time. Interestingly, people are usually sensitive to the computing time spent in the automatic part and lack of sensitivity to the interaction process, since unoccupied waiting feels longer than occupied waiting in the view of psychology.53 In this article, we concentrate on showing the robustness of the interactive graph scheme to various kinds of holographic images, while other segmentation approaches may only work well on a specific bioholographic image.
Fig. 9.
Performance models: (a, c, e, g and i) are the performance models for the five bioholographic images (sunflower stem cell, Diatom alga with single target, Diatom alga with multiple targets, RBCs with predominantly stomatocyte shape, and RBCs with predominantly discocyte shape, as in the order showed in Fig. 8) in the method of Ref. 35, where the is varied from 5 to 230 with an interval of 25. (b, d, f, h and j) are the performance models for the five bioholographic images (sunflower stem cell, Diatom alga with single target, Diatom alga with multiple targets, RBCs with predominantly stomatocyte shape, and RBCs with predominantly discocyte shape, as in the order showed in Fig. 8) in an interactive graph-cut segmentation method, where is varied from 0 to 1 with an interval of 0.1.
Fig. 10.
Computing time between level-set method in Ref. 35 and automatic graph-cut part in interactive graph-cut method. The first image is sunflower stem cell with a size of , the second image is Diatom alga with a single target and a size of , the third image is Diatom alga with multiple targets and an image size of , the fourth image is RBCs with predominantly stomatocyte shape and an image size of , and the fifth image is RBCs with predominantly discocyte shape and an image size of , as in the order showed in Fig. 8. In this figure, the computing times are measured with the parameters including , , and iteration times selected from Fig. 9, where the best segmentation accuracy is achieved.
6. Conclusion
In this article, the interactive graph-cut method, which incorporates regional and boundary information, has been applied to the segmentation of bioholographic images reconstructed from a digital hologram. In this interactive graph-cut procedure, three convenient input buttons labeled line, ellipse, and stroke are used to identify the foreground and background that can easily handle various types of holographic images. Moreover, the user can dynamically modify the coefficient of importance between regional and boundary information. In our experiment, we have shown that most of the reconstructed bioholographic images can be successfully segmented within five revision steps without considering the specific 3-D shape using the interactive graph-cut segmentation approach. Moreover, the interactive graph-cut algorithm can simultaneously extract similar multiple microbes in bioholographic images while only needing to identify some of the objects. The interactive graph-cut segmentation technique will be beneficial to the analysis of target biological specimens in the reconstructed bioholographic images, which can provide rich 3-D information about the target biological specimens. Compared with the other segmentation methods, the interactive graph-cut method can be appropriate for any bioholographic images, even though they have complex objects and backgrounds.
Acknowledgments
This research was supported by Basic Science Research Program through the National Research Foundation of Korea (NRF) funded by the Ministry of Education, Science and Technology (NRF-2013R1A2A2A05005687 and NRF-2012R1A1A2039249).
References
- 1.Gabor D., “A new microscopic principle,” Nature 161(4098), 777–778 (1948). 10.1038/161777a0 [DOI] [PubMed] [Google Scholar]
- 2.Yamaguchi I., Zhang T., “Phase-shifting digital holography,” Opt. Lett. 22(16), 1268–1270 (1997). 10.1364/OL.22.001268 [DOI] [PubMed] [Google Scholar]
- 3.Langehanenberg P., et al. , “Automated three-dimensional tracking of living cells by digital holographic microscopy,” J. Biomed. Opt. 14(1), 014018 (2009). 10.1117/1.3080133 [DOI] [PubMed] [Google Scholar]
- 4.Yi F., et al. , “Automated segmentation of multiple red blood cells with digital holographic microscopy,” J. Biomed. Opt. 18(2), 026006 (2013). 10.1117/1.JBO.18.2.026006 [DOI] [PubMed] [Google Scholar]
- 5.Dubois F., et al. , “Digital holographic microscopy for the three-dimensional dynamic analysis of in vitro cancer cell migration,” J. Biomed. Opt. 11(5), 054032 (2006). 10.1117/1.2357174 [DOI] [PubMed] [Google Scholar]
- 6.Rappaz B., et al. , “Noninvasive characterization of the fission yeast cell cycle by monitoring dry mass with digital holographic microscopy,” J. Biomed. Opt. 14(3), 034049 (2009). 10.1117/1.3147385 [DOI] [PubMed] [Google Scholar]
- 7.Marquet P., et al. , “Progress and perspectives in digital holographic microscopy applied to life sciences,” in IEEE 9th Euro‐American Workshop on Information Optics (WIO), pp. 1–4, IEEE; (2010). [Google Scholar]
- 8.Xu W., et al. , “Digital in-line holography for biological application,” PNAS 98(20), 11301–11305 (2001). 10.1073/pnas.191361398 [DOI] [PMC free article] [PubMed] [Google Scholar]
- 9.Moon I., et al. , “Automated three-dimensional identification and tracking of micro/nanobiological organisms by computational holographic microscopy,” Proc. IEEE 97(6), 990–1010 (2009) 10.1109/JPROC.2009.2017563 [DOI] [Google Scholar]
- 10.Ferraro P., Nicola S., Coppola G., “Digital holography: recent advancements and prospective improvements for applications in microscopy,” Optical Imaging Sensors and Systems for Homeland Security Applications, of Advanced Sciences and Technologies for Security Applications, Vol. 2, pp. 47–84, Springer; (2006). [Google Scholar]
- 11.Matoba O., et al. , “Optical techniques for information security,” Proc. IEEE 97(6), 1128–1148 (2009). 10.1109/JPROC.2009.2018367 [DOI] [Google Scholar]
- 12.Sun M., Zhu Z., “Digital image hiding technology based on three-dimension object digital holography encoded by double-random phase,” in Symposium on SOPO, pp. 1–4, IEEE; (2010). [Google Scholar]
- 13.Chen W., Chen X., “Space-based optical image encryption,” Opt. Express 18(26), 27095–27104 (2010). 10.1364/OE.18.027095 [DOI] [PubMed] [Google Scholar]
- 14.Seebacher S., Osten W., Juptner W., “Measuring shape and deformation of small objects using digital holography,” Proc. SPIE 3479, 104–115 (1998). 10.1117/12.316439 [DOI] [Google Scholar]
- 15.Furlong C., et al. , “Assessing eardrum deformation by digital holography,” SPIE News Room J. Biomed. Opt. Med. Imag. (2013). [DOI] [PMC free article] [PubMed] [Google Scholar]
- 16.Moon I., et al. , “Cell identification computational 3-D holographic microscopy,” Opt. Photonics News 22, 18–23 (2011). 10.1364/OPN.22.6.000018 [DOI] [Google Scholar]
- 17.Xu X., et al. , “Measurement of traction force of biological cells by digital holography,” Biomed. Opt. Express 3(1), 153–159 (2011). [DOI] [PMC free article] [PubMed] [Google Scholar]
- 18.Onda K., Arai F., “Robotic approach to multi-beam optical tweezers with computer generated hologram,” in IEEE Conf. ICRA, pp. 1825–1830, IEEE; (2011). [Google Scholar]
- 19.Rikoski R., Brown D., “Holographic navigation,” in IEEE Conf. ICRA, pp. 73–80, IEEE; (2008). [Google Scholar]
- 20.Ernest J., “Holography and medicine,” IEEE Trans. Biomed. Eng. 19(3), 194–205 (1972). [DOI] [PubMed] [Google Scholar]
- 21.Peach L., “Holography finds a home in medicine,” Laser Focus World 33(12), 131–135 (1997). [Google Scholar]
- 22.Rosen J., Holography, Research and Technologies, InTech, Croatia: (2011). [Google Scholar]
- 23.Curl C., et al. , “Quantitative phase microscopy-a new tool for investigating the structure and function of unstained live cells,” Proc. Aust. Physiol. Pharmacol. Soc. 34(12), 896–901 (2004). [DOI] [PubMed] [Google Scholar]
- 24.Fu D., et al. , “Quantitative DIC microscopy using an off-axis self-interference approach,” Opt. Lett. 35(14), 2370–2372 (2010). 10.1364/OL.35.002370 [DOI] [PMC free article] [PubMed] [Google Scholar]
- 25.Marquet P., et al. , “Digital holographic microscopy: a noninvasive contrast imaging technique allowing quantitative visualization of living cells with subwavelength axial accuracy,” Opt. Lett. 30(5), 468–470 (2005). 10.1364/OL.30.000468 [DOI] [PubMed] [Google Scholar]
- 26.Sun H., et al. , “Visualization of fast-moving cells in vivo using digital holographic video microscopy,” J. Biomed. Opt. 13(1), 014007 (2008). 10.1117/1.2841050 [DOI] [PubMed] [Google Scholar]
- 27.Gonzalez R., Woods R., Digital Imaging Processing, Prentice Hall, New York: (2002). [Google Scholar]
- 28.Karoui I., Boucher J., Augustin J., “Variational region-based segmentation using multiple texture statistics,” IEEE Trans. Image Process. 19(12), 3146–3156 (2010). 10.1109/TIP.2010.2071290 [DOI] [PubMed] [Google Scholar]
- 29.Raut S., et al. , “Image segmentation-a state-of-art survey for prediction,” in ICACC, pp. 420–424, IEEE; (2009). [Google Scholar]
- 30.Brejl M., Sonka M., “Object localization and border detection criteria design in edge-based image segmentation: automated learning from examples,” IEEE Trans. Med. Imaging 19(10), 973–985 (2000). 10.1109/42.887613 [DOI] [PubMed] [Google Scholar]
- 31.Beare R., “A locally constrained watershed transform,” IEEE Trans. Pattern Anal. Mach. Intell. 28(7), 1063–1074 (2006). 10.1109/TPAMI.2006.132 [DOI] [PubMed] [Google Scholar]
- 32.Falcao A., Udupa J., Miyazawa F., “An ultra-fast user-steered image segmentation paradigm:live wire on the fly,” IEEE Trans. Med. Imaging 19(1), 55–62 (2002). 10.1109/42.832960 [DOI] [PubMed] [Google Scholar]
- 33.Yu H., Wang D., Tan Z., “Level set methods and image segmentation,” in Int. Workshop on Medical Imaging and Augmented Reality, pp. 204–208, IEEE; (2002). [Google Scholar]
- 34.Vazirani V., Introduction to LP-Duality, pp. 93–100, Springer, New York: (2004). [Google Scholar]
- 35.Zhang K., et al. , “Active contours with selective local or global segmentation: a new formulation and level set method,” Image Vision Comput. 28(4), 668–676 (2010). 10.1016/j.imavis.2009.10.009 [DOI] [Google Scholar]
- 36.Chan T., Vese L., “Active contours without edges,” IEEE Trans. Image Process. 10(2), 266–277 (2001). 10.1109/83.902291 [DOI] [PubMed] [Google Scholar]
- 37.Mumford D., Shah J., “Optimal approximation by piecewise smooth function and associated variational problems,” Commun. Pure Appl. Math. 42(5), 577–685 (1989). 10.1002/(ISSN)1097-0312 [DOI] [Google Scholar]
- 38.Yuri Y., Jolly M., “Interactive graph cuts for optimal boundary & region segmentation of objects in N-D images,” in Int. Conf. Computer Vision, pp. 105–112, IEEE; (2001). [Google Scholar]
- 39.Yuri Y., Lea G., “Graph cuts and efficient N-D image segmentation,” J. Comput. Vision 70(2), 109–131 (2006). 10.1007/s11263-006-7934-5 [DOI] [Google Scholar]
- 40.Vineeth V., Narayanan P., “CUDA cuts: fast graph cuts on the GPU,” in IEEE Conf. CVPRW, pp. 1–8, IEEE; (2008). [Google Scholar]
- 41.Moon I., Yi F., “Bio-holographic image segmentation by using interactive graph-cut,” Proc. SPIE 8498, 849814 (2012). 10.1117/12.929546 [DOI] [Google Scholar]
- 42.Cuche E., Marquet P., Depeursinge C., “Simultaneous amplitude and quantitative phase contrast microscopy by numerical reconstruction of Fresnel off-axis holograms,” Appl. Opt. 38(34), 6994–7001 (1999). 10.1364/AO.38.006994 [DOI] [PubMed] [Google Scholar]
- 43.Colomb T., et al. , “Automatic procedure for aberration compensation in digital holographic microscopy and application to specimen shape compensation,” Appl. Opt. 45(5), 851–863 (2006). 10.1364/AO.45.000851 [DOI] [PubMed] [Google Scholar]
- 44.Boykov Y., Kolmogorov V., “An experimental comparison of min-cut/max-flow algorithm for energy minimization in vision,” IEEE Trans Pattern Anal. Mach. Intell. 26(9), 1124–1137 (2004). 10.1109/TPAMI.2004.60 [DOI] [PubMed] [Google Scholar]
- 45.Tao W., et al. , “Image thresholding using graph cuts,” IEEE Trans. Syst., Man, Cybern. 38(5), 1181–1195 (2008). 10.1109/TSMCA.2008.2001068 [DOI] [Google Scholar]
- 46.Liu Z., et al. , “Unsupervised salient object segmentation based on kernel density estimation and two-phase graph,” IEEE Trans. Multimedia 14(4), 1275–1289 (2012). 10.1109/TMM.2012.2190385 [DOI] [Google Scholar]
- 47.Le T., et al. , “Image segmentation based on modified graph-cut algorithm,” Electron. Lett. 46(16), 1121–1123 (2010). 10.1049/el.2010.1692 [DOI] [Google Scholar]
- 48.Chen X., et al. , “3D segmentation of fluid associated abnormalities in retinal OCT: probability constrained graph-search-graph-cut,” IEEE Trans. Med. Image 31(8), 1521–1531 (2012). 10.1109/TMI.2012.2191302 [DOI] [PMC free article] [PubMed] [Google Scholar]
- 49.Lawler E., Combinatorial Optimization: Networks and Matroids, pp. 117–120, Dover Publications, New York: (2001). [Google Scholar]
- 50.Jackway P., Deriche M., “Scale-space properties of the multiscale morphological dilation-erosion,” IEEE Trans. Pattern Anal. Mach. Intell. 18(1), 38–51 (1996). 10.1109/34.476009 [DOI] [Google Scholar]
- 51.Moon I., et al. , “Automated statistical quantification of threedimensional morphology and mean corpuscular hemoglobin of multiple red blood cells,” Opt. Express 20(9), 10295–10309 (2012). 10.1364/OE.20.010295 [DOI] [PubMed] [Google Scholar]
- 52.Sadjadi F., “Experimental design methodology: the scientific tool for performance evaluation,” Proc. SPIE 1310, 100–107 (1990). 10.1117/12.21799 [DOI] [Google Scholar]
- 53.Maister D., The Psychology of Waiting Lines, pp. 113–126, Lexington Books, Lexington, Massachusetts: (1985). [Google Scholar]


