

Abstract
Synthetic phased array (SPA) beamforming with Hadamard coding and aperture weighting is an optimal option for real-time volumetric imaging with a ring array, a particularly attractive geometry in intracardiac and intravascular applications. However, the imaging frame rate of this method is limited by the immense computational load required in synthetic beamforming. For fast imaging with a ring array, we developed graphics processing unit (GPU)-based, real-time image reconstruction software that exploits massive data-level parallelism in beamforming operations.
The GPU-based software reconstructs and displays three cross-sectional images at 45 frames per second (fps). This frame rate is 4.5 times higher than that for our previously-developed multi-core CPU-based software. In an alternative imaging mode, it shows one B-mode image rotating about the axis and its maximum intensity projection (MIP), processed at a rate of 104 fps. This paper describes the image reconstruction procedure on the GPU platform and presents the experimental images obtained using this software.
Keywords: GPU, Capacitive micromachined ultrasonic transducer, CMUT, Ring array, Volumetric imaging, Real-time imaging, Ultrasound imaging, Maximum intensity projection
I. Introduction
A ring-shaped transducer array enables volumetric imaging with fewer transducer array elements than a fully-populated 2-D array of the same extent. Therefore, the same image resolution can be achieved with fewer cable connections to the imaging system, however, typically at the expense of image quality. The clearance in the center of the aperture facilitates its integration with a guide wire or a therapeutic tool in intracardiac or intravascular applications [1], [2]. In addition, for photoacoustic imaging modality, the laser light can be easily delivered through the central lumen using an optical fiber [3].
Synthetic phased array (SPA) beamforming with Hadamard coding and aperture weighting is a good option for real-time volumetric imaging using a ring array [4]. In the basic form of SPA beamforming with an N-element ring array, a single element transmits and all N elements receive in each acquisition. Therefore, after N acquisitions, we collect the A-scans for all N × N transmit-receive pairs, from which we reconstruct an image through synthetic beamforming operations. This imaging scheme enables the use of Norton weighting to obtain the full disk aperture resolution [5], [6] and cosine apodization to suppress the side lobes [2], [7]. The single-element firing in SPA results in a low signal-to-noise ratio (SNR). Using Hadamard coding technique, however, one can improve the SNR by as much as times by firing all N elements together in each transmit, with the same number of N transmit events to acquire the full data set. Each transmit event uses a spatially encoded pulsing scheme that assigns a particular pulse polarity to each transducer element according to the Hadamard matrix [8], [9].
We had previously implemented a multi-core CPU-based real-time imaging system based on this method for our 64-element capacitive micromachined ultrasonic transducer (CMUT) ring array. The optical picture and the specifications of the CMUT array are presented in Fig. 1 and Table I, respectively.
Figure 1.

TABLE I.
CMUT Ring Array Specifications
| Number of elements | 64 |
| Radius to the array elements’ center | 1.16 mm |
| Center frequency | 10 MHz |
| Two-way pulse-echo fractional bandwidth (−6 dB) | 80 % |
| Element size | 80 × 100 μm2 |
CMUTs have emerged as an alternative to piezoelectric transducers. Being fabricated with micromachining processes, they have advantages in manufacturing transducer arrays with arbitrary geometries (e.g., ring array), as well as in easy integration with supporting electronics. In addition, wider bandwidth of CMUTs makes them a favorable choice for imaging applications [10], [11]. We fabricated our CMUT ring array using the sacrificial release process [12]. To improve the noise performance of this device, an application-specific integrated circuit (ASIC) mainly containing preamplifiers was designed, fabricated, and closely integrated with the CMUT array [13]. The ultrasound echo signals received by the ring array are amplified and buffered in the front-end ASIC, and then sampled by a data acquisition system for image reconstruction through digital signal processing.
Using our CPU-based real-time imaging system employing SPA beamforming with Hadamard coding and aperture weighting, we reported an imaging rate of 10 frames per second (fps) for displaying three cross-sectional images [4]. With the theoretical maximum rate of 463 fps according to ultrasound time of flight, the reported frame rate was limited by the computational load of SPA beamforming.
A graphics processing unit (GPU), designed with massively parallel structure to efficiently manipulate computer graphics, is more efficient than a general-purpose CPU for processing large blocks of data in parallel. Since the delay-and-sum operations, which take the largest part of synthetic image reconstruction time, are single instruction multiple data (SIMD) executions, they are suitable for GPU parallel processing by exploiting data-level parallelism. Recent emergence of compute unified device architecture (CUDA) made it easy to implement algorithms for execution on a GPU through high level programming languages such as C, and stimulated the development of GPU-based high-performance synthetic beamformers [14], [15].
For faster real-time imaging and better visualization of volume, we developed new image reconstruction software on a GPU platform. With much greater parallelism in the beamforming operations than the previous CPU-based software, this software reconstructs three cross-sectional images at 45 fps. In an alternative volumetric imaging mode showing one rotating B-mode plane and its maximum intensity projection (MIP), it reconstructs the image at 104 fps and displays up to 1.67 volumes per second with 5° rotation angle step, where the volume rate is limited by the monitor refresh rate of 60 Hz.
This paper describes our GPU-based imaging platform specifically for our 64-element ring array. The overall imaging system architecture and the GPU-based signal processing procedure are described in Section II. Both calculated and measured frame rates for two different imaging modes are reported in Section III, as well as the real-time experimental imaging results.
II. System Design and Signal Processing
A. Overall System Description
As commercial ultrasound medical imaging systems are designed for conventional imaging techniques and probes with standard geometry, they are not readily accessible for ring array imaging with synthetic beamforming and Hadamard coding. Therefore, we used a programmable PC-based imaging system (Verasonics Data Acquisition System, Verasonics Inc., Redmond, WA) to implement data acquisition for ring array imaging with SPA beamforming and Hadamard coding. A custom-designed interface board provides connection between this system and the CMUT ring array. The RF data collected by the Verasonics Data Acquisition System are transferred via PCI-Express interface to a PC, on which our custom-developed real-time image reconstruction software runs. The software processes the RF data on a GPU platform to reconstruct real-time images and display them on a monitor. The overall architecture of our imaging system is shown in Fig. 2, and the specifications of the data acquisition system and the PC we used in system implementation are presented in Table II.
Figure 2.

TABLE II.
Specifications of System Components
| Verasonics Data Acquisition System | |
| Number of transmit channels | 128 |
| Number of receive channels | 64 |
| Data transfer rate (to PC)* | 1.2 GB/s via 8-lane PCIe |
| PC (Mac Pro, Apple Inc.) | |
| CPU (Xeon Processor X5570, Intel Corporation) | |
| Clock speed | 3 GHz |
| Number of cores | 8 (16 virtual cores with hyper-threading) |
| RAM | 16 GB |
| GPU (Tesla C2070, Nvidia) | |
| Multiprocessor (MP) count | 14 |
| Number of cores | 448 |
| Processor clock speed | 1.15 GHz |
| Total memory size | 6 GB |
| Constant memory size | 64 KB |
| Shared memory per MP | 48 KB |
| Number of registers per MP | 32,768 (32-bit registers) |
| Memory clock speed | 1.5 GHz |
The data transfer rate of the Verasonics system is limited by the PCIe to local bus translator chip (PEX 8311, PLX Technology, Sunnyvale, CA), not by the PCIe bus.
B. GPU-based Image Reconstruction
Upon receiving the raw RF data, multiple CPU cores run in parallel to copy the data into page-locked memory and to optionally perform averaging over multiple acquisitions for improved SNR. Using page-locked memory makes the data transfer to GPU memory more efficient by allowing direct memory access through physical address of the buffer, with roughly a twofold performance advantage over using standard pageable memory [16]. In addition, it enables asynchronous data copy required to implement task parallelism using CUDA streams, which will be discussed shortly. The raw data are then transferred to GPU memory for real-time image reconstruction and display. The signal processing procedure for image reconstruction is summarized in Fig. 3.
Figure 3.

1) Data Transfer to GPU Memory, Hadamard Decoding, Analytic Signal Conversion, and Aperture Weighting
For an imaging depth of 25 mm and a sampling rate of 45 MHz, the system acquires 1,536 data samples per A-scan. With each data sample stored as a 2-byte unsigned integer, 12 MB of raw data are obtained per frame from 64 transmit events and 64 receive channels. It takes about 8 ms to copy this amount of data to GPU’s global memory from standard pageable CPU memory. However, utilizing page-locked memory reduces it to 4.1 ms.
The received raw data are Hadamard-coded because the transmit pulses are spatially encoded with the Hadamard matrix. Therefore, the first step in the signal processing is to decode the raw data to obtain the A-scan for each transmit-receive element pair in the data set, which can be done by multiplying the raw data by the Hadamard matrix. For this step, we used a fast Hadamard transform algorithm with a computational complexity of O(N · logN) [17], instead of simple matrix multiplication with an O(N2) complexity. The fast Hadamard transform follows the recursive definition of the N × N Hadamard matrix HN,
to recursively break down the transform into two half-sized transforms. A CUDA thread block is assigned to decode each A-scan, with the threads in the block accessing the data samples in sequential order to maximize the memory access efficiency. This algorithm consumes 4.5 ms of GPU time per frame in our implementation.
After Hadamard decoding, the software computes the analytic signal of the RF data. Ideally, this is done by Hilbert transform which involves a direct and an inverse Fourier transform. To save the time taken in the analytic signal conversion, we adopted the direct sampling process [18]. Since we are sampling the RF signal at four times the center frequency, the quadrature component of the analytic signal is approximately the in-phase signal delayed by one data sample; therefore, the quadrature component can be approximated by the RF data delayed by one data sample. Aperture weighting is easily combined with direct sampling by multiplying the corresponding weight when sampling the in-phase and the quadrature components of the RF signal. Direct sampling, including aperture weighting, takes 1.1 ms per frame, compared to 8.7 ms for ideal Hilbert transform implemented using the Nvidia CUDA fast Fourier transform library (cuFFT). Furthermore, we can combine these processes with Hadamard decoding; we modified the last iteration of the fast Hadamard transform to generate both the in-phase and the quadrature components of the weighted signal. The three processes, Hadamard decoding, analytic signal conversion, and aperture weighting, take 4.9 ms when combined altogether.
Using multiple CUDA streams, GPU kernel operations can run in parallel with data copy to or from the GPU memory. It is effective to parallelize the data transfer and the signal processing, because they take comparable amount of time. To implement this task parallelism, the RF data are split into 64 blocks, each containing the data received from one channel. The 64 data blocks are processed by two CUDA streams, each responsible for one of the odd or even channels’ data. While one stream transfers a block of data to GPU memory using the copy engine, the other stream performs signal processing for the previously transferred data block on the kernel engine, as illustrated in Fig. 4 (c). Signal processing time for one data block is longer than 1/64 of the processing time for the entire data, because fewer CUDA threads run in parallel to process a smaller data block. However, the total processing time is shorter with this task parallelism. Thus, all these four processes are combined and they take 6.4 ms per frame instead of 4.1 + 4.5 + 1.1 = 9.7 ms.
Figure 4.

2) Delay-and-Sum
The Hadamard-decoded and weighted analytic RF data are stored in a 2-D texture memory. With the two dimensions representing transmit-receive channel pair and time delay, the data samples constructing adjacent image pixels are spatially localized. Fig. 5 shows this texture memory structure, and illustrates how multiple CUDA threads run in parallel to reconstruct the image data. To reconstruct an image with N pixels, M·N CUDA threads are created, where M is the number of threads assigned to one image pixel. In our applications with around ten thousands pixels, M was empirically chosen to be eight. Running more threads in parallel makes the memory access inefficient and smaller M increases the computational overhead per thread, increasing the total processing time. Eight threads are assigned to each image pixel, and each thread performs delay-and-sum operations on the A-scans received by eight receive channels, covering all 64 channels. The outputs from these eight threads are then summed up to calculate the complex image data for one image pixel. The threads reconstructing adjacent image pixels are grouped together to optimize the memory access pattern by utilizing the spatial locality of the data samples in the 2-D texture memory. For fast delay calculation, the transducer element locations are stored in GPU’s constant memory.
Figure 5.

3) Envelope Detection and Image Post-Processing
The same number of threads as the number of pixels are launched and run in parallel to make the final image to be displayed on the screen. Each thread calculates the magnitude of one pixel from the complex image data, and optionally performs logarithmic or gamma compression for display. While being displayed on the screen, the final image data are transferred back to the CPU memory for on-demand saving.
III. Real-Time Imaging Performance
The signal processing time per image frame is a function of input and output data sizes. The input data size grows as we increase the imaging depth or the sampling rate, and it results in longer processing time in data transfer, Hadamard decoding, and analytic signal conversion. On the other hand, the output data size becomes larger when we reconstruct more image pixels by increasing the field of view or the pixel density. As a result, the time spent in the delay-and-sum and the envelope detection operations increases. Tables III and IV summarize how the signal processing time changes with the data size.
TABLE III.
Raw Data Size and Signal Processing Time
| Number of data samples per A-scan | 1,024 | 1,536 | 2,048 |
|---|---|---|---|
| Processing time for data transfer, Hadamard decoding, analytic signal conversion, and aperture weighting (ms)* |
4.9 | 6.4 | 8.6 |
Independent of the number of image pixels reconstructed.
TABLE IV.
Image Data Size and Signal Processing Time
| Number of image pixels reconstructed | 128 × 128 = 16,384 | 192 × 128 = 24,576 | 256 × 128 = 32,768 |
|---|---|---|---|
| Processing time for delay-and-sum (ms)* | 6.6 | 9.6 | 12.6 |
| Processing time for envelope detection (ms)* | 0.6 | 0.6 | 0.7 |
Independent of the number of data samples per A-scan.
A. Cross-Sectional Imaging
To deliver the volume information on the screen in real-time, the software displays three cross-sectional images, two B-mode planes orthogonal to each other and one constant-R plane. The frame rate varies depending on how many data samples we acquire for each A-scan, and how many pixels we reconstruct for these planes. Therefore, we can increase the frame rate with reduced field of view or lowered image pixel density. Calculated and experimentally-measured frame rates under various conditions are listed in Table V. The calculated frame rates are based only on the time spent for image reconstruction on the GPU. Experimental frame rates appear to be lower due to the additional overhead from the CPU for the raw data reception and, in some cases, the 60-Hz monitor refresh rate.
TABLE V.
Calculated and Measured Frame Rates (in Frames per Second) for Displaying Three Cross-Sectional Images
| Number of data samples per A-scan | 1,024 | 1,536 | 1,536 |
|---|---|---|---|
| Number of image pixels for the 3 planes | 2·(121 × 49) + (49 × 49) = 14,259 | 2·(121 × 49) + (49 × 49) = 14,259 | 2·(221 × 49) + (49 × 49) = 24,059 |
| Calculated frame rate | 78 | 70 | 53 |
| Measured frame rate | 60* | 55 | 45 |
Limited by the 60-Hz monitor refresh rate.
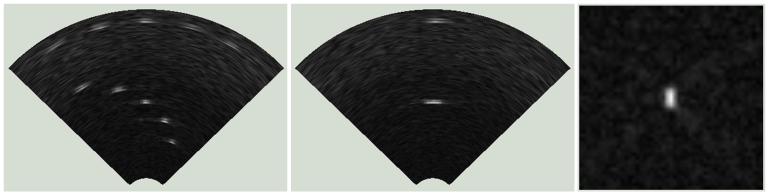
A test phantom was made using ten 150-μm fluorocarbon fishing wires [Fig. 6] to demonstrate real-time display of three cross-sectional images. With an imaging depth of 25 mm, we acquired 1,536 RF data samples at 45-MHz sampling rate for each A-scan. A total of 24,059 pixels were reconstructed for the three images, and then scan-converted using OpenGL for display on the screen. More details on the imaging conditions can be found in Table VI and a snapshot of the resulting real-time images of these three cross-sections are presented in Fig. 7. We achieved a rate of 45 fps to reconstruct and display these images, which is a significant improvement compared to 10 fps reported in [4]. The image pixels were sampled uniformly in (R, θ, φ) coordinate system in [4], and this resulted in more pixels for the same field of view than in Fig. 7 where the pixels were more efficiently sampled in (R, sin(θx), sin(θy)) space. For the same number of 24,059 pixels, our previous CPU-based software reconstructs 19 frames per second.
Figure 6.
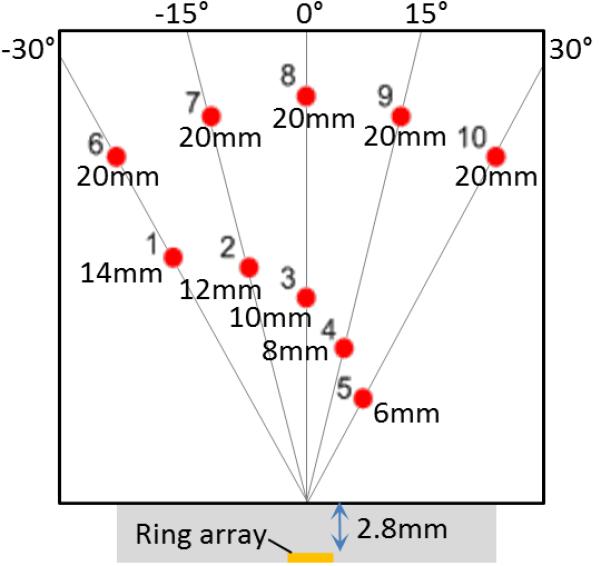
TABLE VI.
Experimental Conditions for Displaying Three Cross-Sectional Images
| Sampling frequency | 45 MHz |
| Operation frequency | 11.25 MHz |
| CMUT bias voltage | −50 V |
| Pulse amplitude | ±30 V (bipolar pulse) |
| Phantom | 10 fluorocarbon wire targets with 150-μm thickness, immersed in vegetable oil |
| Imaging depth | 3 mm - 25 mm |
| Number of samples per A-scan | 1,536 |
| Viewing angle | ±45° |
| Number of pixels reconstructed | 24,059 |
| Each of two B-mode images | 221 (axial) × 49 (lateral) = 10,829 |
| One constant-R image | 49 × 49 = 2,401 |
| Aperture weighting | Norton and cosine apodizations |
| Image post-processing | Gamma compression (γ = 0.7) |
Figure 7.
B. Volumetric Imaging
An alternative way to effectively display a volume is to rotate a B-mode image. In this implementation, we display only one B-mode plane that rotates about the axis by a small angle from frame to frame, covering the whole volume after 180° rotation. For better visualization of volume, orthogonal projection of this rotating plane is calculated and the MIP for the whole volume is displayed in real-time. Computing the MIP takes about 0.1 ms, which is negligible compared to the time taken in image reconstruction. The volume rate for this implementation is dependent on the rotation angle step, as well as the input and the output data sizes. Table VII shows the volume rate measured experimentally under different conditions.
TABLE VII.
Calculated and Experimental Image Frame Rates (in Frames per Second) and Volume Rates (in Volumes per Second) for Displaying One Rotating B-Mode Image and Its Maximum Intensity Projection
| Number of data samples per A-scan | 1,024 | 1,536 | ||||
|---|---|---|---|---|---|---|
| Number of image pixels reconstructed | 128 × 91 = 11,648 |
256 × 91 = 23,296 |
||||
| Rotation angle step from frame to frame (°) | 1 | 2 | 5 | 1 | 2 | 5 |
| Calculated frame rate for a single image | 104 | 104 | 104 | 64 | 64 | 64 |
| Measured frame rate for a single image | 60* | 60* | 60* | 52 | 52 | 52 |
| Calculated volume rate | 0.58 | 1.16 | 2.89 | 0.36 | 0.71 | 1.78 |
| Measured volume rate | 0.33* | 0.67* | 1.67* | 0.29 | 0.58 | 1.44 |
Limited by the 60-Hz monitor refresh rate.
A metal spring with a 6-mm diameter [Fig. 8] was imaged to display one rotating B-mode plane and its MIP in real-time. Each A-scan contained 1,024 data samples for an imaging depth of 15 mm, and the B-mode plane consisted of 11,648 pixels. Table VIII summarizes the conditions for this experiment. An imaging rate of 104 fps would have been achieved if limited only by the reconstruction time, but it was limited by the monitor refresh rate to 60 fps. The supplemental video shows the rotating plane and its MIP (link to the video), and Fig. 9 depicts one screenshot taken from this experiment. The B-mode plane [Fig. 9 (a)] rotated by 1° in every frame, covering the whole volume after 180° rotation. It resulted in a volume rate of 0.33 volumes per second. The MIP image [Fig. 9 (b)] was updated by the running MIP as the plane rotated in each frame, yielding a complete MIP image in every 180° rotation, after which it was reset for the next volume scan. In the MIP of the supplemental video, only half plane (θ ≥ 0) was projected in each frame to better visualize the rotating plane. Therefore, a complete MIP image was created in every 360° rotation.
Figure 8.

TABLE VIII.
Experimental Conditions for Displaying One B-Mode Image and Its Maximum Intensity Projection
| Sampling frequency | 45 MHz |
| Operation frequency | 11.25 MHz |
| CMUT bias voltage | −50 V |
| Pulse amplitude | ±30 V (bipolar pulse) |
| Phantom | A metal spring with a 6-mm diameter, immersed in vegetable oil |
| Imaging depth | 2 mm - 15 mm |
| Number of samples per A-scan | 1,024 |
| Viewing angle | ±45° |
| Number of pixels reconstructed | 128 (axial) × 91 (lateral) = 11,648 |
| Aperture weighting | Norton and cosine apodizations |
| Image post-processing | Gamma compression (γ = 0.7) |
Figure 9.

IV. Conclusion
We developed GPU-based real-time volumetric imaging software for a CMUT ring array and experimentally demonstrated its performance. With massive parallelism in the synthetic beamforming operations and more efficient sampling of image pixels, the GPU-based software reconstructs real-time images 4.5 times faster than the previous multi-core CPU-based software for displaying three cross-sectional images. Faster computation on the GPU platform enables the implementation of an alternative volume representation, where a fast rotating B-mode plane and its MIP are displayed in real-time. Both imaging modes were experimentally tested using a fishing wire phantom and a metal spring phantom, and they successfully generated real-time volumetric images as presented in this paper.
The achieved frame rates and volume rates are primarily limited by the GPU computational speed. As more and more powerful graphics cards become available, our software performance is expected to improve further. Some of the relevant advances include more efficient architecture, more GPU cores, and larger shared memory space for storing raw data samples which are currently stored in slower global memory. In addition, we can increase the throughput using multiple graphics cards in parallel [14]. Another limiting factor of the frame rate in our current system, especially for displaying a single rotating B-mode plane and its MIP, is our monitor that has a maximum refresh rate of 60 Hz. Commercially available monitors with higher refresh rates can be used to lift this limitation. Alternatively, given a rate of 60 fps, we can use GPU’s resources to implement additional functionalities such as a more elaborate volume rendering than the simple MIP, or to increase the image resolution.
The high computing power of GPU helps not only reduce the image reconstruction time but also visualize the volume more effectively and implement more compute-intensive applications such as ultrafast compound Doppler imaging [19]. Our current effort for ring array imaging focuses on improving the volume visualization through better rendering and image post-processing techniques. Another volumetric imaging mode, showing the forward-looking perspective view from the center of the ring array, is also under development. This mode will be particularly useful in navigational aid for catheters. In addition, we are expanding the GPU-based approach to other CMUT array geometries such as rectangular 2-D arrays, and to more imaging methods, for example, combined ultrasound and photoacoustic imaging, and 3-D ultrafast compound Doppler imaging.
Supplementary Material
ACKNOWLEDGMENT
This work was funded by the National Institutes of Health. CMUTs were fabricated at the Stanford Nanofabrication Facility (Stanford, CA), a member of National Nanotechnology Infrastructure Network. We would like to thank National Semiconductor (Santa Clara, CA) for their support in the design and fabrication of the IC, and Verasonics, Inc. for providing technical support. We also thank Nvidia for donating a C2070 graphics card.
This work was supported by the National Institutes of Health under Grants HL67647 and CA134720.
Contributor Information
Jung Woo Choe, Edward L. Ginzton Laboratory, Stanford University, Stanford, CA 94305, USA (choejw@ stanford.edu)..
Amin Nikoozadeh, Edward L. Ginzton Laboratory, Stanford University, Stanford, CA 94305, USA.
Ömer Oralkan, Edward L. Ginzton Laboratory, Stanford University, Stanford, CA 94305, USA; Department of Electrical and Computer Engineering, North Carolina State University, Raleigh, NC 27695, USA..
Butrus T. Khuri-Yakub, Edward L. Ginzton Laboratory, Stanford University, Stanford, CA 94305, USA.
References
- [1].Wang Y, Stephens DN, O’Donnell M. Optimizing the beam pattern of a forward-viewing ring-annular ultrasound array for intravascular imaging. IEEE Trans. Ultrason., Ferroelect., Freq. Contr. 2002 Dec.49(no. 12):1652–1664. doi: 10.1109/tuffc.2002.1159845. [DOI] [PubMed] [Google Scholar]
- [2].Yeh DT, Oralkan Ö, Wygant IO, O’Donnell M, Khuri-Yakub BT. 3-D ultrasound imaging using a forward-looking CMUT ring array for intravascular/intracardiac applications. IEEE Trans. Ultrason., Ferroelect., Freq. Contr. 2006 Jun.53(no. 6):1202–1211. doi: 10.1109/tuffc.2006.1642519. [DOI] [PubMed] [Google Scholar]
- [3].Vaithilingam S, Ma T-J, Furukawa Y, Wygant IO, Zhuang X, de la Zerda A, Oralkan Ö, Kamaya A, Gambhir SS, Jeffrey RB, Jr., Khuri-Yakub BT. Three-dimensional photoacoustic imaging using a two-dimensional CMUT array. IEEE Trans. Ultrason., Ferroelect., Freq. Contr. 2009 Nov.56(no. 11):2411–2419. doi: 10.1109/TUFFc.2009.1329. [DOI] [PubMed] [Google Scholar]
- [4].Choe JW, Oralkan Ö, Nikoozadeh A, Gencel M, Stephens DN, O’Donnell M, Sahn DJ, Khuri-Yakub BT. Volumetric real-time imaging using a CMUT ring array. IEEE Trans. Ultrason., Ferroelect., Freq. Contr. 2012 Jun.59(no. 6):1201–1211. doi: 10.1109/TUFFC.2012.2310. [DOI] [PMC free article] [PubMed] [Google Scholar]
- [5].Norton SJ. Annular array imaging with full-aperture resolution. J. Acoust. Soc. Am. 1992 Dec.92(no. 6):3202–3206. [Google Scholar]
- [6].Norton SJ. Synthetic aperture imaging with arrays of arbitrary shape. Part II: The annular array. IEEE Trans. Ultrason., Ferroelect., Freq. Contr. 2002 Apr.49(no. 4):404–408. doi: 10.1109/58.996557. [DOI] [PubMed] [Google Scholar]
- [7].Brunke SS, Lockwood GR. Broad-bandwidth radiation patterns of sparse two-dimensional vernier arrays. IEEE Trans. Ultrason., Ferroelect., Freq. Contr. 1997 Sep.44(no. 5):1101–1109. [Google Scholar]
- [8].Chiao RY, Thomas LJ, Silverstein SD. Sparse array imaging with spatially-encoded transmits. Proc. IEEE Ultrason. Symp. 1997;2:1679–1682. [Google Scholar]
- [9].Misaridis TX, Jensen JA. Space-time encoding for high frame rate ultrasound imaging. Ultrasonics. 2002 May;40:593–597. doi: 10.1016/s0041-624x(02)00179-8. [DOI] [PubMed] [Google Scholar]
- [10].Khuri-Yakub BT, Cheng CH, Degertekin FL, Ergun AS, Hansen ST, Jin XC, Oralkan Ö. Silicon micromachined ultrasonic transducers. Jpn. J. Appl. Phys. 2000 May;39:2883–2887. [Google Scholar]
- [11].Oralkan Ö, Ergun AS, Johnson JA, Demirci U, Karaman M, Kaviani K, Lee TH, Khuri-Yakub BT. Capacitive micromachined ultrasonic transducers: Next-generation arrays for acoustic imaging? IEEE Trans. Ultrason., Ferroelect., Freq. Contr. 2002 Nov.49(no. 11):1596–1610. doi: 10.1109/tuffc.2002.1049742. [DOI] [PubMed] [Google Scholar]
- [12].Ergun AS, Huang Y, Zhuang X, Oralkan Ö, Yarahoglu GG, Khuri-Yakub BT. Capacitive micromachined ultrasonic transducers: fabrication technology. IEEE Trans. Ultrason., Ferroelect., Freq. Contr. 2005 Dec.52(no. 12):2242–2258. doi: 10.1109/tuffc.2005.1563267. [DOI] [PubMed] [Google Scholar]
- [13].Nikoozadeh A, Oralkan Ö, Gencel M, Choe JW, Stephens DN, de la Rama A, Chen P, Thomenius K, Dentinger A, Wildes D, Shivkumar K, Mahajan A, O’Donnell M, Sahn D, Khuri-Yakub PT. Forward-looking volumetric intracardiac imaging using a fully integrated CMUT ring array. Proc. IEEE Ultrason. Symp. 2009:511–514. [Google Scholar]
- [14].Yiu BYS, Tsang IKH, Yu ACH. GPU-based beamformer: fast realization of plane wave compounding and synthetic aperture imaging. IEEE Trans. Ultrason., Ferroelect., Freq. Contr. 2011 Aug.58(no. 8):1698–1705. doi: 10.1109/TUFFC.2011.1999. [DOI] [PubMed] [Google Scholar]
- [15].Hansen JM, Schaa D, Jensen JA. Synthetic aperture beamformation using the GPU. Proc. IEEE Ultrason. Symp. 2011:373–376. [Google Scholar]
- [16].Sanders J, Kandrot E. CUDA by example. Addison Wesley; 2011. [Google Scholar]
- [17].Fino BJ, Algazi VR. Unified matrix treatment of the fast Walsh-Hadamard transform. IEEE Trans. Computers. 1976 Nov.C-25(no. 11):1142–1146. [Google Scholar]
- [18].Ranganathan K, Santy MK, Blalock TN, Hossack JA, Walker WF. Direct sampled I/Q beamforming for compact and very low-cost ultrasound imaging. IEEE Trans. Ultrason., Ferroelect., Freq. Contr. 2004 Sep.51(no. 9):1082–1094. doi: 10.1109/tuffc.2004.1334841. [DOI] [PubMed] [Google Scholar]
- [19].Bercoff J, Montaldo G, Loupas T, Savery D, Mézière F, Fink M, Tanter M. Ultrafast compound Doppler imaging: Providing full blood flow characterization. IEEE Trans. Ultrason., Ferroelect., Freq. Contr. 2011 Jan.58(no. 1):134–147. doi: 10.1109/TUFFC.2011.1780. [DOI] [PubMed] [Google Scholar]
Associated Data
This section collects any data citations, data availability statements, or supplementary materials included in this article.