

To assess the redundancy of lamins B1 and B2, knock-in lines were created that produce lamin B2 from the Lmnb1 locus and lamin B1 from the Lmnb2 locus. Both lines developed severe neurodevelopmental abnormalities, indicating that the abnormalities elicited by the loss of one B-type lamin cannot be prevented by increased synthesis of the other.
Abstract
Lamins B1 and B2 (B-type lamins) have very similar sequences and are expressed ubiquitously. In addition, both Lmnb1- and Lmnb2-deficient mice die soon after birth with neuronal layering abnormalities in the cerebral cortex, a consequence of defective neuronal migration. The similarities in amino acid sequences, expression patterns, and knockout phenotypes raise the question of whether the two proteins have redundant functions. To investigate this topic, we generated “reciprocal knock-in mice”—mice that make lamin B2 from the Lmnb1 locus (Lmnb1B2/B2) and mice that make lamin B1 from the Lmnb2 locus (Lmnb2B1/B1). Lmnb1B2/B2 mice produced increased amounts of lamin B2 but no lamin B1; they died soon after birth with neuronal layering abnormalities in the cerebral cortex. However, the defects in Lmnb1B2/B2 mice were less severe than those in Lmnb1-knockout mice, indicating that increased amounts of lamin B2 partially ameliorate the abnormalities associated with lamin B1 deficiency. Similarly, increased amounts of lamin B1 in Lmnb2B1/B1 mice did not prevent the neurodevelopmental defects elicited by lamin B2 deficiency. We conclude that lamins B1 and B2 have unique roles in the developing brain and that increased production of one B-type lamin does not fully complement loss of the other.
INTRODUCTION
The nuclear lamina, an intermediate-filament meshwork beneath the inner nuclear membrane, provides a structural scaffold for the cell nucleus (Worman et al., 2009; Burke and Stewart, 2013). The main protein components of the nuclear lamina are lamins A, C, B1, and B2 (Gerace et al., 1984; Worman et al., 2009; Burke and Stewart, 2013). Lamins A and C (A-type lamins) are splice isoforms from the same gene (LMNA; Lin and Worman, 1993) and are not expressed until late in embryonic development (Rober et al., 1989; Coffinier et al., 2011; Burke and Stewart, 2013). Lmna-knockout mice survive development but die between 2 and 6 wk of age with myopathy and cardiomyopathy (Sullivan et al., 1999). Lamins B1 and B2 (B-type lamins) are products of independent genes, LMNB1 and LMNB2 (Zewe et al., 1992; Biamonti et al., 1992; Lin and Worman, 1995; Maeno et al., 1995; Worman et al., 2009). Lamins B1 and B2 are ∼60% identical at the amino acid level (Davies et al., 2011) and are expressed ubiquitously from the earliest stages of development. For years, dogma held that the B-type lamins played essential functions in the cell nucleus (e.g., DNA replication, formation of the mitotic spindle; Belmont et al., 1993; Moir et al., 1994; Harborth et al., 2001; Tsai et al., 2006; Malhas et al., 2007, 2009, 2010; Shimi et al., 2008; Tang et al., 2008; Martin et al., 2009), but recent studies with tissue-specific knockout mice cast doubt on that view—at least for certain cell types. For example, the absence of both lamins B1 and B2 in keratinocytes or hepatocytes does not lead to any obvious abnormalities (Yang et al., 2011a, b).
We previously showed that lamins B1 and B2 have important functions in the developing brain (Vergnes et al., 2004; Coffinier et al., 2010, 2011). Lmnb2-deficient mice were nearly normal in size during development but died soon after birth with a neuronal layering defect in the cerebral cortex. Neuronal birthdating studies demonstrated that the layering defect was due to defective neuronal migration from the ventricular zone to the cortical plate (Coffinier et al., 2010). Lmnb2-deficient fibroblasts grew normally and did not have misshapen nuclei. Lmnb1-deficient mice (Vergnes et al., 2004) survived development but were small and died soon after birth with a neuronal layering defect in the cerebral cortex (Coffinier et al., 2011). The neurodevelopmental defects in Lmnb1-deficient mice were more severe than those in Lmnb2-deficient mice (Coffinier et al., 2010, 2011). Lmnb1-deficient fibroblasts had multiple nuclear blebs (Vergnes et al., 2004). Studies with forebrain-specific knockout mice revealed that both lamins B1 and B2 are also important for survival of cortical neurons (Coffinier et al., 2011).
The fact that lamins B1 and B2 have similar sequences and expression patterns, along with the fact that Lmnb1- and Lmnb2-knockout mice have similar neurodevelopmental defects, naturally leads to the question of whether lamins B1 and B2 have redundant functions. The best way to assess functional redundancy in closely related proteins is to determine whether increased production of one protein can prevent the disease phenotypes associated with loss of the other (Wang et al., 1996; Geng et al., 1999; Schweda et al., 2009). In the present study, we adopted this approach. We generated two strains of reciprocal knock-in mice—one knock-in line producing lamin B2 from the Lmnb1 locus and another producing lamin B1 from the Lmnb2 locus. These new knock-in mouse models provided fresh, definitive insights regarding the functional redundancy of the B-type lamins in mammals.
RESULTS
Lmnb1B2/B2 mice
We used gene targeting to insert a lamin B2 cDNA (3287 base pairs) into the translational start site of exon 1 of Lmnb1 (generating the Lmnb1B2 allele); this allele was designed to eliminate Lmnb1 transcripts and produce lamin B2 from the Lmnb1 promoter (Figure 1A). Targeted embryonic stem (ES) cell clones were identified by long-range PCR (Figure 1, B and C) and real-time PCR (RT-PCR; Figure 1D). Sequencing of the Lmnb1B2 RT-PCR product identified the junction between the Lmnb1 5′ untranslated region (UTR) and the Lmnb2 protein-coding sequences (Figure 1E).
FIGURE 1:

Generation of the Lmnb1B2 allele, which yields lamin B2 from the Lmnb1 locus. (A) Map of the Lmnb1 locus and the targeting vector, which was designed to introduce a Lmnb2 cDNA into the translational start site in exon 1 of Lmnb1 (at an NcoI site). The Lmnb2 cDNA was modified to introduce a new EcoRV site and remove an existing SacI site (depicted by an asterisk), making it possible to distinguish Lmnb1B2 transcripts from those of the endogenous Lmnb2 locus. Exons are depicted as black boxes (E1 and E2); the noncoding region of exon 1 is in white. Black arrowheads indicate the loxP sites. The neo cassette is shown as a gray box; a diphtheria toxin (DTA) counterselection cassette is shown as a black box. The primers used for recombineering (GF, GR, LF, and LR) are indicated. The primers used for 5′ long-range PCR (5′ LR-PCR) and 3′ long-range PCR (3′ LR-PCR) are indicated by arrows. (B) Screening of ES cell clones by 5′ long-range PCR. A 5.8-kb fragment was amplified from the Lmnb1B2 allele; the identity of the fragment was confirmed by EcoRV digestion (yielding 5.4-and 0.4-kb fragments). (C) Screening of ES cell clones by 3′ long-range PCR. A 6-kb DNA fragment was amplified from the Lmnb1B2 allele; the identity of the fragment was confirmed with BamHI digestion (yielding 4.3- and 1.7-kb fragments). A nonspecific band is indicated by an asterisk. (D) EcoRV digestion of a 950–base pair Lmnb2 RT-PCR fragment (amplicon from exons 1–7 of Lmnb2) from Lmnb1B2/+ and Lmnb1+/+ ES cells. Lmnb2 RT-PCR DNA fragments from the Lmnb1B2 allele (but not from the endogenous Lmnb2 allele) were cleaved by EcoRV (yielding an 850–base pair fragment). (E) DNA sequencing chromatogram of an RT-PCR fragment from the Lmnb1B2 allele showing the junction between the Lmnb1 5′ UTR and Lmnb2 coding DNA sequences (CDS).
Because Lmnb1B2/B2 mice produce lamin B2 transcripts from both Lmnb1B2 and Lmnb2, we predicted that lamin B2 expression in these mice would be greater than in wild-type mice. Indeed, Lmnb2 transcript levels in the cerebral cortex of Lmnb1B2/B2 mice were >2.61 ± 0.32–fold higher than in wild-type mice (Figure 2A). Similar findings were observed at the protein level; lamin B2 levels in the cerebral cortex of Lmnb1B2/B2 mice were 3.01 ± 0.16–fold higher than in wild-type mice (Figure 2, B and C).
FIGURE 2:
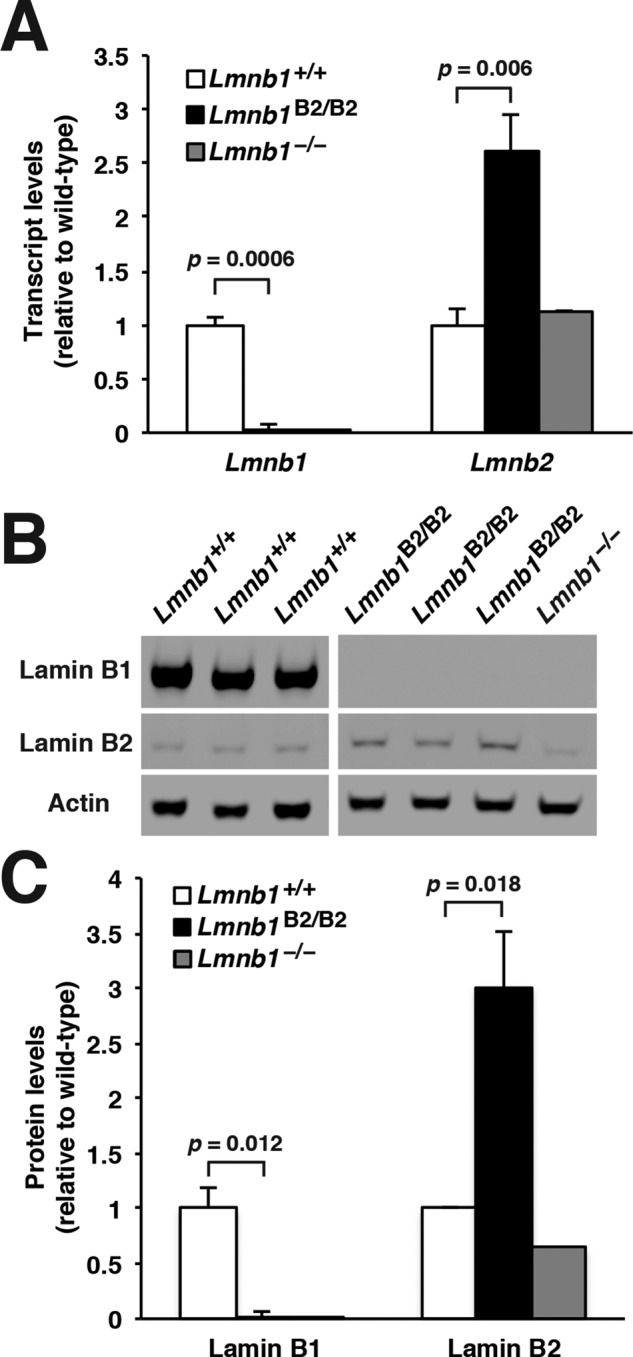
Levels of lamin transcripts and proteins in the cerebral cortex of E18.5 Lmnb1B2/B2 embryos. (A) Lamin transcript levels in the cerebral cortex of Lmnb1+/+, Lmnb1B2/B2, and Lmnb1−/− embryos by quantitative RT-PCR. Transcript levels (mean ± SD) were normalized to cyclophilin A and compared with the levels in Lmnb1+/+ mice (set at 1.0). Lmnb2 transcript levels in Lmnb1B2/B2 embryos were higher than those in Lmnb1+/+ embryos (p = 0.006). Lmnb1 transcripts were undetectable in Lmnb1B2/B2 embryos. (B) Western blot of protein extracts from cerebral cortex biopsies of E18.5 Lmnb1+/+, Lmnb1B2/B2, Lmnb1−/− embryos (the same embryos analyzed in A). Actin was used as a loading control. (C) Quantification of lamin protein levels for the Western blot in B relative to actin (mean ± SD) and compared with levels in wild-type mice (set at 1.0). Lamin B2 protein levels in the cerebral cortex were higher in Lmnb1B2/B2 embryos than in Lmnb1+/+ embryos (p = 0.018). Lamin B1 was undetectable in Lmnb1B2/B2 embryos.
Lmnb1B2/B2 mice were small and died within 1 h of birth. However, the abnormalities in Lmnb1B2/B2 mice were less severe than in Lmnb1−/− mice (Figure 3). The body weights of embryonic day 18.5 (E18.5) Lmnb1B2/B2 embryos (0.86 ± 0.12 g; n = 10) were 28.4 ± 0.04% lower than those of wild-type littermate mice (1.20 ± 0.14 g; n = 22; p < 0.001), but they were 23.4% higher than those of Lmnb1−/− embryos (0.69 ± 0.08 g; n = 5; p = 0.007). The brain weights in the Lmnb1B2/B2 embryos (0.05 ± 0.01 g) were 55.5 ± 0.05% lower than in wild-type embryos (0.09 ± 0.01 g, p < 0.001) but 62.8% higher than in Lmnb1−/− embryos (0.03 ± 0.01 g, p < 0.001; Figure 3A and Supplemental Table S1). Hematoxylin and eosin–stained brain sections revealed a neuronal layering defect in the cerebral cortex of both Lmnb1−/− and Lmnb1B2/B2 embryos, but the density of neurons was significantly higher in Lmnb1B2/B2 brains than in Lmnb1−/− brains (Figure 3, B and C). Neuronal layering defects were also apparent by immunohistochemistry with antibodies against Cux1 and Ctip2 (Supplemental Figure S1). Immunohistochemistry studies on the putamen of Lmnb1B2/B2 mice revealed higher-than-normal levels of lamin B2 expression and absent expression of lamin B1 (Figure 3D).
FIGURE 3:
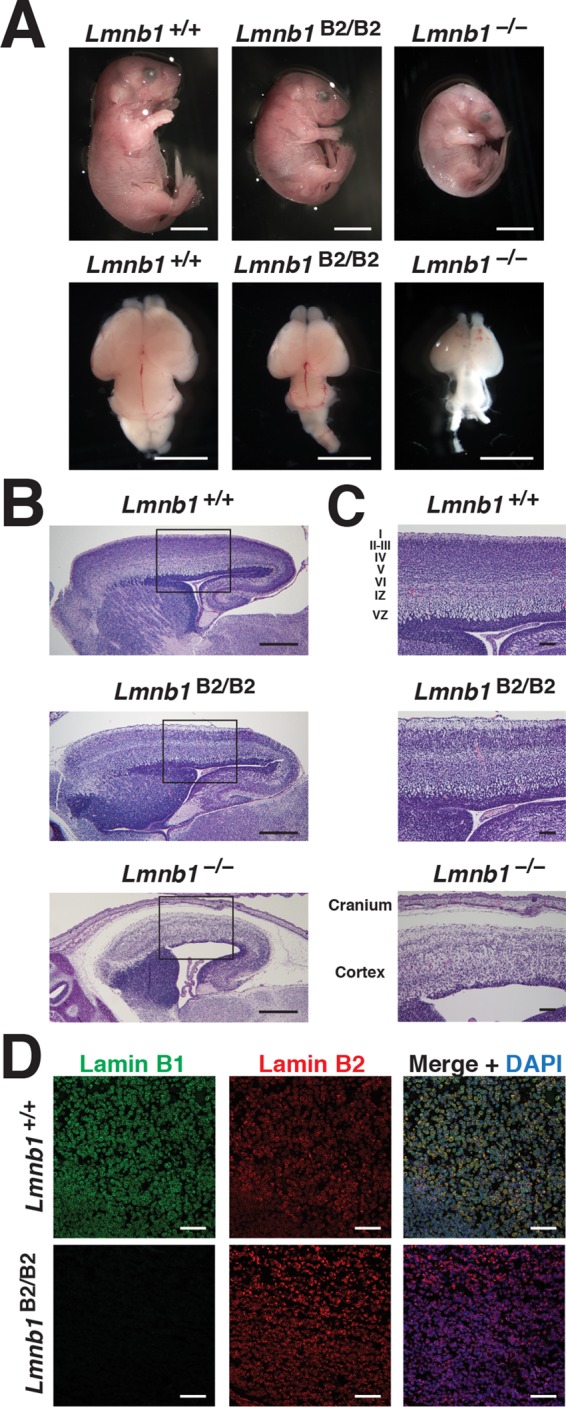
Phenotypes of Lmnb1B2/B2 mice. (A) Photographs of E18.5 Lmnb1+/+, Lmnb1B2/B2, and Lmnb1−/− embryos and the brains from these mice. Scale bar, 2 mm. (B) Hematoxylin and eosin–stained sagittal sections of brains from E18.5 embryos. Scale bar, 500 μm. (C) Higher-magnification images of the boxed areas in B, showing abnormal layering of cortical neurons in Lmnb1B2/B2 mice. Scale bar, 100 μm. (D) Immunofluorescence microscopy of the putamen in E18.5 Lmnb1+/+ and Lmnb1B2/B2 embryos with antibodies against lamin B1 (green) and lamin B2 (red). Merged images show DAPI (blue) staining. Scale bar, 50 μm.
Lmnb2B1/B1 mice
We inserted a lamin B1 cDNA (2516 base pairs) at the translational start site within exon 1 of Lmnb2 (generating the Lmnb2B1 allele). The Lmnb2B1 allele was designed to eliminate Lmnb2 transcripts and drive the expression of lamin B1 (Figure 4A). Targeted ES cell clones were identified by long-range PCR (Figure 4, B and C) and RT-PCR (Figure 4D). Sequencing of an RT-PCR product from the Lmnb2B1 allele revealed the junction between Lmnb2’s 5′-UTR and the Lmnb1 protein-coding sequences (Figure 4E).
FIGURE 4:

Generation of the Lmnb2B1 allele, which yields lamin B1 from the Lmnb2 locus. (A) Map of the Lmnb2 locus and the targeting vector, which was designed to introduce a Lmnb1 cDNA into the translational start site in exon 1 of Lmnb2 (at an NcoI site). A novel BglII site was introduced into the Lmnb1 cDNA and an existing NotI site (depicted by an asterisk) was eliminated, making it possible to identify Lmnb1 transcripts originating from the Lmnb2B1 and Lmnb1 alleles. Exons are depicted as black boxes (E1 and E2); the noncoding region of exon 1 is in white. Black arrowheads depict the loxP sites. The neo cassette is shown as a gray box; a diphtheria toxin (DTA) counterselection cassette is shown as a black box. The primers used for recombineering (GF, GR, LF, and LR) are indicated. The primers used for 5′ long-range PCR (5′ LR-PCR) and 3′ long-range PCR (3′ LR-PCR) are indicated by arrows. (B) Screening of ES cell clones by 5′ long-range PCR. A 7.6-kb fragment was amplified from the Lmnb2B1 allele; the identity of the fragment was confirmed by BglII digestion (yielding fragments of 3, 2.2, 1.4, and 1 kb). No product was amplified from wild-type DNA (Lmnb2+/+). (C) Screening of ES cell clones by 3′ long-range PCR. A 5.77-kb fragment was amplified from the Lmnb2B1 allele; the identity of the fragment was confirmed with BglII digestion (yielding fragments of 3.80, 1.64, 0.22, and 0.11 kb (the 0.11-kb fragment ran off the gel and is not seen in this photograph). (D) BglII digestion of a 706–base pair Lmnb1 RT-PCR fragment (amplicon from Lmnb2’s 5′ UTR to exon 4 of Lmnb1) from Lmnb2B1/+ ES cells. The RT-PCR fragment from the Lmnb2B1 allele was cleaved by BglII. (E) DNA sequencing chromatogram of an RT-PCR fragment from the Lmnb2B1 allele showing the junction between the Lmnb2 5′ UTR and the Lmnb1 coding sequences (CDS).
In earlier studies, we reported that body weights in Lmnb2-knockout mice (Lmnb2−/−) were normal, but their brains were slightly smaller than in wild-type mice (Coffinier et al., 2010). In the present studies, we found that the body weights of E18.5 Lmnb2B1/B1 embryos (1.18 ± 0.11 g; n = 20) were similar to those of wild-type mice (1.20 ± 0.14 g; n = 22; p = 0.65); however, the brain weights in Lmnb2B1/B1 embryos (0.06 ± 0.01 g) were 27.6 ± 0.15% lower than in wild-type embryos (0.09 ± 0.01 g, p < 0.001; Supplemental Table S1). Lmnb2 transcripts were absent in the cerebral cortex of Lmnb2B1/B1 embryos (p = 0.001), but Lmnb1 transcript levels in the cerebral cortex of Lmnb2B1/B1 embryos (n = 5) were 70 ± 7.1% higher than in wild-type mice (n = 4; p = 0.001; Figure 5A). Lamin B2 protein was absent in the cerebral cortex of E18.5 Lmnb2B1/B1 embryos, but levels of lamin B1 protein were slightly increased (Figure 5, B and C).
FIGURE 5:
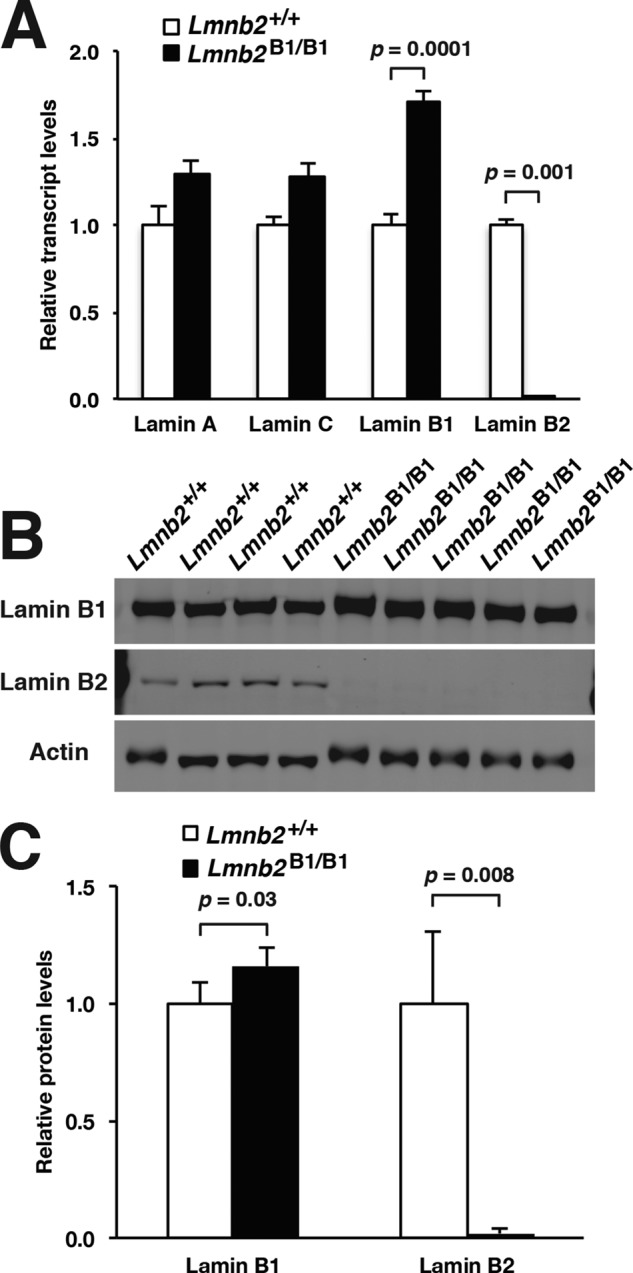
Nuclear lamin expression in the cerebral cortex of E18.5 Lmnb2B1/B1 embryos. (A) Lamin transcript levels, as judged by quantitative RT-PCR, in the cerebral cortex of Lmnb2+/+ and Lmnb2B1/B1 embryos. Transcript levels (mean ± SD) were normalized to cyclophilin A and compared with the levels in Lmnb2+/+ mice (set at 1.0). Lmnb1 transcript levels in Lmnb2B1/B1 embryos were higher than those in Lmnb2+/+ embryos (p = 0.001); Lmnb2 transcripts were undetectable (p = 0.001; Lmnb2+/+, n = 4; Lmnb2B1/B1, n = 5). (B) Western blot of protein extracts from the cerebral cortex of E18.5 Lmnb2+/+ and Lmnb2B1/B1 embryos (the same embryos studied in A). (C) Quantification of lamin B1 and lamin B2 protein levels in the Western blot shown in B relative to actin (mean ± SD) and compared with levels in wild-type controls (set at 1.0). Lamin B1 levels in Lmnb2B1/B1 embryos were higher than those in Lmnb1+/+ embryos (p = 0.039); lamin B2 was undetectable in Lmnb2B1/B1 embryos (p = 0.008).
Like Lmnb2-knockout mice (Coffinier et al., 2010), Lmnb2B1/B1 mice died soon after birth. Hematoxylin and eosin–stained sections of the cerebral cortex of Lmnb2B1/B1 embryos were essentially normal in size (Figure 6A), but there was a neuronal layering defect in the cerebral cortex (Figure 6, B and C, and Supplemental Figure S1)—similar to the pathology in Lmnb2−/− mice (Coffinier et al., 2010). Immunohistochemistry studies on the putamen confirmed an absence of lamin B2 in Lmnb2B1/B1 mice (Figure 6D).
FIGURE 6:
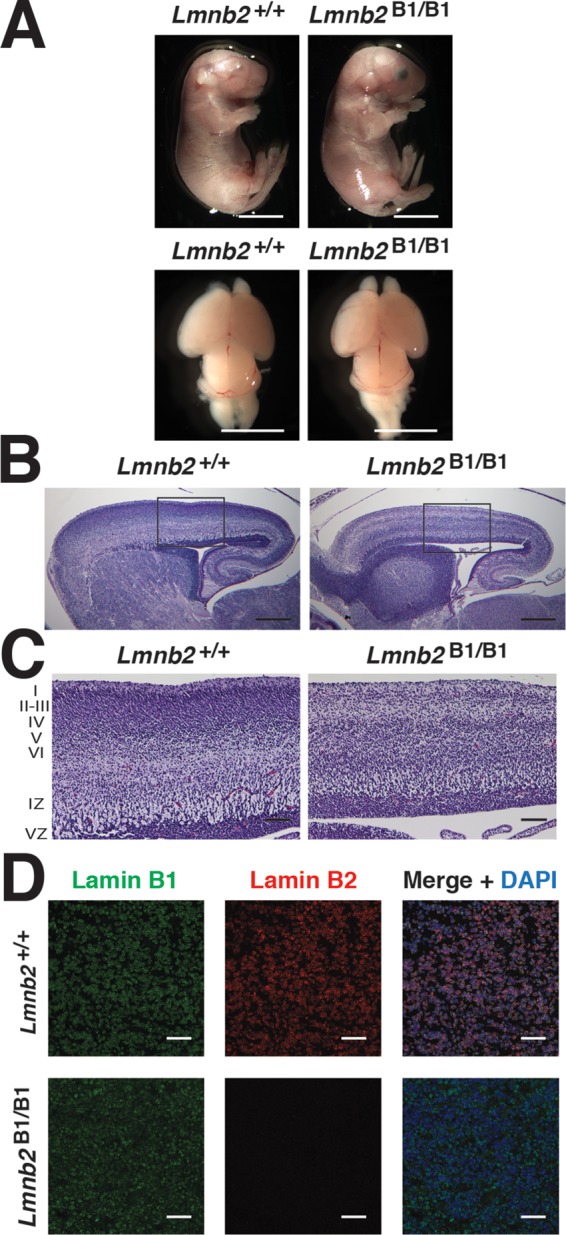
Phenotypes of Lmnb2B1/B1 mice. (A) Photographs of E18.5 Lmnb1+/+ and Lmnb2B1/B1 embryos and their brains. Scale bar, 2 mm. (B) Hematoxylin and eosin–stained sagittal sections of brains from E18.5 embryos. Scale bar, 500 μm. (C) Higher-magnification images of the boxed areas in B, demonstrating abnormalities in the layering of cortical neurons in Lmnb2B1/B1 mice. Scale bar, 100 μm. (D) Immunofluorescence microscopy of the putamen in E18.5 Lmnb2+/+ and Lmnb2B1/B1 embryos with antibodies against lamin B1 (green) and lamin B2 (red). Merged images show DAPI (blue) staining. Scale bar, 50 μm.
Intercrosses of mice harboring both knock-in alleles
We generated mice carrying both knock-in alleles (Lmnb1B2/+Lmnb2B1/+) and then intercrossed those mice. No viable Lmnb1B2/B2Lmnb2B1/B1 mice were observed by the age of weaning among 207 offspring (p < 0.001 by the chi-squared statistic). Subsequent studies revealed that Lmnb1B2/B2Lmnb2B1/B1 mice survived development but died soon after birth. As expected, both lamins B1 and B2 were present in the cerebral cortex of Lmnb1B2/B2Lmnb2B1/B1 mice, but the steady-state levels of lamin B1 were only 16.4% of those in wild-type mice (Figure 7, B and C). The levels of lamin B2 in Lmnb1B2/B2Lmnb2B1/B1 mice tended to be somewhat lower than in wild-type mice, but this difference was not statistically significant (p = 0.16; Figure 7C)
FIGURE 7:

Characterization of Lmnb1B2/B2Lmnb2B1/B1 mice. (A) Levels of lamin transcripts in Lmnb1+/+, Lmnb1B2/B2, Lmnb1B2/B2Lmnb2B1/B1, and Lmnb1−/− embryos. Quantitative RT-PCR analysis of Lmnb1 and Lmnb2 transcript levels in the cerebral cortex of E18.5 embryos. Transcript levels (mean ± SD) were normalized to cyclophilin A and compared with the levels in wild-type mice (set at 1.0). Lmnb1 transcript levels in Lmnb1B2/B2Lmnb2B1/B1 mice (n = 5) were 23.9% of those in wild-type mice (n = 4); Lmnb2 transcript levels in Lmnb1B2/B2Lmnb2B1/B1 mice were 51.1% higher than those in wild-type mice; Lmnb2 transcript levels in Lmnb1B2/B2 mice (n = 6) were 171% higher than those in wild-type mice. (B) Western blot of protein extracts from the cerebral cortex of E18.5 Lmnb1B2/B2, Lmnb1B2/B2Lmnb2B1/B1, and Lmnb1−/− embryos and wild-type embryos. (C) Quantification of lamin B1 and lamin B2 protein levels in the Western blot shown in B relative to actin (mean ± SD) and compared with wild-type controls (set at 1.0). Lamin B1 was undetectable in Lmnb1B2/B2 embryos. Lamin B1 levels in Lmnb1B2/B2Lmnb2B1/B1 embryos were only 16.4% of those in wild-type mice. (D) Photographs of E18.5 wild-type, Lmnb1B2/B2, and Lmnb1B2/B2Lmnb2B1/B1 embryos along with the brains from the same mice. Scale bar, 2 mm. (E) Hematoxylin and eosin–stained sagittal sections of brains from E18.5 embryos. Scale bar, 500 μm. (F) Higher-magnification images of the boxed areas in E. Scale bar, 100 μm.
Body weights of E18.5 Lmnb1B2/B2Lmnb2B1/B1 embryos (0.86 ± 0.11 g; n = 5) were similar to those of Lmnb1B2/B2 embryos (0.86 ± 0.12 g, n = 10; p = 0.98). However, the brain weights of Lmnb1B2/B2Lmnb2B1/B1 embryos (0.06 ± 0.01 g) were 17.9 ± 0.04% higher than in Lmnb1B2/B2 embryos (0.05 ± 0.01 g; p = 0.002) (Figure 7D and Supplemental Table S1). In addition, the pathology in the cerebral cortex of Lmnb1B2/B2Lmnb2B1/B1 embryos was less severe than in Lmnb1B2/B2 embryos (i.e., a higher neuronal density in the cerebral cortex of Lmnb1B2/B2Lmnb2B1/B1 embryos; Figure 7, E and F).
In the intercrosses of Lmnb1B2/+Lmnb2B1/+ mice, we never observed viable Lmnb1B2/B2Lmnb2B1/+ offspring, presumably because of low amounts of lamin B1 production (even lower than in Lmnb1B2/B2Lmnb2B1/B1 mice). In contrast, Lmnb1B2/+Lmnb2B1/B1 offspring were born at the expected Mendelian frequency and remained healthy and fertile during >1 yr of observation (Figure 8A). Brain specimens from these mice appeared normal, and microscopic analysis of the cerebral cortex revealed no abnormalities (Figure 8, B and D). The level of lamin B1 expression in Lmnb1B2/+Lmnb2B1/B1 mice was greater than half-normal (Figure 8C), reflecting lamin B1 production from two Lmnb2B1 alleles and one wild-type Lmnb1 allele. The level of lamin B2 expression in Lmnb1B2/+Lmnb2B1/B1 mice was half-normal, reflecting lamin B2 synthesis from a single Lmnb1B2 allele (Figure 8C).
FIGURE 8:
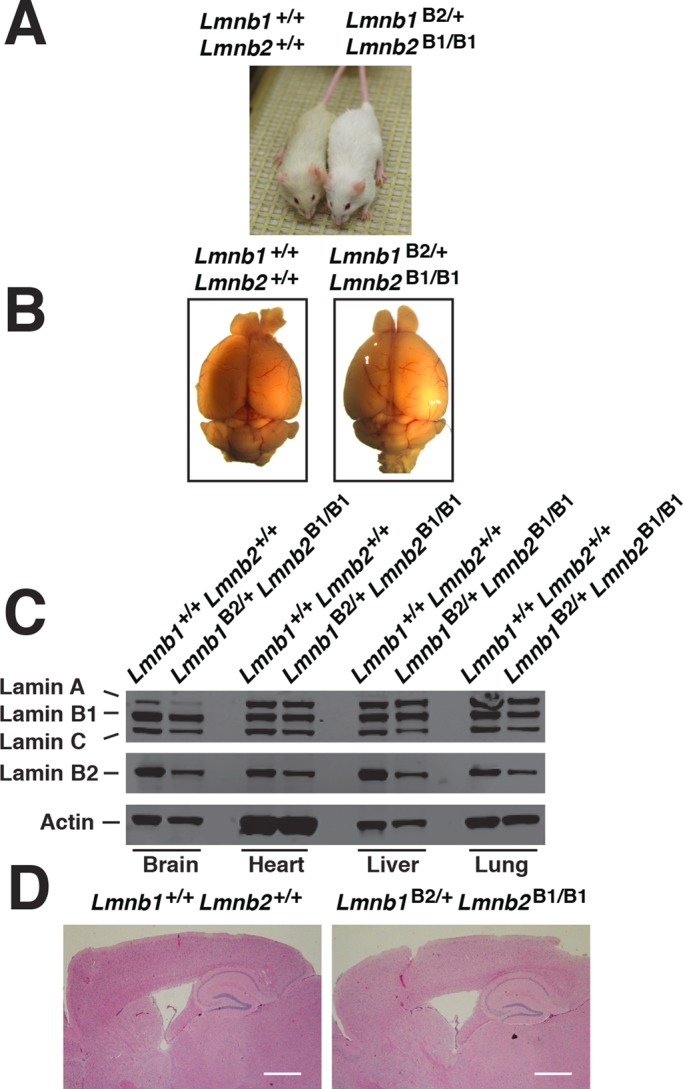
Characterization of Lmnb1B2/+Lmnb2B1/B1 mice. (A) Lmnb1B2/+Lmnb2B1/B1 and wild-type mice at 10 mo of age. (B) Mouse brains from the same mice at 10 mo of age. (C) Western blots of nuclear lamins in tissue extracts from adult Lmnb1B2/+Lmnb2B1/B1 and wild-type mice. (D) Hematoxylin and eosin–stained sagittal brain sections of adult mice. Scale bar, 1 mm.
DISCUSSION
Lamins B1 and B2 are ubiquitously expressed proteins with a high degree of sequence similarity (Worman et al., 2009; Davies et al., 2011; Burke and Stewart, 2013), and a deficiency of either protein leads to defective neuronal migration in the cerebral cortex (Coffinier et al., 2010, 2011; Young et al., 2012). These observations naturally elicit a simple question: Are lamins B1 and B2 functionally interchangeable? In the present study, we addressed this question by creating reciprocal knock-in mice (i.e., mice that produce lamin B1 from the Lmnb2 locus, and mice that produce lamin B2 from the Lmnb1 locus). Both knock-in mice died soon after birth with neuronal layering abnormalities in the cerebral cortex, demonstrating that increased production of one B-type lamin cannot prevent the developmental defects associated with loss of the other. However, we did find evidence that increased production of one protein led to partial amelioration of disease phenotypes. For example, the decrease in body weight and the neurodevelopmental defects in Lmnb1B2/B2 mice (which produced twofold to threefold more lamin B2 than wild-type mice) were milder than those in Lmnb1−/− mice, implying that the supplemental amounts of lamin B2 reduced the disease phenotypes associated with the deficiency of lamin B1. In the case of Lmnb2B1/B1 mice, the increase in lamin B1 expression was more modest, and the neurodevelopmental abnormalities were similar to those in Lmnb2−/− mice (Coffinier et al., 2010). However, the pathology in the cerebral cortex of Lmnb1B2/B2Lmnb2B1/B1 embryos was less severe than in Lmnb1B2/B2 embryos, implying that the modest amounts of lamin B1 from the Lmnb2B1 allele reduced the severity of the abnormalities elicited by homozygosity for the Lmnb1B2 allele.
The observation that neither B-type lamin prevents the neurodevelopmental abnormalities elicited by the loss of the other B-type lamin demonstrates that the two proteins play unique and important roles in brain development. With this lesson firmly established, one can, in hindsight, view earlier observations as being consistent with unique functions for the two proteins. For example, Coffinier et al. (2011) showed that deficiencies in lamins B1 and B2 yield distinct morphological abnormalities in cortical neurons. Lmnb2 deficiency resulted in markedly elongated nuclei but did not affect the distribution of lamin B1 along the nuclear rim, whereas Lmnb1 deficiency led to solitary nuclear blebs and a markedly asymmetric distribution of lamin B2 (with much of the lamin B2 localized to the nuclear bleb; Coffinier et al., 2011). The distinctive morphological abnormalities in the two knockout lines support distinct functions (and distinct protein–protein interactions) for the two B-type lamins in neurons. Another observation in favor of unique functions for the two proteins is the finding that the farnesyl lipid anchor is extremely important for lamin B1 function but dispensable for lamin B2 (Jung et al., 2013). Knock-in mice expressing a nonfarnesylated version of lamin B1 had neuronal migration defects and a unique nuclear abnormality in neurons (the nuclear lamina was pulled away from the bulk of the chromosomal DNA; Jung et al., 2013). In contrast, knock-in mice expressing a nonfarnesylated version of lamin B2 were healthy and free of pathology (Jung et al., 2013).
Lmnb1B2/B2Lmnb2B1/B1 mice exhibited neurodevelopmental abnormalities and died soon after birth. The amount of lamin B1 in the brain of these mice was only ∼16% of that in wild-type mice, and we suspect that the low amounts of lamin B1 expression in these mice were incompatible with normal brain development and survival. However, because all of the lamin B1 in Lmnb1B2/B2Lmnb2B1/B1 mice originated from the Lmnb2 locus, it is conceivable that subtle differences in lamin B1 expression patterns contributed to the developmental defects. In earlier studies, we showed that both Lmnb1 and Lmnb2 are expressed in migrating neurons, as judged by β-galactosidase staining (Coffinier et al., 2011). However, the intensity of β-galactosidase staining in the developing brain was much greater in E15.5 Lmnb1 knockout embryos than in E15.5 Lmnb2 knockout embryos; the differences in β-galactosidase staining intensity were particularly striking in the ventricular zone, where new neurons are born (Coffinier et al., 2011). In addition, it is conceivable that the absence of introns in the “knocked-in” sequences could perturb gene expression. Intron locations are conserved in vertebrate lamins (Lin and Worman, 1995), but whether introns influence expression patterns is not known. Earlier studies suggest that the sequences immediately upstream to Lmnb1’s translational start site may not be entirely responsible for regulating gene expression (Lin and Worman, 1997).
Lmnb1B2/+Lmnb2B1/B1 mice survived development and were healthy and fertile. The absence of pathology in these mice demonstrates that lamin B2 functions normally when it is produced under the control of Lmnb1 gene-regulatory elements. Thus any differences in the spatiotemporal expression pattern conferred by the Lmnb1 and Lmnb2 loci are not critical for lamin B2. In hindsight, the survival of Lmnb1B2/+Lmnb2B1/B1 mice was not particularly surprising because these mice produce at least half-normal amounts of both lamins B1 and B2. Earlier studies showed that Lmnb1+/−Lmnb2+/− mice, which produce half-normal amounts of both B-type lamins, survive development, are fertile, and are free of neurodevelopmental abnormalities (Kim et al., 2011; Coffinier and Young, unpublished data; present study).
The present studies with reciprocal knock-in mice demonstrate that lamins B1 and B2 have unique and vital roles in the developing brain. Increased lamin B1 production does not prevent the disease phenotypes elicited by the loss of lamin B2, and increased lamin B2 synthesis does not prevent the defects associated with lamin B1 deficiency. Our studies also suggest that the amount of lamin B1 expression in the developing brain matters. The ∼16%-normal levels of lamin B1 expression in Lmnb2B1/B1 and Lmnb1B2/B2Lmnb2B1/B1 mice were not sufficient to prevent reduced body weight and neurodevelopmental abnormalities. In contrast, half-normal levels of lamin B1 production in Lmnb1B2/+Lmnb2B1/B1 mice were quite sufficient to prevent neurodevelopmental defects.
MATERIALS AND METHODS
Mice expressing a lamin B2 cDNA from the Lmnb1 locus and mice expressing a lamin B1 cDNA from the Lmnb2 locus
We used homologous recombination to introduce a full-length Lmnb2 cDNA (beginning at the ATG translational start site) into the translational start site in exon 1 of Lmnb1 (thereby creating a new Lmnb1 allele, Lmnb1B2). We also introduced a Lmnb1 cDNA (beginning at the ATG translational start site) into the translational start site in exon 1 of the Lmnb2 gene (thereby creating a new Lmnb2 allele, Lmnb2B1). The Lmnb2 and Lmnb1 cDNAs were from IMAGE clones (IMAGE:5695459 and IMAGE:6816118, respectively). Each cDNA contained two neutral restriction site changes, making it possible to distinguish transcripts from the targeted allele from transcripts originating from the endogenous gene. For the Lmnb2 cDNA, a new EcoRV site was introduced by changing cytosine 168 to adenine with primer 5′-CTC CTC CTT CTC GGA TAT CCG GAG CAG CAA C-3′ (and a complementary primer); a SacI site was removed by changing guanine 852 to adenine with primer 5′-GGC CTC CTT GAG TTC CTC GCG GGC T-3′ (and a complementary primer). Neither change altered the lamin B2 amino acid sequence. For the Lmnb1 cDNA, a new BglII site was introduced into the lamin B1 cDNA by changing thymine 381 to adenine with primer 5′-GGG CTC CAC TGA GAT CTG ATT CCT TCT TGG CAT-3′ (and a complementary primer); a NotI site was removed by changing cytosine-219 to adenine with primer 5′-GTG AGC TCG CGT CCG CGC ACC TC-3′ (and a complementary primer). Neither change altered the lamin B1 amino acid sequence.
The gene-targeting vectors were generated by BAC recombineering. The Lmnb1 cDNA was introduced into BAC clone CH38-14G10 (containing Lmnb2), and the Lmnb2 cDNA was introduced into BAC clone CH38-24P17 (containing Lmnb1). The cDNAs were introduced in-frame at the translational start site (at an NcoI site). The remainder of the vector was constructed by recombineering with primers 5′-AAA CAT TGA CTT TAA CTG CAG AGA TGG CGC AAC GCA ATT AAT G-3′ and 5′-GGT CTG AGC TCG CCA TCA GTT CAG AGC GCG CCA AGC TCC AGA TCG AGC TGG GCA AGT TCA AGG CCG AGC ACG A-3′ (to introduce the loxP-Neo-loxP cassette into Lmnb1B2) and primers 5′-CAA ATA AAA CGC TGT TTT CCG ATA TCG AGA TGG CGC AAC GCA ATT AAT G-3′ and 5′-CGA GTG GTC ACC TCC TCC TTC TCG GAG ATC CGG AGC AGC AAC CTA TCA TTT GAA CTG ATG GCG AGC TCA GAC C-3′ (to introduce the loxP-Neo-loxP cassette into Lmnb2B1). Gap-repair primers 5′-TCT AGA CGT TTC TGT AAG GCG TCC AGG TGG CGT TTA ATT TCA GTC AAC AG-3′ and 5′-GGT CTG AGC TCG CCA TCA GTT CAG AGC GCG CCA AGC TCC AGA TCG AGC TGG GCA AGT TCA AGG CCG AGC ACG A-3′ were used for Lmnb1B2; gap-repair primers 5′-TGG GAG GCT AGC AGC CCC TTT TGT AGT TAG TCA GGG CAC ACC TGG CTG TT-3′ and 5′-GAC ACC ACC TGT CCA TGC AGG TGA CGG TGG CAA AGT CCA CTT TGG TTT CT-3′ were used for Lmnb2B1. The Lmnb1B2 vector contained a 4.9-kb 5′ arm followed by Lmnb2 coding sequences and 3′ UTR (replacing Lmnb1’s exon 1 starting at the ATG); the loxP-Neo-loxP selection cassette; a 3.1-kb 3′ arm; and a diphtheria toxin (DTA) cassette for negative selection. The Lmnb2B1 targeting vector contained a 5.2-kb 5′ recombination arm followed by Lmnb1 coding sequences and 3′ UTR (replacing Lmnb2’s exon 1 starting at the ATG); the loxP-Neo-loxP selection cassette; a 3.4-kb 3′ arm; and a DTA cassette for negative selection.
All intron–exon junctions in the targeting vector were verified by DNA sequencing. After linearization with I-SceI, the vectors were electroporated into E14Tg2A ES cells. After selection with G418 (125 μg/ml; Life Technologies, Invitrogen, Carlsbad, CA), ES cell colonies were picked and screened for recombination on the 5′ end by long-range PCR (2× Extensor Long Range PCR Master Mix; Thermo Scientific, Waltham, MA) using primers 5′-CAA CCT GCA GGC TTT CAT TAG CTC T-3′ and 5′-CCT CCT CAA ACA CAC TCT TGC TGA A-3′ for the Lmnb1B2 allele and primers 5′-AAT GCC CTA CCC ACT GCT CCT AAA T-3′ and 5′-GCT TGA GGA AGA TCG ACC ATG TCT T-3′ for the Lmnb2B1 allele. Targeted clones were then further analyzed by long-range PCR on the 3′ end using primers 5′-GTG GAG AGG CTA TTC GGC TAT GAC T-3′ and 5′-AGT CGA TCT CTG TCT GAG GCC AGT T-3′ for the Lmnb1B2 allele and primers 5′-GTG GAG AGG CTA TTC GGC TAT GAC T-3′ and 5′-AGG AAT CCT CTG CCT CCT GAG AGT T-3′ for the Lmnb2B1 allele. The products of the 5′ and 3′ long-range PCRs were further verified by restriction endonuclease digestion, taking advantage of the new restriction endonuclease sites in the targeted alleles.
Expression of lamin B2 from the Lmnb1B2 allele was verified by RT-PCR using primers 5′-AGA AGG AGG AGC TCC GTG A-3′ (from Lmnb2 exon 1 sequences after the ATG) and 5′-CAC CTC CGT CAT CTC CTG TT-3′ (from Lmnb2 exon 7 sequences). The resulting 950–base pair DNA fragment was cleaved by EcoRV into 100– and 850–base pair fragments. The DNA amplified from the wild-type allele was not cleaved because it did not contain the EcoRV site. Expression of lamin B1 from the Lmnb2B1 allele was verified by RT-PCR with primers 5′-GGC AAC CGA GGT GAT TCT C-3′ (from Lmnb2’s 5′ UTR) and 5′-GGT CTC ATG CTT CCT CCT TG-3′ (from Lmnb1 exon 4 sequences) for Lmnb2B1. The resulting 706–base pair product was cleaved by BglII into 296– and 410–base pair fragments. Full-length cDNAs from targeted ES cells were sequenced to verify that no additional mutations were introduced. After verifying that the ES cells were euploid, two independently targeted ES cell lines were injected into C57BL/6 blastocysts. Male chimeras were mated with C57Bl/6 females to generate heterozygous mice (Lmnb1B2/+ and Lmnb2B1/+).
Mice harboring Lmnb1B2 and Lmnb2B1 alleles were genotyped by PCR. The wild-type Lmnb2 allele was identified by amplifying a 396–base pair product with primers 5′-AGA AGG AGG AGC TCC GTG A-3′ and 5′-GGC TTC AGC GTT ATG CAT CT-3′; the Lmnb2B1 allele was identified by amplifying a 317–base pair product with 5′-GTC TGA GCT CGC CAT CAG TT-3′ and the same reverse primer. The wild-type Lmnb1 allele was identified by amplifying a 441–base pair product with primers 5′-TGC AGG AGA AAG AGG AGC TG-3′ and 5′-GGC ACC CCT GTT CAG TTC TA-3′; the Lmnb1B2 allele was identified by amplifying a 256–base pair product with primer 5′-GTC TGA GCT CGC CAT CAG TT-3′ and the same reverse primer.
All mice were fed a chow diet and housed in a virus-free barrier facility with a 12-h light/dark cycle. The UCLA Animal Research Committee approved all animal protocols.
Knockout mice
The Lmnb1-knockout mice (Lmnb1−/−) used in this study were generated by breeding mice homozygous for a Lmnb1 conditional knockout allele (Lmnb1fl/fl; Yang et al., 2011a) with mice harboring an Ella-Cre transgene (Bergo et al., 2002). The Cre-mediated recombination event deleted exon 2 of Lmnb1, resulting in a null allele. Unlike the Lmnb1-knockout mice described earlier (Vergnes et al., 2004), the Lmnb1−/− used here did not produce a Lmnb1–lacZ fusion protein.
Western blots
Mouse tissues were prepared as described (Dechat et al., 1998; Fong et al., 2004; Jung et al., 2012). Snap-frozen mouse tissues were pulverized with a chilled metal mortar and pestle, resuspended in ice-cold phosphate-buffered saline, and homogenized with a glass tissue grinder as previously described (Jung et al., 2013). The cell pellets were resuspended in urea buffer, sonicated, and centrifuged to remove cell debris. SDS–PAGE was performed on a 4–12% gradient polyacrylamide Bis-Tris gel, transferred to nitrocellulose membranes, and incubated with the following antibodies: a goat polyclonal antibody against lamin A/C (sc-6215; Santa Cruz Biotechnology, Santa Cruz, CA), a goat polyclonal antibody against lamin B1 (sc-6217; Santa Cruz Biotechnology), a mouse monoclonal antibody against lamin B2 (33-2100; Invitrogen), and a goat polyclonal antibody against actin (sc-1616; Santa Cruz Biotechnology). Binding of primary antibodies was assessed with infrared dye–conjugated secondary antibodies (Rockland Immunochemicals, Boyertown, PA) and quantified with an Odyssey infrared scanner (Li-Cor Biosciences, Lincoln, NE).
Quantitative RT-PCR
Snap-frozen mouse tissues were homogenized in TRI reagent (Molecular Research Center, Cincinnati, OH); total RNA was extracted and treated with DNase I (Life Technologies, Ambion). RNA was then reverse transcribed with random primers, oligo(dT), and SuperScript III (Invitrogen). Quantitative PCRs were performed on a 7900 Fast Real-Time PCR system (Life Technologies, Applied Biosystems) with SYBR Green PCR Master Mix (Bioline, Taunton, MA). Transcript levels were determined by the comparative cycle threshold method and normalized to levels of cyclophilin A.
Histology and immunofluorescence microscopy
Mouse tissues were fixed in 10% Formalin (Evergreen, Los Angeles, CA), embedded in paraffin, sectioned (5-μm thick), and stained with hematoxylin and eosin. For immunohistochemical staining, mouse tissues were embedded in Optimum Cutting Temperature compound (Sakura Finetek, Torrance, CA) and cut into 8-μm-thick sections using a cryostat. Sections were fixed in ice-cold methanol, rinsed with acetone, washed with 0.1% Tween-20 in Tris-buffered saline, and incubated with M.O.M. Mouse Ig Blocking Reagent (Vector Laboratories, Burlingame, CA). The following primary antibodies were used: a goat polyclonal antibody against lamin B1 (sc-6217; Santa Cruz Biotechnology), a mouse monoclonal antibody against lamin B2 (33-2100; Invitrogen), a rat monoclonal antibody against Ctip2 (ab18465; Abcam, Cambridge, MA), and a rabbit polyclonal antibody against CDP (sc-13024, Santa Cruz Biotechnology). Alexa Fluor–labeled donkey antibodies against goat, mouse, rat, or rabbit immunoglobulin G (Invitrogen) were used to detect binding of primary antibodies. DNA was stained with 4′,6-diamidino-2-phenylindole (DAPI).
Light microscopy images were obtained with a Leica MZ6 dissecting microscope (Plan 0.5× objective, air) or a Nikon Eclipse E600 microscope (Plan Fluor 2×/0.1 numerical aperture [NA] or 10×/0.2 NA objective, air) with a Digital Sight DS-Fi2 camera (Nikon, Tokyo, Japan). The images were captured with Leica Application Suite imaging software and NIS-Elements F4.00.00 (Nikon), respectively. Confocal fluorescence microscopy was performed with a Zeiss LSM700 laser-scanning microscope with a Plan Apochromat 20×/0.80 NA objective (air).
Statistical analyses
Statistical analyses were performed with Excel for Mac 2011 (Microsoft, Redmond, WA). Differences in expression levels of lamins B1 and B2 and differences in body weights and brain weights were analyzed by a two-tailed Student's t test. Chi-squared tests were performed with Excel for Mac 2011.
Supplementary Material
Acknowledgments
We thank Shao H. Yang and Richard H. Barnes II for technical assistance. This work was supported by National Institutes of Health Grants HL86683 (L.G.F.), HL089781 (L.G.F.), AG035626 (S.G.Y.), and 5T32HL007895-15 (J.M.L.).
Abbreviations used:
- CDS
coding DNA sequences
- DAPI
4’,6-diamidino-2-phenylindole
- DTA
diphtheria
- ES
embryonic stem
- LR-PCR
long-range PCR
- NA
numerical aperture
- RT-PCR
real-time PCR
- UTR
untranslated region
Footnotes
This article was published online ahead of print in MBoC in Press (http://www.molbiolcell.org/cgi/doi/10.1091/mbc.E14-01-0683) on March 26, 2014.
The authors declare that no conflict of interest exists.
REFERENCES
- Belmont AS, Zhai Y, Thilenius A. Lamin B distribution and association with peripheral chromatin revealed by optical sectioning and electron microscopy tomography. J Cell Biol. 1993;123:1671–1685. doi: 10.1083/jcb.123.6.1671. [DOI] [PMC free article] [PubMed] [Google Scholar]
- Bergo MO, et al. Zmpste24 deficiency in mice causes spontaneous bone fractures, muscle weakness, and a prelamin A processing defect. Proc Natl Acad Sci USA. 2002;99:13049–13054. doi: 10.1073/pnas.192460799. [DOI] [PMC free article] [PubMed] [Google Scholar]
- Biamonti G, et al. The gene for a novel human lamin maps at a highly transcribed locus of chromosome 19 which replicates at the onset of S-phase. Mol Cell Biol. 1992;12:3499–3506. doi: 10.1128/mcb.12.8.3499. [DOI] [PMC free article] [PubMed] [Google Scholar]
- Burke B, Stewart CL. The nuclear lamins: flexibility in function. Nat Rev. Mol Cell Biol. 2013;14:13–24. doi: 10.1038/nrm3488. [DOI] [PubMed] [Google Scholar]
- Coffinier C, Chang SY, Nobumori C, Tu Y, Farber EA, Toth JI, Fong LG, Young SG. Abnormal development of the cerebral cortex and cerebellum in the setting of lamin B2 deficiency. Proc Natl Acad Sci USA. 2010;107:5076–5081. doi: 10.1073/pnas.0908790107. [DOI] [PMC free article] [PubMed] [Google Scholar]
- Coffinier C, et al. Deficiencies in lamin B1 and lamin B2 cause neurodevelopmental defects and distinct nuclear shape abnormalities in neurons. Mol Biol Cell. 2011;22:4683–4693. doi: 10.1091/mbc.E11-06-0504. [DOI] [PMC free article] [PubMed] [Google Scholar]
- Davies B, Coffinier C, Yang S, Jung H, Fong L, Young S. Posttranslational processing of nuclear lamins. In: Tamanoi F, Hrycyna CA, Bergo MO, editors. The Enzymes. Amsterdam: Elsevier; 2011. pp. 21–41. [Google Scholar]
- Dechat T, Gotzmann J, Stockinger A, Harris CA, Talle MA, Siekierka JJ, Foisner R. Detergent-salt resistance of LAP2alpha in interphase nuclei and phosphorylation-dependent association with chromosomes early in nuclear assembly implies functions in nuclear structure dynamics. EMBO J. 1998;17:4887–4902. doi: 10.1093/emboj/17.16.4887. [DOI] [PMC free article] [PubMed] [Google Scholar]
- Fong LG, et al. Heterozygosity for Lmna deficiency eliminates the progeria-like phenotypes in Zmpste24-deficient mice. Proc Natl Acad Sci USA. 2004;101:18111–18116. doi: 10.1073/pnas.0408558102. [DOI] [PMC free article] [PubMed] [Google Scholar]
- Geng Y, Whoriskey W, Park MY, Bronson RT, Medema RH, Li T, Weinberg RA, Sicinski P. Rescue of cyclin D1 deficiency by knockin cyclin E. Cell. 1999;97:767–777. doi: 10.1016/s0092-8674(00)80788-6. [DOI] [PubMed] [Google Scholar]
- Gerace L, Comeau C, Benson M. Organization and modulation of nuclear lamina structure. J Cell Sci. 1984;(Suppl 1):, 137–160. doi: 10.1242/jcs.1984.supplement_1.10. [DOI] [PubMed] [Google Scholar]
- Harborth J, Elbashir SM, Bechert K, Tuschl T, Weber K. Identification of essential genes in cultured mammalian cells using small interfering RNAs. J Cell Sci. 2001;114:4557–4565. doi: 10.1242/jcs.114.24.4557. [DOI] [PubMed] [Google Scholar]
- Jung HJ, et al. Regulation of prelamin A but not lamin C by miR-9, a brain-specific microRNA. Proc Natl Acad Sci USA. 2012;109:E423–E431. doi: 10.1073/pnas.1111780109. [DOI] [PMC free article] [PubMed] [Google Scholar]
- Jung HJ, et al. Farnesylation of lamin B1 is important for retention of nuclear chromatin during neuronal migration. Proc Natl Acad Sci USA. 2013;110:E1923–E1932. doi: 10.1073/pnas.1303916110. [DOI] [PMC free article] [PubMed] [Google Scholar]
- Kim Y, Sharov AA, McDole K, Cheng M, Hao H, Fan CM, Gaiano N, Ko MS, Zheng Y. Mouse B-type lamins are required for proper organogenesis but not by embryonic stem cells. Science. 2011;334:1706–1710. doi: 10.1126/science.1211222. [DOI] [PMC free article] [PubMed] [Google Scholar]
- Lin F, Worman HJ. Structural organization of the human gene encoding nuclear lamin A and nuclear lamin C. J Biol Chem. 1993;268:16321–16326. [PubMed] [Google Scholar]
- Lin F, Worman HJ. Structural organization of the human gene (Lmnb1) encoding nuclear lamin B1. Genomics. 1995;27:230–236. doi: 10.1006/geno.1995.1036. [DOI] [PubMed] [Google Scholar]
- Lin F, Worman HJ. Expression of nuclear lamins in human tissues and cancer cell lines and transcription from the promotors of the lamin A/C and B1 genes. Exp Cell Res. 1997;236:378–384. doi: 10.1006/excr.1997.3735. [DOI] [PubMed] [Google Scholar]
- Maeno H, Sugimoto K, Nakajima N. Genomic structure of the mouse gene (Lmnb1) encoding nuclear lamin B1. Genomics. 1995;30:342–346. doi: 10.1006/geno.1995.9868. [DOI] [PubMed] [Google Scholar]
- Malhas A, Lee CF, Sanders R, Saunders NJ, Vaux DJ. Defects in lamin B1 expression or processing affect interphase chromosome position and gene expression. J Cell Biol. 2007;176:593–603. doi: 10.1083/jcb.200607054. [DOI] [PMC free article] [PubMed] [Google Scholar]
- Malhas AN, Lee CF, Vaux DJ. Lamin B1 controls oxidative stress responses via Oct-1. J Cell Biol. 2009;184:45–55. doi: 10.1083/jcb.200804155. [DOI] [PMC free article] [PubMed] [Google Scholar]
- Malhas A, Saunders NJ, Vaux DJ. The nuclear envelope can control gene expression and cell cycle progression via miRNA regulation. Cell Cycle. 2010;9:531–539. doi: 10.4161/cc.9.3.10511. [DOI] [PubMed] [Google Scholar]
- Martin C, Chen S, Maya-Mendoza A, Lovric J, Sims PF, Jackson DA. Lamin B1 maintains the functional plasticity of nucleoli. J Cell Sci. 2009;122:1551–1562. doi: 10.1242/jcs.046284. [DOI] [PMC free article] [PubMed] [Google Scholar]
- Moir RD, Montag-Lowy M, Goldman RD. Dynamic properties of nuclear lamins: lamin B is associated with sites of DNA replication. J Cell Biol. 1994;125:1201–1212. doi: 10.1083/jcb.125.6.1201. [DOI] [PMC free article] [PubMed] [Google Scholar]
- Rober RA, Weber K, Osborn M. Differential timing of nuclear lamin A/C expression in the various organs of the mouse embryo and the young animal: a developmental study. Development. 1989;105:365–378. doi: 10.1242/dev.105.2.365. [DOI] [PubMed] [Google Scholar]
- Schweda F, Kurtz L, de Wit C, Janssen-Bienhold U, Kurtz A, Wagner C. Substitution of connexin40 with connexin45 prevents hyperreninemia and attenuates hypertension. Kidney Int. 2009;75:482–489. doi: 10.1038/ki.2008.637. [DOI] [PubMed] [Google Scholar]
- Shimi T, et al. The A- and B-type nuclear lamin networks: microdomains involved in chromatin organization and transcription. Genes Dev. 2008;22:3409–3421. doi: 10.1101/gad.1735208. [DOI] [PMC free article] [PubMed] [Google Scholar]
- Sullivan T, Escalante-Alcalde D, Bhatt H, Anver M, Bhat N, Nagashima K, Stewart CL, Burke B. Loss of A-type lamin expression compromises nuclear envelope integrity leading to muscular dystrophy. J Cell Biol. 1999;147:913–919. doi: 10.1083/jcb.147.5.913. [DOI] [PMC free article] [PubMed] [Google Scholar]
- Tang CW, Maya-Mendoza A, Martin C, Zeng K, Chen S, Feret D, Wilson SA, Jackson DA. The integrity of a lamin-B1-dependent nucleoskeleton is a fundamental determinant of RNA synthesis in human cells. J Cell Sci. 2008;121:1014–1024. doi: 10.1242/jcs.020982. [DOI] [PubMed] [Google Scholar]
- Tsai MY, Wang S, Heidinger JM, Shumaker DK, Adam SA, Goldman RD, Zheng Y. A mitotic lamin B matrix induced by RanGTP required for spindle assembly. Science. 2006;311:1887–1893. doi: 10.1126/science.1122771. [DOI] [PubMed] [Google Scholar]
- Vergnes L, Peterfy M, Bergo MO, Young SG, Reue K. Lamin B1 is required for mouse development and nuclear integrity. Proc Natl Acad Sci USA. 2004;101:10428–10433. doi: 10.1073/pnas.0401424101. [DOI] [PMC free article] [PubMed] [Google Scholar]
- Wang Y, Schnegelsberg PN, Dausman J, Jaenisch R. Functional redundancy of the muscle-specific transcription factors Myf5 and myogenin. Nature. 1996;379:823–825. doi: 10.1038/379823a0. [DOI] [PubMed] [Google Scholar]
- Worman HJ, Fong LG, Muchir A, Young SG. Laminopathies and the long strange trip from basic cell biology to therapy. J Clin Invest. 2009;119:1825–1836. doi: 10.1172/JCI37679. [DOI] [PMC free article] [PubMed] [Google Scholar]
- Yang SH, Chang SY, Yin L, Tu Y, Hu Y, Yoshinaga Y, de Jong PJ, Fong LG, Young SG. An absence of both lamin B1 and lamin B2 in keratinocytes has no effect on cell proliferation or the development of skin and hair. Hum Mol Genet. 2011a;20:3537–3544. doi: 10.1093/hmg/ddr266. [DOI] [PMC free article] [PubMed] [Google Scholar]
- Yang SH, Jung HJ, Coffinier C, Fong LG, Young SG. Are B-type lamins essential in all mammalian cells. Nucleus. 2011b;2:562–569. doi: 10.4161/nucl.2.6.18085. [DOI] [PMC free article] [PubMed] [Google Scholar]
- Young SG, Jung HJ, Coffinier C, Fong LG. Understanding the roles of nuclear A- and B-type lamins in brain development. J Biol Chem. 2012;287:16103–16110. doi: 10.1074/jbc.R112.354407. [DOI] [PMC free article] [PubMed] [Google Scholar]
- Zewe M, Höger TH, Fink T, Lichter P, Krohne G, Franke WW. Gene structure and chromosomal localization of the murine lamin B2 gene. Eur J Cell Biol. 1991;56:342–350. [PubMed] [Google Scholar]
Associated Data
This section collects any data citations, data availability statements, or supplementary materials included in this article.