

Abstract
Microsatellite stable (MSS), CpG island methylator phenotype (CIMP)-negative colorectal tumors, the most prevalent molecular subtype of colorectal cancer, are associated with extensive copy number alteration (CNA) events and aneuploidy. We report on the identification of characteristic recurrent CNA (with frequency >25%) events and associated gene expression profiles for a total of 40 paired tumor and adjacent normal colon tissues using genome-wide microarrays. We observed recurrent CNAs, namely gains at 1q, 7p, 7q, 8p12-11, 8q, 12p13, 13q, 20p, 20q, Xp, and Xq and losses at 1p36, 1p31, 1p21, 4p15-12, 4q12-35, 5q21-22, 6q26, 8p, 14q, 15q11-12, 17p, 18p, 18q, 21q21-22, and 22q. Within these genomic regions we identified 356 genes with significant differential expression (P<0.0001 and ±1.5 fold change) in the tumor compared to adjacent normal tissue. Gene ontology and pathway analyses indicated that many of these genes were involved in functional mechanisms that regulate cell cycle, cell death, and metabolism. An amplicon present in >70% of the tumor samples at 20q11-20q13 contained several cancer-related genes (AHCY, POFUT1, RPN2, TH1L and PRPF6) that were up-regulated and demonstrated a significant linear correlation (P<0.05) for gene dosage and gene expression. Copy number loss at 8p, a CNA associated with adenocarcinoma and poor prognosis, was observed in >50% of the tumor samples and demonstrated a significant linear correlation for gene dosage and gene expression for two potential tumor suppressor genes, MTUS1 (8p22) and PPP2CB (8p12). The results from our integration analysis illustrate the complex relationship between genomic alterations and gene expression in colon cancer.
Introduction
Colorectal cancer is the second most common cause of cancer deaths in the United States (Jemal et al., 2008). Most colorectal cancers begin as an adenomatous polyp, progressing to an advanced adenoma, then to invasive cancer. Along with the phenotypic progression during the development of colorectal cancer, there are associated genomic alterations that drive the multistep process towards invasive disease (Ried et al., 1996; Meijer et al., 1998; Carvalho et al., 2009). Genomic instability, such as copy number alterations (CNA), occurs in most cancers, but frequency and location of CNAs differ across cancer types. Copy number alterations can occur as distinct focal events or involve larger chromosomal regions, sometimes involving entire chromosomes or chromosomal arms, often leading to aneuploidy for some advanced cancers. Characteristic patterns of CNAs have been identified for different tumors and their subtypes. For colorectal cancer, several studies have identified common CNA events such as copy number gains on 7p, 8q, 13q, 20q, and X and losses on chromosome 1p, 4, 5q, 8p, 14q, 15q, and 18 (Tsafrir et al., 2006; Camps et al., 2009; Sheffer et al., 2009; The-Cancer-Genome-Atlas-Network, 2012).
Colorectal cancers are subdivided into two major molecular subtypes, microsatellite unstable (MSI) and microsatellite stable (MSS). MSI tumors are DNA mutation mismatch repair (MMR)-deficient as the result of an inherited mutation in one of the MMR genes (Lynch Syndrome) or due to promoter DNA methylation of the MMR gene MLH1 (Cunningham et al., 1998; Thibodeau et al., 1998). Approximately 15% of sporadic colorectal tumors are characterized as MSI tumors. In contrast, approximately 85% of colorectal tumors are MSS. These tumors are MMR-proficient and are generally associated with poorer prognosis and have more extensive genomic alterations, such as chromosomal rearrangements and aneuploidy, compared to MSI tumors (Popat et al., 2005; Rowan et al., 2005). In recent analyses contrasting CNAs in MSI and MSS colorectal tumors, it was demonstrated that there are both distinct and shared recurrent CNAs associated with each subtype (Camps et al., 2006; Jorissen et al., 2008; Dyrso et al., 2011). In addition, studies have demonstrated that MSI and MSS tumors can be distinguished by gene expression profiles (Kim et al., 2004; Reid et al., 2009).
Several recent reports have addressed the relationship between CNAs and gene expression in various cancers (Tsafrir et al., 2006; Camps et al., 2009; Andrews et al., 2010; Horlings et al., 2010). These studies are based on the premise that events leading to genomic alterations result in changes in gene copy number that directly impact normal gene expression patterns. One example of this relationship is observed in HER2-overexpressing breast and gastric cancers, where focal copy number gain at 17q21 is associated with increased expression of the ERBB2 gene (Slamon et al., 1987; Slamon et al., 1989; Tiwari et al., 1992; Press et al., 2002; Staaf et al., 2010). Many solid tumors have larger regional CNAs, sometimes involving entire chromosomal arms, with the potential to affect expression levels for thousands of genes. Copy number gain of chromosome arm 20q in MSS colorectal cancers has been associated with the overexpression of multiple genes in this chromosomal arm, but not all genes on 20q were found to be overexpressed, demonstrating the complex mechanisms that regulate transcription of individual genes (Grade et al., 2006; Tsafrir et al., 2006; Carvalho et al., 2009).
In the present study, we leveraged the availability of high-resolution microarray platforms to generate detailed profiles of both CNA and gene expression for MSS colon tumors, and integrated both datasets to identify genomic alterations associated with concomitant changes in gene expression. We focused on the genes located in genomic regions that were commonly altered in the MSS and CIMP-negative colon tumors and found that many of these genes were involved in cellular functions, such as cell cycle regulation, DNA replication and repair, cellular metabolic processes, and molecular transport. Specifically, we found that several genes involved in the Wnt-signaling pathway were located in genomic regions of recurrent alterations and were correspondingly differentially-expressed in the set of MSS and CIMP-negative colon tumors, as compared to paired adjacent normal tissue. Our results provide a link between genomic alteration events and the disruption of gene expression for genes that are involved in key cellular mechanisms leading to colon cancer.
Materials and Methods
Study Subjects and Tissue Samples
As described in Loo et al. (Loo et al., 2012), forty fresh-frozen colon adenocarcinomas and paired adjacent normal tissue were collected from colon cancer patients at three participating centers of the Colorectal Cancer Family Registry (Newcomb et al., 2007) (Mayo Clinic, Mount Sinai Hospital, and Cleveland Clinic). Tumors were tested for microsatellite instability (MSI) (Thibodeau et al., 1998) and CpG island methylator phenotype (CIMP) (Weisenberger et al., 2006). The study received IRB approval from all participating institutions. All participants included in this study signed an informed written consent.
DNA and RNA Isolation
All tumor samples were sectioned and stained with hematoxylin and eosin, then reviewed by a pathologist to determine tumor cell content. Tumor tissue samples used for the study had >70% tumor cell content. Genomic DNA and total RNA were extracted from the tissue samples using the AllPrep DNA/RNA Mini kit (QIAGEN, Valencia, CA) following manufacturer's recommendations. Isolated DNA and RNA quality were determined by gel electrophoresis and Bioanalyzer analysis (Agilent; Foster City, CA), respectively.
Microarray Analysis
Gene expression profiles for colon tumors and normal-appearing adjacent tissue were determined using the Affymetrix GeneChip Human Exon 1.0 ST Arrays (Affymetrix Santa Clara, CA); GEO Accession number GSE31737. To minimize background noise and to increase mRNA detection sensitivity and specificity, ribosomal RNA (rRNA) was removed from total RNA using the RiboMinus Human/Mouse Transcriptome Isolation Kit (Invitrogen Carlsbad, CA). Following rRNA reduction, the Affymetrix GeneChip Whole Transcript (WT) Sense Target Labeling Assay was used to generate amplified and biotinylated sense-strand DNA targets for hybridization on GeneChip Human Exon 1.0 ST Arrays following the manufacturer's recommendations. Technical validation of gene expression using quantitative PCR was described in (Loo et al., 2012). For copy number and loss of heterozygosity (LOH) analysis, genomic DNA was processed and applied to the Affymetrix Genome-wide Human SNP 6.0 Array according to the manufacturer's recommendations. All arrays were scanned on The GeneChip® Scanner 3000 7G using the Affymetrix GeneChip Command Console (AGCC) Software to measure the fluorescent signal intensities at each probe location. The average call rate for the 80 samples based on the SNP 6.0 analysis was 99.6%.
Statistical Analysis
Data analysis was conducted using the Partek Genomics Suite 6.5 software (Partek Inc., St. Louis, MO). For copy number analysis, paired normal and tumor samples from the same individual were used to identify genomic regions of copy number gain or loss. The genomic segmentation algorithm was applied to detect copy number alterations (Olshen et al., 2004). Default settings were used for CNA and allelic imbalance detection analysis, with a minimum of 10 genomic markers for one segment and a P-value threshold=0.001 for two neighboring regions having significantly different means. Gain and loss events were identified by segmental copy number >2.5 and <1.5, for gain and loss respectively, assuming a copy number of 2 is diploid (Olshen et al., 2004). For gene expression analysis, genome-wide gene expression values were log2-transformed and normalized using Robust Multi-array Analysis (RMA), and using median polish summarization (Irizarry et al., 2003). The transcript expression value for each gene was based on the mean of the probe set intensities for that gene. To identify genes associated with differential expression between paired normal and tumor tissue samples, a multivariate analysis of covariance (ANCOVA) was conducted, adjusting for tumor stage and assay batch. Genes were considered as being significantly differentially expressed at a false discovery rate (FDR) (Benjamini and Hochber, 1995) adjusted P-value < 0.0001 and > ±1.5 fold-change. Correlation analysis of CNA events and gene expression was restricted to genomic regions with CNA frequency ≥25% and the differentially expressed genes were identified in ANCOVA analysis.
Reverse Transcriptase Quantitative PCR
For the technical validation of gene expression levels generated in the microarray expression profiling assays, we used quantitative Reverse Transcriptase PCR qRT-PCR to measure gene expression levels for 6 genes (AHCY, APC, DCC, DSC2, MACC1, and MYC). These genes were chosen because they were differentially expressed between CRC and normal tissue based on past studies (Kinzler and Vogelstein 1996; Khan, et al. 2006; Cardoso, et al. 2007; Duffy, et al. 2007; Cunningham, et al. 2010). Briefly, qRT-PCR gene expression profiles were completed on 20 tumor-normal pairs used in the microarray assays. cDNA was prepared from up to 2 ug of untreated total RNA using High Capacity cDNA Reverse Transcription Kit (Applied Biosystems Foster City, CA). Quantitative PCR was conducted for the six genes using TaqMan gene expression assays and the TaqMan Universal PCR Mastermix with the recommended thermal profiles on the 7900HT Fast Real-Time PCR System (Applied Biosystems Foster City, CA). The qRT-PCR results for both up- (AHCY, MACC1, and MYC) and down- (APC, DCC, and DSC2) regulated genes demonstrated good correlation (all Spearman's Rank Order correlations>0.5) with the microarray gene expression results.
Results
Differential Gene Expression in MSS Colon Tumors
We conducted a genome-wide expression analysis using the Affymetrix GeneChip Human Exon 1.0 ST Array to identify differentially expressed genes for 40 paired MSS, CIMP-negative colon tumors and adjacent normal tissue samples. The analysis was performed at the summarized core gene-level, utilizing the average exon expression level for each gene. In total, 18,403 independent genes were analyzed in this study. To generate a gene list of significantly differentially expressed genes between adjacent normal and tumor tissue, we considered only genes that had an adjusted P-value < 0.0001 (2,712 genes) and a > ±1.5 fold-change (2,049 genes). The intersection of the gene list that met these two criteria resulted in 1,573 individual genes (877 genes up- and 696 genes down-regulated) that were differentially expressed between tumors and their paired adjacent normal tissue (Supplemental Table 1).
First, we focused on the genes with the most dramatic fold-change differences in gene expression in tumor tissue compared to adjacent normal tissue. Among the top 10 up- and 10 down-regulated genes whose expression was dramatically different in tumor vs. adjacent normal tissue (Table 1), we identified a tight junction protein, claudin 1 (CLDN1) (Table 1; Figure 1), with an 11.2-fold up-regulation inthe gene expression level for tumor compared to normal adjacent tissue. Overexpression of CLDN1 has been observed in both adenoma and adenocarcinoma tissues and speculated to have a role in reducing E-cadherin expression and overall cell morphology and behavior for colorectal cancer (Huo et al., 2009; Singh et al., 2011). KIAA1199 was also markedly up-regulated (9-fold) in tumor compared to normal adjacent tissue (Table 1; Figure 1), and has been shown to affect the expression of genes involved the Wnt-signaling pathway and cellular proliferation (Birkenkamp-Demtroder et al., 2011). KIAA1199 was recently identified as an RNA biomarker in plasma from patients with colorectal adenomas and adenocarcinomas compared to controls (LaPointe et al., 2012). ETV4, ets variant 4 gene, was also upregulated, with levels 7.5-fold higher in tumor compared to adjacent normal tissue (Table 1; Figure 1). ETV4, a transcription factor functioning downstream of the Ras-ERK signaling pathway, has previously been found to be overexpressed in multiple cancer types, including colorectal cancer, and associated with metastasis and poor prognosis (Moss et al., 2006; Keld et al., 2011). ETV4 has been shown to have a role in regulating the expression of the cytokine, interleukin-8 (IL8) in breast tumors (Chen et al., 2011). IL8 was also observed as one of the top 10 genes to be differentially expressed in our colon tumor tissue samples (Table 1; Figure 1), suggesting that the up-regulation of ETV4 may mediate transcriptional up-regulation of IL8 in colon cancer, as reported in breast cancers (Chen et al., 2011). Of the top ten most dramatically down-regulated genes for our tumor samples, two of the genes, CLCA4 and CLCA1 (Table 1; Figure 1) belong to the calcium sensitive chloride conductance protein family. The CLCA family members share a high degree of homology but differ significantly in their tissue distribution, with both CLCA4 and CLCA1 endogenously expressed in the gastrointestinal tract (Bustin et al., 2001; Comelli et al., 2009). Since dramatic down-regulation of endogenous expression for both CLCA4 and CLCA1 is observed in our colon tumor samples, these highly homologous chloride channel proteins may function as tumor suppressors in colon cancer, as has been shown for the proposed TP53-induced tumor suppressor, CLCA2, in breast cancer (Gruber and Pauli, 1999; Walia et al., 2009).
Table 1. Top 10 Genes with Dramatic Fold-Change in Expression in Colon Tumor versus Adjacent Normal Tissue.
| Top 10 Up-Regulated Genes in Tumor versus Adjacent Normal Tissue | |||||
|---|---|---|---|---|---|
|
| |||||
| Cytogenetic Location | RefSeq | Gene Symbol | Gene | Fold-Change | p-value |
| 3q28-q29 | NM_021101 | CLDN1 | claudin 1 | 11.20 | 1.27E-18 |
| 15q25.1 | NM_018689 | KIAA1199 | KIAA1199 | 9.00 | 4.20E-15 |
| 16q24.3 | NM_004413 | DPEP1 | dipeptidase 1 (renal) | 8.17 | 1.22E-14 |
| 17q21.31 | NM_001986 | ETV4 | ets variant 4 | 7.49 | 8.16E-19 |
| 11q22.2 | NM_002422 | MMP3 | matrix metallopeptidase 3 (stromelysin 1, progelatinase) | 7.15 | 1.12E-08 |
| 7q22.1 | NM_001185 | AZGP1 | alpha-2-glycoprotein 1, zinc-binding | 5.68 | 2.90E-10 |
| 4q13-q21 | NM_000584 | IL8 | interleukin 8 | 5.50 | 3.02E-08 |
| 4q21-q25 | NM_001040058 | SPP1 | secreted phosphoprotein 1 | 5.43 | 1.32E-08 |
| 3p25.1 | NM_003043 | SLC6A6 | solute carrier family 6 (neurotransmitter transporter, taurine), member 6 | 5.37 | 2.16E-15 |
| 10q24.31 | NM_005063 | SCD | stearoyl-CoA desaturase (delta-9-desaturase) | 5.25 | 6.11E-13 |
| Top 10 Down-Regulated Genes in Tumor versus Adjacent Normal Tissue | |||||
|---|---|---|---|---|---|
|
| |||||
| Cytogenetic Location | RefSeq | Gene Symbol | Gene | Fold-Change | p-value |
| 1p31-p22 | NM_012128 | CLCA4 | chloride channel regulator 4 | -14.51 | 1.89E-09 |
| 16p13.3 | NM_152338 | JCLN | jacalin-like lectin domain containing | -13.71 | 1.21E-09 |
| 16p12.1 | NM_001169 | AQP8 | aquaporin 8 | -12.19 | 1.56E-12 |
| 17q11.2 | NM_206832 | TMIGD1 | transmembrane and immunoglobulin domain containing 1 | -11.31 | 9.44E-12 |
| 11q12.2 | NM_017716 | MS4A12 | membrane-spanning 4-domains, subfamily A, member 12 | -11.22 | 1.75E-09 |
| 1p22.3 | NM_001285 | CLCA1 | chloride channel regulator 1 | -9.95 | 7.43E-07 |
| 4q23 | NM_000669 | ADH1C | alcohol dehydrogenase 1C (class I), gamma polypeptide | -9.65 | 1.73E-10 |
| 16q13 | NM_176870 | MT1M | metallothionein 1M | -9.55 | 1.59E-11 |
| 8q22 | NM_000067 | CA2 | carbonic anhydrase II | -9.48 | 9.56E-11 |
| 8q13-q22.1 | NM_001128829 | CA1 | carbonic anhydrase I | -9.27 | 1.14E-11 |
Figure 1. Dot plots of genes with dramatic fold-change (>5 fold) expression differences in colon tumor versus adjacent normal tissue.
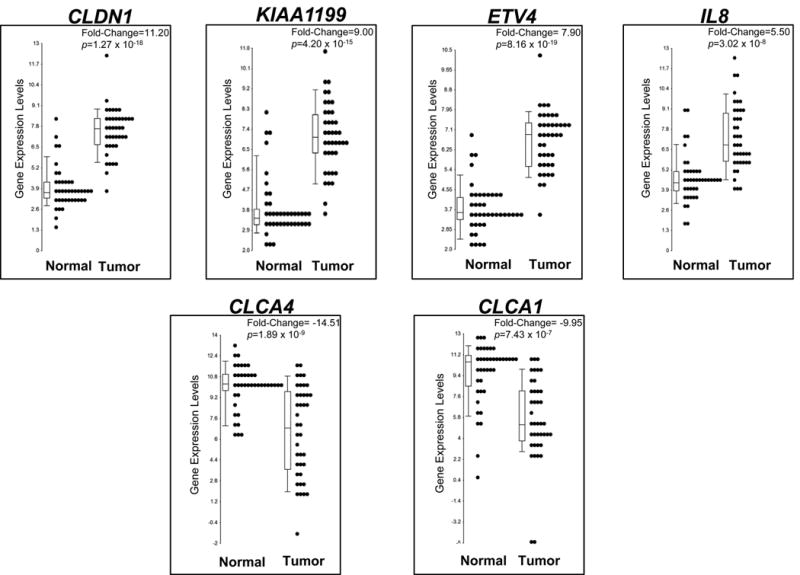
Dot plots of genes among the top 10 up- and 10 down-regulated genes with the most dramatic fold-change difference (FC>±5) in tumor vs. adjacent normal tissue. Each dot represents the expression levels of one adjacent normal or tumor tissue sample for the indicated gene, with median expression levels indicated in the box plot. The fold-change and p-value are indicated, representing the significant difference in expression levels of the gene in tumor versus adjacent normal tissue.
To identify functional networks that are significantly impacted by the observed gene expression difference, the overall biological context of the 1,573 differentially expressed genes was examined using Ingenuity Pathway Analysis (IPA) and Gene Ontology (GO) enrichment analysis. (Table 2, 2nd column). IPA analysis indicated that the 1,573 gene list is enriched for genes having a role in cancer and gastrointestinal disease. IPA also indicated that the top molecular and cellular functions were “Cell Growth and Proliferation” and “Cell Cycle”, with the top network generated from this gene list being “DNA Replication, Recombination, and Repair; RNA Post-Transcriptional Modification; Cell Cycle”. These data suggest that our gene list of differentially expressed genes in the tumor tissue is enriched for genes functioning to regulate cell cycle and DNA repair. The GO analysis complemented the functional classifications of IPA and indicated a strong enrichment for genes with a role in cellular proliferation and catalytic activities. The IPA Upstream Regulator analysis tool was also applied to the gene list to characterize gene expression patterns that are mediated by a common upstream regulator (transcription factor, microRNA, kinase, or a compound). The top upstream regulators based on our gene list were TP53, E2F, MYC, RB (Supplemental Table 2). For example, 186 genes were identified as TP53 targets with gene expression profiles consistent with an inhibition of normal of TP53 function.
Table 2. Functional Classification of Differentially Expressed Genes in Colon Tumor versus Adjacent Normal Tissue.
| Differentially Expressed Genes in Tumor vs. Normal Colon Tissue (n=1573 genes) | Differentially Expressed Genes Located in Regions of Recurrent CNA (n=356 genes) | Differentially Expressed Genes Located in Regions of Recurrent CNAs in Adenomas* (n=248 genes) | Differentially Expressed Genes Located in Regions of Recurrent CNAs in Caricinomas** (n=108 genes) | |
|---|---|---|---|---|
|
| ||||
| Ingenuity Pathway Analysis | ||||
|
| ||||
| disease and disorder | Cancer | Cancer | Cancer | Developmental Disorder |
| disease and disorder | Gastrointestinal Disease | Gastrointestinal Disease | Gastrointestinal Disease | Genetic Disorder |
|
| ||||
| molecular and cellular functions | Cellular Growth and Proliferation | Cell Cycle | Cell Cycle | Cell Cycle |
| molecular and cellular functions | Cell Cycle | Cell Death | Cell Death | Cell-to-Cell Signaling and Interaction |
|
| ||||
| networks | DNA Replication Recombination, and Repair; RNA Post-Transcriptional Modification; Cell Cycle | DNA Replication, Recombination, and Repair; Cell Cycle; Gene Expression | Cell Cycle; Gene Expression; Amino Acid Metabolism | Cell-To-Cell Signaling and Interaction; Connective Tissue Dev and Func; Cardiovasular System Development and Function |
| networks | Cell Cycle; Cellular Assembly and Organization; DNA Replication, Recombination, and Repair | Molecular Transport; Small Molecule Biochemistry; Genetic Disorder | Cell Cycle; Cancer; DNA Replication, Recombination, and Repair | Cell Cycle; DNA Replication, Recombination, and Repair; Reproductive System Disease |
|
| ||||
| Gene Ontology Enrichment Analysis*** | ||||
|
| ||||
| biological processes | cellular process (ES=41) | cellular process (ES=29.8) | cellular process and growth functions (ES=23.9) | cellular process (ES=8.2) |
| cell proliferation (ES=18) | metabolic process (ES=8.3) | growth (ES=7.4) | metabolic process (ES=6.8) | |
| developmental process (ES=11) | cell proliferation (ES=6.8) | cellular proliferation (ES=6.9) | ||
| metabolic process (ES=9.2) | growth (ES=5.3) | metabololic process (ES=4.26) | ||
| biological adhesion (ES=8.5) | rhythmic process (ES=3.5) | rhythmic process (ES=3.1) | ||
| growth (ES=6.3) | ||||
| rhythmic process (ES=3.6) | ||||
|
| ||||
| molecular functions | catalytic activity (ES=41.6) | catalytic activity (ES=19.6) | catalytic activity and binding (ES=11.0) | catalytic activity (ES=10.7) |
| binding (ES=22.4) | binding (ES=11.4) | binding (ES=10.9) | ||
| antioxidant activity (ES=4.1) | translation regulatory activity (ES=3.3) | |||
| translation regulator activity (ES=3.0) | ||||
|
| ||||
| cellular components | extracellular region part (ES=26) | cell part (ES=6.0) | cell part (ES=11.8) | |
| extracellular region (ES=14) | ||||
| cell part (ES=4.8) | ||||
Genomic regions with frequent copy number alterations associated with adenomas.
Genomic regions with frequent copy number alteraions that were not observed in adenomas, but observed in carcinomas.
The Enrichment Score (ES) reflects the degree to which the set of differentially expressed genes is enriched for the ontologic term or phenotype.
Identification of genome-wide copy number alterations and allelic imbalance in MSS colon cancer
A high-resolution genome-wide analysis was conducted to identify genomic alterations in order to profile CNAs in the 40 MSS, CIMP-negative colon tumors using the Affymetrix Genome-wide Human SNP Array 6.0. The frequency and distribution of all CNAs across the tumor genomes is plotted in Figure 2A for individual chromosomes. To identify recurrent CNAs that are common for this subtype of colon cancer, we focused on both regional (>1 Mb) and focal (≤1 Mb) CNAs that occurred at a high frequency (i.e., with frequency ≥25%) among the 40 colon tumor samples. We observed common recurrent regional CNAs, namely gains at 1q, 7p, 7q, 8p12-11, 8q, 12p13, 13q, 20p, 20q, Xp, and Xq, as well as losses at 1p36, 1p31, 1p21, 4p15-12, 4q12-35, 5q21-22, 6q26, 8p, 14q, 15q11-12, 17p, 18p, 18q, 21q21-22, and 22q. Several regions harbored CNAs in >50% of the tumors, such as copy number gains at 7p, 7q, 13q, 20p, 20q, Xp, and Xq and losses at 8p, 17p, 18p, and 18q. In addition, common recurrent focal CNAs gains were observed at 1p31, 2q21, 3p14, 5p11, 5q11, 6p21, 6p12, 6q14, 6q16, and 17q21, as well as losses at 5q11, 5q12, 15q21, 15q26, 16p13, and 17q21.
Figure 2. Genome-wide copy number alterations and allelic imbalance in colon tumor tissue samples.
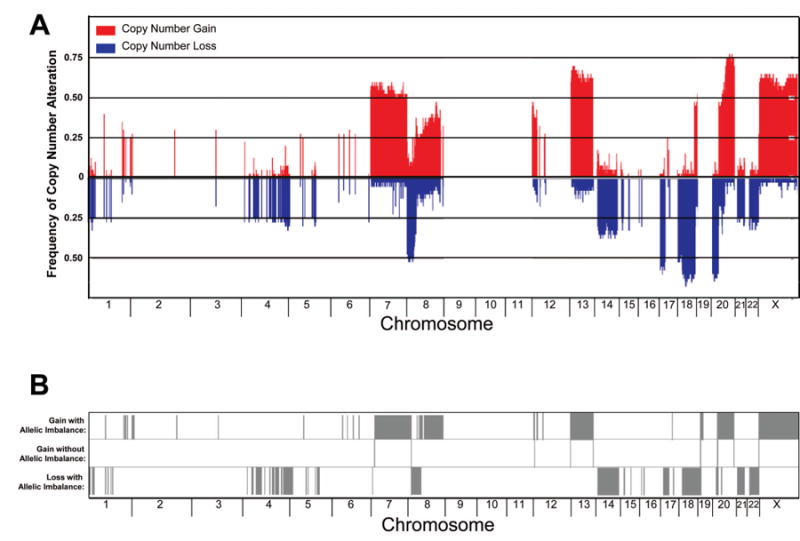
A. A histogram of the frequency of copy number gain and loss across chromosomes 1-22 and X for 40 colon tumor samples. B. The association of allelic imbalance in genomic regions of copy number gain or loss as indicated by the presence of a gray bar in the top and bottom panel, respectively. The chromosomal location of the event is indicated on the x-axis.
Genome-wide profiling of allelic imbalance was conducted using the paired adjacent normal and tumor tissue sample data from the genotype array. To examine potential mechanistic effects that contribute to the disruption to gene expression resulting from CNA events, we focused our analysis on allelic imbalance events occurring in genomic regions with recurrent copy number gain or loss (frequency ≥25%). As anticipated, allelic imbalance was observed in the majority of genomic sites and regions of recurrent copy number loss (Figure 2B). We also observed allelic imbalance in genomic sites and regions associated with recurrent copy number gain, indicating uniparental polysomy [regions where loss of heterozygosity (LOH) corresponds to regions of increased copy number] due to mitotic recombination events.
Integration of copy number alterations and gene expression
MSS colorectal cancers are known to be associated with aneuploidy and extensive genomic aberrations. Genomic alterations, such as copy number alterations and allelic imbalance, can potentially impact gene expression levels due to changes in gene dosage. To assess this relationship, we surveyed the correspondence of the 1,573 significantly differentially expressed genes and all detectable CNAs. We found that almost all of the differentially expressed genes (1,551 genes; 99%) were located in genomic regions where CNAs and/or allelic imbalance were detected. Of the 1,573 differentially expressed genes, 473 genes (30%) were located within genomic regions of recurrent CNAs (frequency >25%). Remarkably, 356 genes, or 75% of the 473 genes, had directional correspondence to the CNAs (96 down-regulated genes in regions of loss and 260 up-regulated genes in regions of gain) (Supplemental Table 3).
As previously reported, copy number gain at 20q is a common aberration found in MSS colorectal cancers (Jones et al., 2005; Trautmann et al., 2006; Jorissen et al., 2008; Dyrso et al., 2011). In our analysis, >50% of the colon tumors had copy number gain for chromosome arm 20q. Correspondingly, 69 genes on 20q were significantly overexpressed in tumor versus adjacent normal tissue. Based on our IPA disease function analysis, almost one-third (22 genes) of the 69 genes were identified to be associated with cancer. Specifically, three genes located on chromosome 20, PCNA (20pter-p12), CDC25B (20p13), and, AURKA (20q13), play a critical function in cellular growth and proliferation. Overexpression of these genes has been frequently observed in colorectal cancer. PCNA is a cofactor of DNA polymerase that participates in DNA synthesis and cell cycle progression, and is overexpressed in multiple cancer types (al-Sheneber et al., 1993; Schimmelpenning et al., 1993; Paradiso et al., 1996; Stoimenov and Helleday, 2009). The phosphatase, CDC25B, is a cell cycle regulator that has a critical role in checkpoint control. Cells overexpressing CDC25B proceed through the S-phase checkpoint and prematurely enter mitosis, which leads to genomic instability and chromosomal aberrations (Bugler et al., 2010). AURKA is a cell cycle regulated kinase and has a role in microtubule formation and stabilization during chromosomal segregation for mitotic cells. AURKA also directly phosphorylates TP53, resulting in the inactivation of TP53 function and the MDM2-mediated proteolytic degradation of TP53, respectively (Katayama et al., 2004; Liu et al., 2004). Consequently, overexpression of AURKA leads to increased TP53 degradation, disrupting TP53 mediated growth arrest and aneuploidy, due to centrosome amplification and defects in chromosomal segregation in tumor cells (Fu et al., 2007). AURKA expression is also regulated by the Myc-network of transcription factors (den Hollander et al., 2010).
In addition we also focused on genes in chromosome arm 20q that had a significant correlation (linear correlation P<0.05) with copy number gain, indicating that alterations to gene dosage have a direct effect on expression levels for this subset of genes. For example, as has been previously reported (Tsafrir et al., 2006; Reid et al., 2009), we observed a significant correlation between gene dosage and expression for the MYC-target gene, adenosylhomocysteinase (AHCY), on 20q11 in our tumor samples. AHCY plays a key role in maintaining efficient mRNA capping of MYC-induced transcripts during mRNA translation (Fernandez-Sanchez et al., 2009; Cowling, 2010;). Additional genes on 20q11 and 20q13 were also significantly correlated with copy number status and gene expression levels, several of which have been reported to be mis-expressed in colorectal cancer as well as other cancer types. These genes include protein O-fucosyltransferase 1 (POFUT1), which is involved in Notch signaling (Guilmeau et al., 2008; Stahl et al., 2008; Yao et al., 2011); ribophorin II (RPN2), a proteosome scaffolding protein involved in inhibiting Bcl-mediated apoptosis (Honma et al., 2008); trihydrophobin-like 1 (TH1L), a member of the negative elongation factor complex, which has been shown to have an important role in the regulation of invasion and metastasis in breast cancer (Cheng et al., 2009; Zou et al., 2010), and finally PRP6 pre-mRNA processing factor 6 homolog (PRPF6), involved in maintaining cell viability (Sillars-Hardebol et al., 2012) (Figure 3).
Figure 3. Correlation between gene expression levels and gene copy number gain.
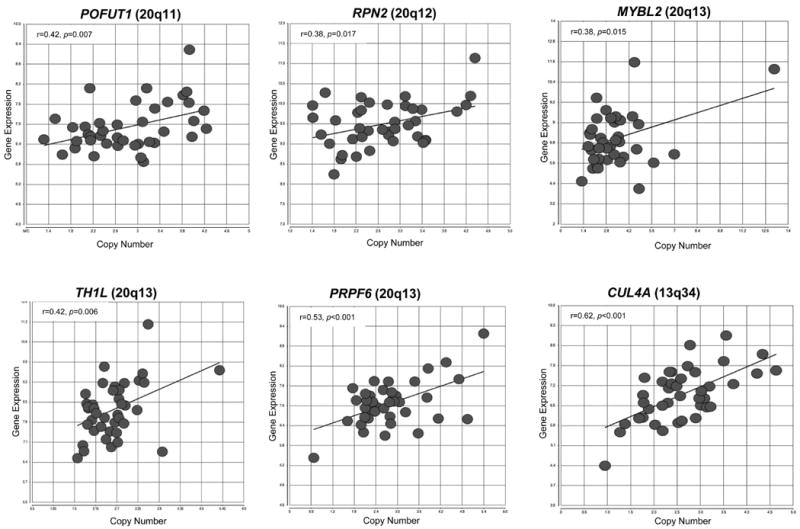
Scatter plots of differentially expressed genes on 20q and 13q located on genomic regions of recurrent copy number gain. These six genes demonstrated a significant correlation (linear correlation P<0.05) with copy number gain, indicating that alterations to gene dosage have a direct effect on expression levels for these subset of genes.
Chromosome arm 13q also displayed frequent CNA events (frequency >65%). The strongest correlation of copy number gain and upregulation of gene expression at 13q was observed for the cullin 4A gene (CUL4A) on 13q34 (Figure 3). CUL4A has been identified as an oncogene in mesothelioma, and breast and skin cancers (Liu et al., 2009; Melchor et al., 2009; Hung et al., 2011). CUL4A functions as a component of the ubiquitin ligase complex and has been shown to mediate the degradation of the cyclin-dependent kinase inhibitor, p27KIP1 in a Wnt-dependent mechanism (Miranda-Carboni et al., 2008; Yan et al., 2011).
The biological context and functional networks of the 356 differentially expressed genes corresponding to genomic regions of CNA gain or loss events were evaluated using Ingenuity Pathway Analysis (IPA). IPA indicated that this subset of 356 genes was enriched for genes functionally involved in mechanisms associated with cancer and cell cycle. The differentially expressed genes located in these regions of recurrent CNAs were enriched for cellular functions such as, “Cell Cycle” and “Cell Death”. When we examined the potential for gene interactions in the context of networks, we found that the two top networks were “DNA replication, Recombination, and Repair; Cell Cycle; Gene Expression” (Table 2, 3rd column). The GO enrichment analysis complemented the IPA results and indicated an enrichment of differentially expressed genes in regions of recurrent CNAs having a role in cellular processes, metabolism, catalytic activities, and binding (Table 2, 3rd column).
These data indicate that many of the differentially expressed genes that are located in genomic regions of recurrent CNAs are enriched for genes that have direct roles in cell cycle regulation and cancer, and specifically in critical cellular functions, such as proliferation, metabolism, and cell death. Therefore, these data support the concept that genomic aberrations, resulting in gene copy number alterations, lead to the deregulation of normal gene expression, which may directly contribute to key events in tumorigenesis and cell cycle regulation in colon cancer.
Differentially Expressed Genes and Recurrent Copy Number Alterations Reported to be Associated with Adenomas and Carcinomas
To identify potential “driver genes” that may have a role in the early events of tumorigenesis, we focused on genes located in recurrent CNAs previously reported in adenomas (gains: 7p, 7q, 8q, 12p, 13q, and 20q and losses: 1p, 16p, 17p, 18q) (Hermsen et al., 2002; Habermann et al., 2007; Sheffer et al., 2009). Based on our microarray data, there were a total of 248 genes located in genomic regions commonly altered in adenomas that were differentially expressed with directional correspondence to the tumor CNAs in our data. Similar to the original list of 1,573 differentially expressed genes and the 356 genes located genomic regions with recurrent CNAs, IPA identified “Cancer” and “Gastrointestinal Disease” as the top two biological functions in the Diseases and Disorders category, and “Cell Cycle” and “Cell Death” were in the top two molecular and cellular functions (Table 2, 4th column) for these 248 genes. GO analysis was also applied to the list of 248 genes to identify any enrichment of cellular functions or characteristics. The gene list was enriched for genes involved primarily in cellular processes, growth functions, catalytic activity, and binding. Taken together, these results suggest that regions of recurrent CNAs previously observed in early stages of colorectal carcinogenesis contain a subset of differentially expressed genes with a role in controlling cell cycle and proliferation, as well as cell death.
We were also interested in genes potentially involved in tumor progression events, so we used our data to identify differentially-expressed genes located in genomic regions of recurrent CNAs in our set of colon cancers that are observed in carcinomas, but rarely observed in adenomas, such as gains at Xp and Xq and losses at 4q, 5q, 8p, 14q, and 22q. CNAs in these genomic regions have also been linked to poor prognosis for colorectal carcinomas, particularly, 8p (Sheffer et al., 2009; Lagerstedt et al., 2010). Copy number loss at 8p has also been associated with poor prognosis for prostate (Lu et al., 2006; El Gammal et al., 2010) and breast cancers (Seute et al., 2001; Armes et al., 2004). Five genes in 8p had significant correlation (linear correlation P<0.05) between gene dosage and expression levels: FBXO25, MTUS1, EPHX2, KIF13B, and PPP2CB (Figure 4). Two of the five genes have already been implicated as potential tumor suppressor genes in colorectal cancer: PPP2CB (catalytic subunit of the protein phosphatase 2A) (Hornstein et al., 2008; Westermarck and Hahn, 2008) and MTUS1 (microtubule associated tumor suppressor 1) ( Zuern et al., 2009; Bacolod and Barany, 2010) . Therefore, copy number loss at 8p in colorectal carcinomas may have a direct role in the deregulation of gene expression in these two potential tumor suppressor genes, possibly affecting tumor progression and prognosis.
Figure 4. Correlation between gene expression and gene copy number loss on chromosome arm 8p.
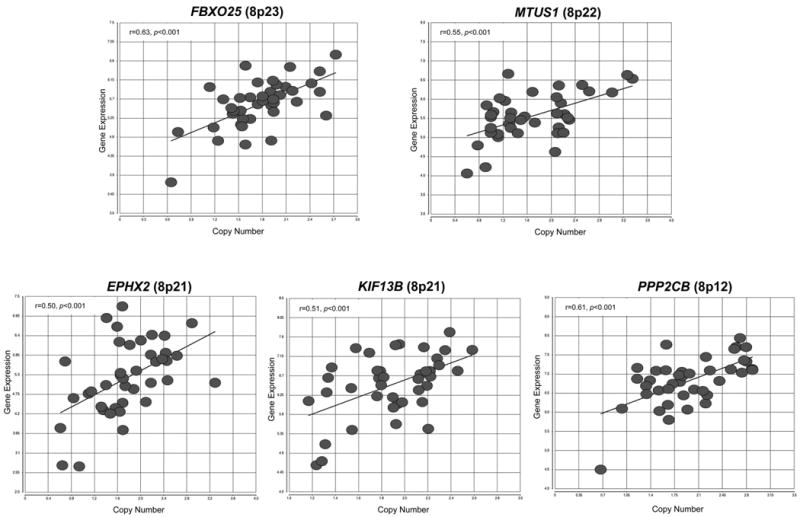
Scatter plots of differentially expressed genes on 8p located on genomic regions of recurrent copy number loss (>50% of tumor samples had copy number loss). These five genes demonstrated a significant linear correlation (P<0.05) with copy number loss, indicating that alterations to gene dosage has a direct effect on expression levels for these subset of genes.
This gene set of 108 differentially expressed genes located in these genomic regions of CNAs primarily associated with colorectal carcinoma were also analyzed in IPA. Interestingly, “Developmental Disorder” and “Genetic Disorder” were the top two functions in the diseases and disorders category, not “Cancer” and “Gastrointestinal Disease” as has been observed for the other gene lists (Table 2; 4th column). “Cell Cycle” and “Cell-to-Cell Signaling and Interaction” were the top two molecular and cellular functions represented in this gene list. GO analysis of the same 108 differentially expressed genes located in these genomic regions of CNAs indicated an enrichment of genes involved in cellular processes, metabolism, and catalytic activity. These results indicate that the genes found in recurrent CNAs associated with carcinomas and rarely in adenomas have a role in both cellular proliferation (e.g., CENPI, IRAK1, JUB, LIF, POLA1, SMC1A, TNFRSF10B) and movement/remodeling (e.g., ANGPT2, BGN, CMA1, FBLN1, MMP14, STC1, TIMP1, TLR3) and thus, may impact steps in tumor progression to colon cancer.
Discussion
We have conducted a high-resolution genome-wide molecular analysis of MSS, CIMP-negative colon tumors by integrating genomic alterations and differential gene expression. First, we identified numerous genes that are differentially expressed in MSS, CIMP-negative colon tumors and highlighted several genes with the most dramatic fold-change differences in expression levels for tumor versus adjacent normal tissue. Among these genes, some have been previously established to play a role in colorectal cancer (eg. CLDN1, KIAA1199, ETV4, and IL8) and others have been shown to be differentially expressed in other cancer types (eg. the CLCA gene family). We also utilized the gene list of 1573 differentially expressed genes in tumor tissue to create biological pathways and networks to illustrate the inter-dependence and relatedness of these genes in order to explore the functional implications of differential gene expression for colon tumors. We observed that many of these genes are known to play critical roles in cellular functions previously associated with the mechanisms of cancer (Supplemental Table 1 and Supplemental Figure 1).
MSS, CIMP-negative colorectal tumors are the most prevalent type of colorectal cancer and are associated with extensive copy number alteration events and aneuploidy. We also assessed the relationship between recurrent genomic alterations and changes in gene expression patterns for this molecular subtype of colon cancer. We focused on genes located in genomic regions of recurrent CNAs because these alterations are more likely to result in changes to gene expression that impart a selective advantage for tumorigenesis. Overall, we found a striking directional correspondence between CNA events and the up and down-regulated expression of genes that were differentially expressed in tumor compared to normal adjacent tissue.
We focused our analysis on the genomic regions that displayed recurrent CNA events (alterations in >25% of the tumor samples), namely, gains on 1q, 2q, 3p, 5, 6, 7, 8, 12p, 13q, 17q, 20q, X and X and losses on 1p, 4, 5q, 6q, 8p, 14q, 15q, 16p, 17p, 18, 21q, and 22q. Because we used a high-resolution SNP microarray, we were able to assess allelic imbalance in addition to CNAs. We found that many of the genomic regions containing recurrent CNAs were associated with allelic imbalance (AI), or LOH, for genomic regions containing either gain or loss events. As anticipated, we observed LOH for regions with copy number loss, but we also observed LOH in many of the regions with recurrent copy number gain, also known as uniparental polysomy.
Uniparental disomy, or polysomy, is the result of the loss of one allele and the reduplication of the remaining allele giving rise to LOH associated with copy number neutral or gain event. This can also happen when an individual inherits two copies of a particular chromosome from the same parent (Engel, 1980). Several studies have previously observed uniparental disomy, or polysomy, in colorectal tumors and cell lines for 8q, 13q, 14, 18 and 20q (Andersen et al., 2007; Melcher et al., 2007; Darbary et al., 2009). In this study, we also observed uniparental polysomy on 8q, 13q, and 20q, but unlike what was reported previously (Darbary et al., 2009), we observed LOH and copy number loss for chromosomes 14 and 18, rather than copy number neutral events, as was reported by Darbary et al. (Darbary et al., 2009). In addition, we identified other genomic sites of uniparental polysomy not previously reported at 1q, 2q, 3q, 5p, 6, 12, and 17q. These new observations may have resulted from our use of a higher resolution genome-wide microarray with ≥906,600 SNPs (versus the 11,500 SNPs used in earlier studies) and an additional >946,000 copy number probes. In addition, our tumor samples were macrodissected to have >70% tumor cell content. Although still poorly understood, uniparental di- or polysomy may play a critical role in tumorigenesis, since these events result in the monoallelic expression of the remaining allele and can possibly lead to the unmasking of a previously silent somatic mutation, or depending on the methylation state, may result in the loss of imprinting of the remaining allele (Melcher et al., 2007; Soh et al., 2009; Tuna et al., 2009; Melcher et al., 2011).
As anticipated, we observed that the relationship between genomic alterations and gene expression in tumors is likely to be very complex, particularly when considering the multiple layers of transcriptional regulation operating in the cell, both genetic and epigenetic. We found that only 23% of the total number of differentially expressed genes (356 of 1,573) was located in regions of recurrent CNAs with gene expression directionally corresponding to gene copy number (down-regulated genes in regions of copy number loss and up-regulated genes in regions of copy number gain). Of the 356 genes, the majority of genes (n=260) were up-regulated and associated with copy number gain, in contrast to the 96 genes that were down-regulated and located in regions of copy number loss. Enrichment analysis using IPA indicated that the primary biological functions of the subset of the 356 genes corresponded to “Cell Cycle” and “Cell Death”. These results highlight the observation that genomic alteration events likely play a critical role in perturbing the normal expression patterns of genes involved in cell cycle regulation; although we cannot unequivocally identify these genes as “drivers” of tumorigenesis, overall, both IPA and GO enrichment analyses showed that many of the differentially expressed genes corresponding to genomic regions of copy number alterations had cellular and molecular functions controlling events involved in cell cycle regulation, proliferation and apoptosis.
The most frequent CNA in our set of 40 tumors was found at the 20q11-13 amplicon, containing several genes displaying a significant direct correlation with gene dosage and expression levels. Of particular interest is the disruption to gene expression mediated by the copy number gain of POFUT1 at 20q11 because this event may directly impact the Notch signaling pathway. The POFUT1 gene encodes an enzyme that adds O-fucose to Notch proteins, an essential step for proper Notch protein function. Since Notch signaling plays a critical role in stem cells of intestinal crypts, and potentially cancer stem cells (Bolos et al., 2009), increased Notch signaling mediated by POFUT1 may function as a critical step in colon tumorigenesis. Furthermore, we observed the overexpression of the NOTCH1 gene in our colon tumor samples, supporting the observation that Notch signaling has a critical role in colon cancer and the up-regulation of POFUT1 may facilitate Notch pathway activation (Supplemental Figure 1).
Activation of the Wnt-signaling pathway has been implicated in the development of multiple solid tumors, particularly colorectal cancer (Kinzler et al., 1991; Powell et al., 1992; Kinzler and Vogelstein, 1996;). Initiation of colorectal cancer is believed to occur when the Wnt signaling is disrupted (Grady and Carethers, 2008; Lin et al., 2008). Thus, we were interested in determining if genomic regions containing genes of the Wnt-signaling pathway demonstrated recurrent genomic alterations. We observed two up-regulated genes in this signaling pathway, WNT2 (7q31) and MYC (8q24) corresponding to copy number gain events in 50% and 45% of the samples, respectively. It is plausible that the copy number gain at WNT2 contributes to the early events of up-regulated WNT2 gene expression in adenomas, the earliest stage for colorectal cancer development. Activation of the Wnt signaling pathway is associated with the down-regulation or mutation of APC. This leads to increased levels of β-catenin and TCF/LEF-mediated transcriptional activation, resulting in increased MYC transcription. In our data, we see both a significant decrease in APC and increase in TCF/LEF gene expression levels in the tumor samples, consistent with known critical events of Wnt-signaling pathway activation. Furthermore, we observed copy number gain at the MYC gene (8q24) in the majority of the tumor samples, possibly creating a state where the activation of the Wnt-signaling cascade can capitalize on the increased gene copy number of MYC and resulting in transcriptional activation and overexpression of MYC. Therefore, the strong correspondence between CNAs at WNT2 (7q31) and MYC (8q24) likely contribute to the initiation and progression of the chain of events that leads to an increase in growth and proliferation signaling (Figure 5).
Figure 5. Genes differentially expressed in the Wnt/β-catenin pathway in colon tumor tissue.
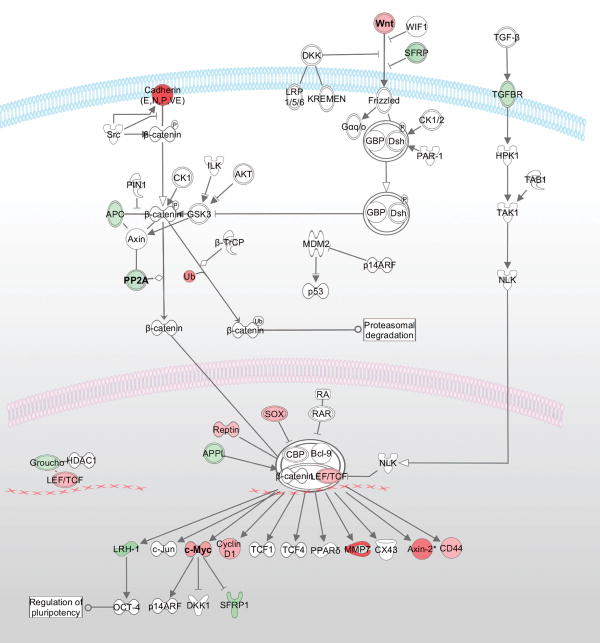
Wnt/β-catenin pathway genes that were significantly differentially expressed in the colon tumor tissue samples are indicated by red or green shading (red for up-regulated and green for down-regulated). The fold-change expression levels in tumor versus adjacent normal tissue are represented by the intensity of shading. Recurrent copy number gain was detected in genomic regions containing the WNT2 (7q31) and MYC (8q24) genes, corresponding to increased expression of the WNT2 and MYC gene.
In the recent report from The Cancer Genome Atlas (TCGA) Network investigators, a comprehensive molecular analysis was conducted to identify somatic mutations in both colon and rectal tumors using DNA copy number, promoter methylation, mRNA, and microRNA expression and exome sequencing (The-Cancer-Genome-Atlas-Network, 2012). The results of our study complement and add to these findings. The TCGA data confirmed the critical role of the Wnt-signaling pathway in colon and rectal cancer. We also found that the gene expression profiles of a subset of genes in the Wnt-pathway were disrupted in colon tumor versus normal tissue. In the TCGA analysis of genes and pathways disrupted in colon cancer, it was found that pathways involving TP53, MYC, MYB, E2F, and DNA remodeling and repair were affected. We also observed differential expression of these genes and potential disruption of these pathway functions in our dataset (Supplemental Tables 1 and 2). In particular, consistent with the results from the TCGA report, our gene list of differentially expressed genes was highly enriched for genes that are regulated by TP53. The TCGA study found 59% of the 165 non-hypermutated colorectal cancer cases contained an inactivating mutation in TP53 (The-Cancer-Genome-Atlas-Network, 2012). Although we do not have exome sequencing data to detect mutations for our tumor samples, we did observe a high frequency of LOH for TP53 on 17p. In addition, the genome-wide copy number alteration profiles in the non-hypermutated colorectal tumor samples included in the TCGA study, were very similar to those observed in our samples, e.g. loss of 8p, 14q, 15q, 17p, 18p and 18q, and gains of 7p, 7q, 8q, 13q, 20p, and 20q.
The notable strength of this study is the inclusion of a homogeneous set of molecularly characterized colon tumors (MSS and CIMP-negative) and their paired adjacent normal tissue, allowing for the identification of molecular alterations specific to this common molecular subtype. Detection of loss of LOH can be compromised when there is heterogeneity in the tumor sample due to normal cell contamination. To ensure that our tumor samples were minimized for normal cell content, they were reviewed by a pathologist and all samples included in the study contained a tumor cell content of >70%.
In conclusion, our results confirm and further describe the extensive genomic alteration events present in colon cancer that correspond with changes in gene expression. We identified a number of genes located in regions of characteristic recurrent CNAs with corresponding changes in expression in tumor compared to adjacent normal tissue. Our results indicate that many of the differentially expressed genes located in genomic regions of the observed recurrent CNAs have a role in cellular proliferation and metabolism events in colon cancer. Additional studies focusing on the role of the less well-characterized genes identified in this study are warranted so as to increase our understanding of the mechanisms impacting colon carcinogenesis. These results also illustrate the potential of studies examining the direct relationship between genomic alterations and gene expression, and the need to expand our data to other molecular subtypes of colorectal cancer.
Supplementary Material
Supplemental Data Figure 1. Genes differentially expressed in signaling pathways involved in cancer. Genes in multiple signaling pathways involved in the mechanisms of cancer are indicated by red or green shading (red for up-regulated and green for down-regulated). The fold-change expression levels in tumor versus adjacent normal tissue are represented by the intensity of shading.
Acknowledgments
The content of this manuscript does not necessarily reflect the views or policies of the National Cancer Institute or any of the collaborating centers in the CFRs, nor does mention of trade names, commercial products, or organizations imply endorsement by the US Government or the CFR. We also thank the participants of the Colon Family Registry who have contributed to a better understanding of the genetic contributions to colon cancer.
SUPPORT: This work was supported by the National Cancer Institute, National Institutes of Health under RFA # CA-95-011; and through cooperative agreements with the University of Hawaii Colorectal Cancer Family Registry (U01 CA074806), Mayo Clinic Cooperative Family Registry for Colon Cancer Studies (U01 CA074800), Ontario Registry for Studies of Familial Colorectal Cancer (U01 CA074783), the University of Southern California Familial Colorectal Neoplasia Collaborative Group (U01 CA074799), and members of the Colon Cancer Family Registry and P.I.s. In addition, this work was partly supported by grant 5U24 CA074806 and an award from the Affymetrix Collaborations in Cancer Research Program.
References
- al-Sheneber IF, Shibata HR, Sampalis J, Jothy S. Prognostic significance of proliferating cell nuclear antigen expression in colorectal cancer. Cancer. 1993;71:1954–1959. doi: 10.1002/1097-0142(19930315)71:6<1954::aid-cncr2820710605>3.0.co;2-#. [DOI] [PubMed] [Google Scholar]
- Andersen CL, Wiuf C, Kruhoffer M, Korsgaard M, Laurberg S, Orntoft TF. Frequent occurrence of uniparental disomy in colorectal cancer. Carcinogenesis. 2007;28:38–48. doi: 10.1093/carcin/bgl086. [DOI] [PubMed] [Google Scholar]
- Andrews J, Kennette W, Pilon J, Hodgson A, Tuck AB, Chambers AF, Rodenhiser DI. Multi-platform whole-genome microarray analyses refine the epigenetic signature of breast cancer metastasis with gene expression and copy number. PLoS One. 2010;5:e8665. doi: 10.1371/journal.pone.0008665. [DOI] [PMC free article] [PubMed] [Google Scholar]
- Armes JE, Hammet F, de Silva M, Ciciulla J, Ramus SJ, Soo WK, Mahoney A, Yarovaya N, Henderson MA, Gish K, Hutchins AM, Price GR, Venter DJ. Candidate tumor-suppressor genes on chromosome arm 8p in early-onset and high-grade breast cancers. Oncogene. 2004;23:5697–5702. doi: 10.1038/sj.onc.1207740. [DOI] [PubMed] [Google Scholar]
- Bacolod MD, Barany F. Gene dysregulations driven by somatic copy number aberrations-biological and clinical implications in colon tumors: a paper from the 2009 William Beaumont Hospital Symposium on Molecular Pathology. J Mol Diagn. 2010;12:552–561. doi: 10.2353/jmoldx.2010.100098. [DOI] [PMC free article] [PubMed] [Google Scholar]
- Benjamini Y, Hochber Y. Controlling the false discovery rate: a practical and powerful approach to multiple testing. Journal of the Royal Statistical Society Series B (Methodological) 1995;57:289–300. [Google Scholar]
- Birkenkamp-Demtroder K, Maghnouj A, Mansilla F, Thorsen K, Andersen CL, Oster B, Hahn S, Orntoft TF. Repression of KIAA1199 attenuates Wnt-signalling and decreases the proliferation of colon cancer cells. Br J Cancer. 2011;105:552–561. doi: 10.1038/bjc.2011.268. [DOI] [PMC free article] [PubMed] [Google Scholar]
- Bolos V, Blanco M, Medina V, Aparicio G, Diaz-Prado S, Grande E. Notch signalling in cancer stem cells. Clin Transl Oncol. 2009;11:11–19. doi: 10.1007/s12094-009-0305-2. [DOI] [PubMed] [Google Scholar]
- Bugler B, Schmitt E, Aressy B, Ducommun B. Unscheduled expression of CDC25B in S-phase leads to replicative stress and DNA damage. Mol Cancer. 2010;9:29. doi: 10.1186/1476-4598-9-29. [DOI] [PMC free article] [PubMed] [Google Scholar]
- Bustin SA, Li SR, Dorudi S. Expression of the Ca2+-activated chloride channel genes CLCA1 and CLCA2 is downregulated in human colorectal cancer. DNA Cell Biol. 2001;20:331–338. doi: 10.1089/10445490152122442. [DOI] [PubMed] [Google Scholar]
- Camps J, Armengol G, del Rey J, Lozano JJ, Vauhkonen H, Prat E, Egozcue J, Sumoy L, Knuutila S, Miro R. Genome-wide differences between microsatellite stable and unstable colorectal tumors. Carcinogenesis. 2006;27:419–428. doi: 10.1093/carcin/bgi244. [DOI] [PubMed] [Google Scholar]
- Camps J, Nguyen QT, Padilla-Nash HM, Knutsen T, McNeil NE, Wangsa D, Hummon AB, Grade M, Ried T, Difilippantonio MJ. Integrative genomics reveals mechanisms of copy number alterations responsible for transcriptional deregulation in colorectal cancer. Genes Chromosomes Cancer. 2009;48:1002–1017. doi: 10.1002/gcc.20699. [DOI] [PMC free article] [PubMed] [Google Scholar]
- Cardoso J, Boer J, Morreau H, Fodde R. Expression and genomic profiling of colorectal cancer. Biochim Biophys Acta. 2007;1775:103–137. doi: 10.1016/j.bbcan.2006.08.004. [DOI] [PubMed] [Google Scholar]
- Carvalho B, Postma C, Mongera S, Hopmans E, Diskin S, van de Wiel MA, van Criekinge W, Thas O, Matthai A, Cuesta MA, Terhaar Sive, Droste JS, Craanen M, Schrock E, Ylstra B, Meijer GA. Multiple putative oncogenes at the chromosome 20q amplicon contribute to colorectal adenoma to carcinoma progression. Gut. 2009;58:79–89. doi: 10.1136/gut.2007.143065. [DOI] [PubMed] [Google Scholar]
- Chen Y, Chen L, Li JY, Mukaida N, Wang Q, Yang C, Yin WJ, Zeng XH, Jin W, Shao ZM. ERbeta and PEA3 co-activate IL-8 expression and promote the invasion of breast cancer cells. Cancer Biol Ther. 2011;11:497–511. doi: 10.4161/cbt.11.5.14667. [DOI] [PubMed] [Google Scholar]
- Cheng C, Kong X, Wang H, Gan H, Hao Y, Zou W, Wu J, Chi Y, Yang J, Hong Y, Chen K, Gu J. Trihydrophobin 1 Interacts with PAK1 and Regulates ERK/MAPK Activation and Cell Migration. J Biol Chem. 2009;284:8786–8796. doi: 10.1074/jbc.M806144200. [DOI] [PMC free article] [PubMed] [Google Scholar]
- Comelli EM, Lariani S, Zwahlen MC, Fotopoulos G, Holzwarth JA, Cherbut C, Dorta G, Corthesy-Theulaz I, Grigorov M. Biomarkers of human gastrointestinal tract regions. Mamm Genome. 2009;20:516–527. doi: 10.1007/s00335-009-9212-7. [DOI] [PubMed] [Google Scholar]
- Cowling VH. Regulation of mRNA cap methylation. Biochem J. 2010;425:295–302. doi: 10.1042/BJ20091352. [DOI] [PMC free article] [PubMed] [Google Scholar]
- Cunningham D, Atkin W, Lenz HJ, Lynch HT, Minsky B, Nordlinger B, Starling N. Colorectal cancer. Lancet. 2010;375:1030–1047. doi: 10.1016/S0140-6736(10)60353-4. [DOI] [PubMed] [Google Scholar]
- Cunningham JM, Christensen ER, Tester DJ, Kim CY, Roche PC, Burgart LJ, Thibodeau SN. Hypermethylation of the hMLH1 promoter in colon cancer with microsatellite instability. Cancer Res. 1998;58:3455–3460. [PubMed] [Google Scholar]
- Darbary HK, Dutt SS, Sait SJ, Nowak NJ, Heinaman RE, Stoler DL, Anderson GR. Uniparentalism in sporadic colorectal cancer is independent of imprint status, and coordinate for chromosomes 14 and 18. Cancer Genet Cytogenet. 2009;189:77–86. doi: 10.1016/j.cancergencyto.2008.10.011. [DOI] [PMC free article] [PubMed] [Google Scholar]
- den Hollander J, Rimpi S, Doherty JR, Rudelius M, Buck A, Hoellein A, Kremer M, Graf N, Scheerer M, Hall MA, Goga A, von Bubnoff N, Duyster J, Peschel C, Cleveland JL, Nilsson JA, Keller U. Aurora kinases A and B are up-regulated by Myc and are essential for maintenance of the malignant state. Blood. 2010;116:1498–1505. doi: 10.1182/blood-2009-11-251074. [DOI] [PMC free article] [PubMed] [Google Scholar]
- Duffy MJ, van Dalen A, Haglund C, Hansson L, Holinski-Feder E, Klapdor R, Lamerz R, Peltomaki P, Sturgeon C, Topolcan O. Tumour markers in colorectal cancer: European Group on Tumour Markers (EGTM) guidelines for clinical use. Eur J Cancer. 2007;43:1348–1360. doi: 10.1016/j.ejca.2007.03.021. [DOI] [PubMed] [Google Scholar]
- Dyrso T, Li J, Wang K, Lindebjerg J, Kolvraa S, Bolund L, Jakobsen A, Bruun-Petersen G, Li S, Cruger DG. Identification of chromosome aberrations in sporadic microsatellite stable and unstable colorectal cancers using array comparative genomic hybridization. Cancer Genet. 2011;204:84–95. doi: 10.1016/j.cancergencyto.2010.08.019. [DOI] [PubMed] [Google Scholar]
- El Gammal AT, Bruchmann M, Zustin J, Isbarn H, Hellwinkel OJ, Kollermann J, Sauter G, Simon R, Wilczak W, Schwarz J, Bokemeyer C, Brummendorf TH, Izbicki JR, Yekebas E, Fisch M, Huland H, Graefen M, Schlomm T. Chromosome 8p deletions and 8q gains are associated with tumor progression and poor prognosis in prostate cancer. Clin Cancer Res. 2010;16:56–64. doi: 10.1158/1078-0432.CCR-09-1423. [DOI] [PubMed] [Google Scholar]
- Engel E. A new genetic concept: uniparental disomy and its potential effect, isodisomy. Am J Med Genet. 1980;6:137–143. doi: 10.1002/ajmg.1320060207. [DOI] [PubMed] [Google Scholar]
- Fernandez-Sanchez ME, Gonatopoulos-Pournatzis T, Preston G, Lawlor MA, Cowling VH. S-adenosyl homocysteine hydrolase is required for Myc-induced mRNA cap methylation, protein synthesis, and cell proliferation. Mol Cell Biol. 2009;29:6182–6191. doi: 10.1128/MCB.00973-09. [DOI] [PMC free article] [PubMed] [Google Scholar]
- Fu J, Bian M, Jiang Q, Zhang C. Roles of Aurora kinases in mitosis and tumorigenesis. Mol Cancer Res. 2007;5:1–10. doi: 10.1158/1541-7786.MCR-06-0208. [DOI] [PubMed] [Google Scholar]
- Grade M, Ghadimi BM, Varma S, Simon R, Wangsa D, Barenboim-Stapleton L, Liersch T, Becker H, Ried T, Difilippantonio MJ. Aneuploidy-dependent massive deregulation of the cellular transcriptome and apparent divergence of the Wnt/beta-catenin signaling pathway in human rectal carcinomas. Cancer Res. 2006;66:267–282. doi: 10.1158/0008-5472.CAN-05-2533. [DOI] [PMC free article] [PubMed] [Google Scholar]
- Grady WM, Carethers JM. Genomic and epigenetic instability in colorectal cancer pathogenesis. Gastroenterology. 2008;135:1079–1099. doi: 10.1053/j.gastro.2008.07.076. [DOI] [PMC free article] [PubMed] [Google Scholar]
- Gruber AD, Pauli BU. Tumorigenicity of human breast cancer is associated with loss of the Ca2+-activated chloride channel CLCA2. Cancer Res. 1999;59:5488–5491. [PubMed] [Google Scholar]
- Guilmeau S, Flandez M, Bancroft L, Sellers RS, Tear B, Stanley P, Augenlicht LH. Intestinal deletion of Pofut1 in the mouse inactivates notch signaling and causes enterocolitis. Gastroenterology. 2008;135:849–860. 860 e841–846. doi: 10.1053/j.gastro.2008.05.050. [DOI] [PMC free article] [PubMed] [Google Scholar]
- Habermann JK, Paulsen U, Roblick UJ, Upender MB, McShane LM, Korn EL, Wangsa D, Kruger S, Duchrow M, Bruch HP, Auer G, Ried T. Stage-specific alterations of the genome, transcriptome, and proteome during colorectal carcinogenesis. Genes Chromosomes Cancer. 2007;46:10–26. doi: 10.1002/gcc.20382. [DOI] [PubMed] [Google Scholar]
- Hermsen M, Postma C, Baak J, Weiss M, Rapallo A, Sciutto A, Roemen G, Arends JW, Williams R, Giaretti W, De Goeij A, Meijer G. Colorectal adenoma to carcinoma progression follows multiple pathways of chromosomal instability. Gastroenterology. 2002;123:1109–1119. doi: 10.1053/gast.2002.36051. [DOI] [PubMed] [Google Scholar]
- Honma K, Iwao-Koizumi K, Takeshita F, Yamamoto Y, Yoshida T, Nishio K, Nagahara S, Kato K, Ochiya T. RPN2 gene confers docetaxel resistance in breast cancer. Nat Med. 2008;14:939–948. doi: 10.1038/nm.1858. [DOI] [PubMed] [Google Scholar]
- Horlings HM, Lai C, Nuyten DS, Halfwerk H, Kristel P, van Beers E, Joosse SA, Klijn C, Nederlof PM, Reinders MJ, Wessels LF, van de Vijver MJ. Integration of DNA copy number alterations and prognostic gene expression signatures in breast cancer patients. Clin Cancer Res. 2010;16:651–663. doi: 10.1158/1078-0432.CCR-09-0709. [DOI] [PubMed] [Google Scholar]
- Hornstein M, Hoffmann MJ, Alexa A, Yamanaka M, Muller M, Jung V, Rahnenfuhrer J, Schulz WA. Protein phosphatase and TRAIL receptor genes as new candidate tumor genes on chromosome 8p in prostate cancer. Cancer Genomics Proteomics. 2008;5:123–136. [PubMed] [Google Scholar]
- Hung MS, Mao JH, Xu Z, Yang CT, Yu JS, Harvard C, Lin YC, Bravo DT, Jablons DM, You L. Cul4A is an oncogene in malignant pleural mesothelioma. J Cell Mol Med. 2011;15:350–358. doi: 10.1111/j.1582-4934.2009.00971.x. [DOI] [PMC free article] [PubMed] [Google Scholar]
- Huo Q, Kinugasa T, Wang L, Huang J, Zhao J, Shibaguchi H, Kuroki M, Tanaka T, Yamashita Y, Nabeshima K, Iwasaki H. Claudin-1 protein is a major factor involved in the tumorigenesis of colorectal cancer. Anticancer Res. 2009;29:851–857. [PubMed] [Google Scholar]
- Irizarry RA, Hobbs B, Collin F, Beazer-Barclay YD, Antonellis KJ, Scherf U, Speed TP. Exploration, normalization, and summaries of high density oligonucleotide array probe level data. Biostatistics. 2003;4:249–264. doi: 10.1093/biostatistics/4.2.249. [DOI] [PubMed] [Google Scholar]
- Jemal A, Siegel R, Ward E, Hao Y, Xu J, Murray T, Thun MJ. Cancer statistics, 2008. CA Cancer J Clin. 2008;58:71–96. doi: 10.3322/CA.2007.0010. [DOI] [PubMed] [Google Scholar]
- Jones AM, Douglas EJ, Halford SE, Fiegler H, Gorman PA, Roylance RR, Carter NP, Tomlinson IP. Array-CGH analysis of microsatellite-stable, near-diploid bowel cancers and comparison with other types of colorectal carcinoma. Oncogene. 2005;24:118–129. doi: 10.1038/sj.onc.1208194. [DOI] [PubMed] [Google Scholar]
- Jorissen RN, Lipton L, Gibbs P, Chapman M, Desai J, Jones IT, Yeatman TJ, East P, Tomlinson IP, Verspaget HW, Aaltonen LA, Kruhoffer M, Orntoft TF, Andersen CL, Sieber OM. DNA copy-number alterations underlie gene expression differences between microsatellite stable and unstable colorectal cancers. Clin Cancer Res. 2008;14:8061–8069. doi: 10.1158/1078-0432.CCR-08-1431. [DOI] [PMC free article] [PubMed] [Google Scholar]
- Katayama H, Sasai K, Kawai H, Yuan ZM, Bondaruk J, Suzuki F, Fujii S, Arlinghaus RB, Czerniak BA, Sen S. Phosphorylation by aurora kinase A induces Mdm2-mediated destabilization and inhibition of p53. Nat Genet. 2004;36:55–62. doi: 10.1038/ng1279. [DOI] [PubMed] [Google Scholar]
- Keld R, Guo B, Downey P, Cummins R, Gulmann C, Ang YS, Sharrocks AD. PEA3/ETV4-related transcription factors coupled with active ERK signalling are associated with poor prognosis in gastric adenocarcinoma. Br J Cancer. 2011;105:124–130. doi: 10.1038/bjc.2011.187. [DOI] [PMC free article] [PubMed] [Google Scholar]
- Khan K, Hardy R, Haq A, Ogunbiyi O, Morton D, Chidgey M. Desmocollin switching in colorectal cancer. Br J Cancer. 2006;95:1367–1370. doi: 10.1038/sj.bjc.6603453. [DOI] [PMC free article] [PubMed] [Google Scholar]
- Kim H, Nam SW, Rhee H, Shan Li L, Ju Kang H, Hye Koh K, Kyu Kim N, Song J, Tak-Bun Liu E. Different gene expression profiles between microsatellite instability-high and microsatellite stable colorectal carcinomas. Oncogene. 2004;23:6218–6225. doi: 10.1038/sj.onc.1207853. [DOI] [PubMed] [Google Scholar]
- Kinzler KW, Nilbert MC, Vogelstein B, Bryan TM, Levy DB, Smith KJ, Preisinger AC, Hamilton SR, Hedge P, Markham A, et al. Identification of a gene located at chromosome 5q21 that is mutated in colorectal cancers. Science. 1991;251:1366–1370. doi: 10.1126/science.1848370. [DOI] [PubMed] [Google Scholar]
- Kinzler KW, Vogelstein B. Lessons from hereditary colorectal cancer. Cell. 1996;87(2):159–170. doi: 10.1016/s0092-8674(00)81333-1. [DOI] [PubMed] [Google Scholar]
- Lagerstedt KK, Kristiansson E, Lonnroth C, Andersson M, Iresjo BM, Gustafsson A, Hansson E, Kressner U, Nordgren S, Enlund F, Lundholm K. Genes with relevance for early to late progression of colon carcinoma based on combined genomic and transcriptomic information from the same patients. Cancer Inform. 2010;9:79–91. doi: 10.4137/cin.s4545. [DOI] [PMC free article] [PubMed] [Google Scholar]
- LaPointe LC, Pedersen SK, Dunne R, Brown GS, Pimlott L, Gaur S, McEvoy A, Thomas M, Wattchow D, Molloy PL, Young GP. Discovery and validation of molecular biomarkers for colorectal adenomas and cancer with application to blood testing. PLoS One. 2012;7:e29059. doi: 10.1371/journal.pone.0029059. [DOI] [PMC free article] [PubMed] [Google Scholar]
- Lin Z, Gao C, Ning Y, He X, Wu W, Chen YG. The pseudoreceptor BMP and activin membrane-bound inhibitor positively modulates Wnt/beta-catenin signaling. J Biol Chem. 2008;283:33053–33058. doi: 10.1074/jbc.M804039200. [DOI] [PMC free article] [PubMed] [Google Scholar]
- Liu L, Lee S, Zhang J, Peters SB, Hannah J, Zhang Y, Yin Y, Koff A, Ma L, Zhou P. CUL4A abrogation augments DNA damage response and protection against skin carcinogenesis. Mol Cell. 2009;34:451–460. doi: 10.1016/j.molcel.2009.04.020. [DOI] [PMC free article] [PubMed] [Google Scholar]
- Liu Q, Kaneko S, Yang L, Feldman RI, Nicosia SV, Chen J, Cheng JQ. Aurora-A abrogation of p53 DNA binding and transactivation activity by phosphorylation of serine 215. J Biol Chem. 2004;279:52175–52182. doi: 10.1074/jbc.M406802200. [DOI] [PubMed] [Google Scholar]
- Loo LW, Cheng I, Tiirikainen M, Lum-Jones A, Seifried A, Dunklee LM, Church JM, Gryfe R, Weisenberger DJ, Haile RW, Gallinger S, Duggan DJ, Thibodeau SN, Casey G, Le Marchand L. cis-Expression QTL Analysis of Established Colorectal Cancer Risk Variants in Colon Tumors and Adjacent Normal Tissue. PLoS One. 2012;7:e30477. doi: 10.1371/journal.pone.0030477. [DOI] [PMC free article] [PubMed] [Google Scholar]
- Lu W, Takahashi H, Furusato B, Maekawa S, Ikegami M, Sudo A, Egawa S, Hano H. Allelotyping analysis at chromosome arm 8p of high-grade prostatic intraepithelial neoplasia and incidental, latent, and clinical prostate cancers. Genes Chromosomes Cancer. 2006;45:509–515. doi: 10.1002/gcc.20314. [DOI] [PubMed] [Google Scholar]
- Meijer GA, Hermsen MA, Baak JP, van Diest PJ, Meuwissen SG, Belien JA, Hoovers JM, Joenje H, Snijders PJ, Walboomers JM. Progression from colorectal adenoma to carcinoma is associated with non-random chromosomal gains as detected by comparative genomic hybridisation. J Clin Pathol. 1998;51:901–909. doi: 10.1136/jcp.51.12.901. [DOI] [PMC free article] [PubMed] [Google Scholar]
- Melcher R, Al-Taie O, Kudlich T, Hartmann E, Maisch S, Steinlein C, Schmid M, Rosenwald A, Menzel T, Scheppach W, Luhrs H. SNP-Array genotyping and spectral karyotyping reveal uniparental disomy as early mutational event in MSS- and MSI-colorectal cancer cell lines. Cytogenet Genome Res. 2007;118:214–221. doi: 10.1159/000108303. [DOI] [PubMed] [Google Scholar]
- Melcher R, Hartmann E, Zopf W, Herterich S, Wilke P, Muller L, Rosler E, Kudlich T, Al-Taie O, Rosenwald A, Katzenberger T, Scholtka B, Seibold S, Rogoll D, Scheppach W, Scheurlen M, Luhrs H. LOH and copy neutral LOH (cnLOH) act as alternative mechanism in sporadic colorectal cancers with chromosomal and microsatellite instability. Carcinogenesis. 2011;32:636–642. doi: 10.1093/carcin/bgr011. [DOI] [PubMed] [Google Scholar]
- Melchor L, Saucedo-Cuevas LP, Munoz-Repeto I, Rodriguez-Pinilla SM, Honrado E, Campoverde A, Palacios J, Nathanson KL, Garcia MJ, Benitez J. Comprehensive characterization of the DNA amplification at 13q34 in human breast cancer reveals TFDP1 and CUL4A as likely candidate target genes. Breast Cancer Res. 2009;11:R86. doi: 10.1186/bcr2456. [DOI] [PMC free article] [PubMed] [Google Scholar]
- Miranda-Carboni GA, Krum SA, Yee K, Nava M, Deng QE, Pervin S, Collado-Hidalgo A, Galic Z, Zack JA, Nakayama K, Nakayama KI, Lane TF. A functional link between Wnt signaling and SKP2-independent p27 turnover in mammary tumors. Genes Dev. 2008;22:3121–3134. doi: 10.1101/gad.1692808. [DOI] [PMC free article] [PubMed] [Google Scholar]
- Moss AC, Lawlor G, Murray D, Tighe D, Madden SF, Mulligan AM, Keane CO, Brady HR, Doran PP, MacMathuna P. ETV4 and Myeov knockdown impairs colon cancer cell line proliferation and invasion. Biochem Biophys Res Commun. 2006;345:216–221. doi: 10.1016/j.bbrc.2006.04.094. [DOI] [PubMed] [Google Scholar]
- Newcomb PA, Baron J, Cotterchio M, Gallinger S, Grove J, Haile R, Hall D, Hopper JL, Jass J, Le Marchand L, Limburg P, Lindor N, Potter JD, Templeton AS, Thibodeau S, Seminara D. Colon Cancer Family Registry: an international resource for studies of the genetic epidemiology of colon cancer. Cancer Epidemiol Biomarkers Prev. 2007;16:2331–2343. doi: 10.1158/1055-9965.EPI-07-0648. [DOI] [PubMed] [Google Scholar]
- Olshen AB, Venkatraman ES, Lucito R, Wigler M. Circular binary segmentation for the analysis of array-based DNA copy number data. Biostatistics. 2004;5:557–572. doi: 10.1093/biostatistics/kxh008. [DOI] [PubMed] [Google Scholar]
- Paradiso A, Rabinovich M, Vallejo C, Machiavelli M, Romero A, Perez J, Lacava J, Cuevas MA, Rodriquez R, Leone B, Sapia MG, Simone G, De Lena M. p53 and PCNA expression in advanced colorectal cancer: response to chemotherapy and long-term prognosis. Int J Cancer. 1996;69:437–441. doi: 10.1002/(SICI)1097-0215(19961220)69:6<437::AID-IJC2>3.0.CO;2-5. [DOI] [PubMed] [Google Scholar]
- Popat S, Hubner R, Houlston RS. Systematic review of microsatellite instability and colorectal cancer prognosis. J Clin Oncol. 2005;23:609–618. doi: 10.1200/JCO.2005.01.086. [DOI] [PubMed] [Google Scholar]
- Powell SM, Zilz N, Beazer-Barclay Y, Bryan TM, Hamilton SR, Thibodeau SN, Vogelstein B, Kinzler KW. APC mutations occur early during colorectal tumorigenesis. Nature. 1992;359:235–237. doi: 10.1038/359235a0. [DOI] [PubMed] [Google Scholar]
- Press MF, Slamon DJ, Flom KJ, Park J, Zhou JY, Bernstein L. Evaluation of HER-2/neu gene amplification and overexpression: comparison of frequently used assay methods in a molecularly characterized cohort of breast cancer specimens. J Clin Oncol. 2002;20:3095–3105. doi: 10.1200/JCO.2002.09.094. [DOI] [PubMed] [Google Scholar]
- Reid JF, Gariboldi M, Sokolova V, Capobianco P, Lampis A, Perrone F, Signoroni S, Costa A, Leo E, Pilotti S, Pierotti MA. Integrative approach for prioritizing cancer genes in sporadic colon cancer. Genes Chromosomes Cancer. 2009;48:953–962. doi: 10.1002/gcc.20697. [DOI] [PubMed] [Google Scholar]
- Ried T, Knutzen R, Steinbeck R, Blegen H, Schrock E, Heselmeyer K, du Manoir S, Auer G. Comparative genomic hybridization reveals a specific pattern of chromosomal gains and losses during the genesis of colorectal tumors. Genes Chromosomes Cancer. 1996;15:234–245. doi: 10.1002/(SICI)1098-2264(199604)15:4<234::AID-GCC5>3.0.CO;2-2. [DOI] [PubMed] [Google Scholar]
- Rowan A, Halford S, Gaasenbeek M, Kemp Z, Sieber O, Volikos E, Douglas E, Fiegler H, Carter N, Talbot I, Silver A, Tomlinson I. Refining molecular analysis in the pathways of colorectal carcinogenesis. Clin Gastroenterol Hepatol. 2005;3:1115–1123. doi: 10.1016/s1542-3565(05)00618-x. [DOI] [PubMed] [Google Scholar]
- Schimmelpenning H, Eriksson ET, Franzen B, Zetterberg A, Auer GU. Prognostic value of the combined assessment of proliferating cell nuclear antigen immunostaining and nuclear DNA content in invasive human mammary carcinomas. Virchows Arch A Pathol Anat Histopathol. 1993;423:273–279. doi: 10.1007/BF01606890. [DOI] [PubMed] [Google Scholar]
- Seute A, Sinn HP, Schlenk RF, Emig R, Wallwiener D, Grischke EM, Hohaus S, Dohner H, Haas R, Bentz M. Clinical relevance of genomic aberrations in homogeneously treated high-risk stage II/III breast cancer patients. Int J Cancer. 2001;93:80–84. doi: 10.1002/ijc.1296. [DOI] [PubMed] [Google Scholar]
- Sheffer M, Bacolod MD, Zuk O, Giardina SF, Pincas H, Barany F, Paty PB, Gerald WL, Notterman DA, Domany E. Association of survival and disease progression with chromosomal instability: a genomic exploration of colorectal cancer. Proc Natl Acad Sci U S A. 2009;106:7131–7136. doi: 10.1073/pnas.0902232106. [DOI] [PMC free article] [PubMed] [Google Scholar]
- Sillars-Hardebol AH, Carvalho B, Tijssen M, Belien JA, de Wit M, Delis-van Diemen PM, Ponten F, van de Wiel MA, Fijneman RJ, Meijer GA. TPX2 and AURKA promote 20q amplicon-driven colorectal adenoma to carcinoma progression. Gut. 2012;61:1568–1575. doi: 10.1136/gutjnl-2011-301153. [DOI] [PubMed] [Google Scholar]
- Singh AB, Sharma A, Smith JJ, Krishnan M, Chen X, Eschrich S, Washington MK, Yeatman TJ, Beauchamp RD, Dhawan P. Claudin-1 up-regulates the repressor ZEB-1 to inhibit E-cadherin expression in colon cancer cells. Gastroenterology. 2011;141:2140–2153. doi: 10.1053/j.gastro.2011.08.038. [DOI] [PMC free article] [PubMed] [Google Scholar]
- Slamon DJ, Clark GM, Wong SG, Levin WJ, Ullrich A, McGuire WL. Human breast cancer: correlation of relapse and survival with amplification of the HER-2/neu oncogene. Science. 1987;235:177–182. doi: 10.1126/science.3798106. [DOI] [PubMed] [Google Scholar]
- Slamon DJ, Godolphin W, Jones LA, Holt JA, Wong SG, Keith DE, Levin WJ, Stuart SG, Udove J, Ullrich A, et al. Studies of the HER-2/neu proto-oncogene in human breast and ovarian cancer. Science. 1989;244:707–712. doi: 10.1126/science.2470152. [DOI] [PubMed] [Google Scholar]
- Soh J, Okumura N, Lockwood WW, Yamamoto H, Shigematsu H, Zhang W, Chari R, Shames DS, Tang X, MacAulay C, Varella-Garcia M, Vooder T, Wistuba II, Lam S, Brekken R, Toyooka S, Minna JD, Lam WL, Gazdar AF. Oncogene mutations, copy number gains and mutant allele specific imbalance (MASI) frequently occur together in tumor cells. PLoS One. 2009;4:e7464. doi: 10.1371/journal.pone.0007464. [DOI] [PMC free article] [PubMed] [Google Scholar]
- Staaf J, Jonsson G, Ringner M, Vallon-Christersson J, Grabau D, Arason A, Gunnarsson H, Agnarsson BA, Malmstrom PO, Johannsson OT, Loman N, Barkardottir RB, Borg A. High-resolution genomic and expression analyses of copy number alterations in HER2-amplified breast cancer. Breast Cancer Res. 2010;12:R25. doi: 10.1186/bcr2568. [DOI] [PMC free article] [PubMed] [Google Scholar]
- Stahl M, Uemura K, Ge C, Shi S, Tashima Y, Stanley P. Roles of Pofut1 and O-fucose in mammalian Notch signaling. J Biol Chem. 2008;283:13638–13651. doi: 10.1074/jbc.M802027200. [DOI] [PMC free article] [PubMed] [Google Scholar]
- Stoimenov I, Helleday T. PCNA on the crossroad of cancer. Biochem Soc Trans. 2009;37:605–613. doi: 10.1042/BST0370605. [DOI] [PubMed] [Google Scholar]
- The-Cancer-Genome-Atlas-Network. Comprehensive molecular characterization of human colon and rectal cancer. Nature. 2012;487:330–337. doi: 10.1038/nature11252. [DOI] [PMC free article] [PubMed] [Google Scholar]
- Thibodeau SN, French AJ, Cunningham JM, Tester D, Burgart LJ, Roche PC, McDonnell SK, Schaid DJ, Vockley CW, Michels VV, Farr GH, Jr, O'Connell MJ. Microsatellite instability in colorectal cancer: different mutator phenotypes and the principal involvement of hMLH1. Cancer Res. 1998;58:1713–1718. [PubMed] [Google Scholar]
- Tiwari RK, Borgen PI, Wong GY, Cordon-Cardo C, Osborne MP. HER-2/neu amplification and overexpression in primary human breast cancer is associated with early metastasis. Anticancer Res. 1992;12:419–425. [PubMed] [Google Scholar]
- Trautmann K, Terdiman JP, French AJ, Roydasgupta R, Sein N, Kakar S, Fridlyand J, Snijders AM, Albertson DG, Thibodeau SN, Waldman FM. Chromosomal instability in microsatellite-unstable and stable colon cancer. Clin Cancer Res. 2006;12:6379–6385. doi: 10.1158/1078-0432.CCR-06-1248. [DOI] [PubMed] [Google Scholar]
- Tsafrir D, Bacolod M, Selvanayagam Z, Tsafrir I, Shia J, Zeng Z, Liu H, Krier C, Stengel RF, Barany F, Gerald WL, Paty PB, Domany E, Notterman DA. Relationship of gene expression and chromosomal abnormalities in colorectal cancer. Cancer Res. 2006;66:2129–2137. doi: 10.1158/0008-5472.CAN-05-2569. [DOI] [PubMed] [Google Scholar]
- Tuna M, Knuutila S, Mills GB. Uniparental disomy in cancer. Trends Mol Med. 2009;15:120–128. doi: 10.1016/j.molmed.2009.01.005. [DOI] [PubMed] [Google Scholar]
- Walia V, Ding M, Kumar S, Nie D, Premkumar LS, Elble RC. hCLCA2 Is a p53-Inducible Inhibitor of Breast Cancer Cell Proliferation. Cancer Res. 2009;69:6624–6632. doi: 10.1158/0008-5472.CAN-08-4101. [DOI] [PMC free article] [PubMed] [Google Scholar]
- Weisenberger DJ, Siegmund KD, Campan M, Young J, Long TI, Faasse MA, Kang GH, Widschwendter M, Weener D, Buchanan D, Koh H, Simms L, Barker M, Leggett B, Levine J, Kim M, French AJ, Thibodeau SN, Jass J, Haile R, Laird PW. CpG island methylator phenotype underlies sporadic microsatellite instability and is tightly associated with BRAF mutation in colorectal cancer. Nat Genet. 2006;38:787–793. doi: 10.1038/ng1834. [DOI] [PubMed] [Google Scholar]
- Westermarck J, Hahn WC. Multiple pathways regulated by the tumor suppressor PP2A in transformation. Trends Mol Med. 2008;14:152–160. doi: 10.1016/j.molmed.2008.02.001. [DOI] [PubMed] [Google Scholar]
- Yan Y, Zhang X, Legerski RJ. Artemis interacts with the Cul4A-DDB1 (DDB2) ubiquitin E3 ligase and regulates degradation of the CDK inhibitor p27. Cell Cycle. 2011;10:4098–4109. doi: 10.4161/cc.10.23.18227. [DOI] [PMC free article] [PubMed] [Google Scholar]
- Yao D, Huang Y, Huang X, Wang W, Yan Q, Wei L, Xin W, Gerson S, Stanley P, Lowe JB, Zhou L. Protein O-fucosyltransferase 1 (Pofut1) regulates lymphoid and myeloid homeostasis through modulation of Notch receptor ligand interactions. Blood. 2011;117:5652–5662. doi: 10.1182/blood-2010-12-326074. [DOI] [PMC free article] [PubMed] [Google Scholar]
- Zou W, Yang Y, Wu Y, Sun L, Chi Y, Wu W, Yun X, Xie J, Gu J. Negative role of trihydrophobin 1 in breast cancer growth and migration. Cancer Sci. 2010;101:2156–2162. doi: 10.1111/j.1349-7006.2010.01656.x. [DOI] [PMC free article] [PubMed] [Google Scholar]
- Zuern C, Heimrich J, Kaufmann R, Richter KK, Settmacher U, Wanner C, Galle J, Seibold S. Down-regulation of MTUS1 in human colon tumors. Oncol Rep. 2009;23:183–189. [PubMed] [Google Scholar]
Associated Data
This section collects any data citations, data availability statements, or supplementary materials included in this article.
Supplementary Materials
Supplemental Data Figure 1. Genes differentially expressed in signaling pathways involved in cancer. Genes in multiple signaling pathways involved in the mechanisms of cancer are indicated by red or green shading (red for up-regulated and green for down-regulated). The fold-change expression levels in tumor versus adjacent normal tissue are represented by the intensity of shading.