Abstract
While it is generally accepted that ruptures in fibrous cap atheromas cause most acute coronary deaths, and that plaque rupture occurs in the fibrous cap at the location where the tissue stress exceeds a certain critical peak circumferential stress, the exact mechanism of rupture initiation remains unclear. We recently reported the presence of multiple microcalcifications (μCalcs) < 50μm diameter embedded within the fibrous cap, μCalcs that could greatly increase cap instability by introducing up to a 5-fold increase in local tissue stress. Here, we explore the hypothesis that, aside from cap thickness, μCalc size and interparticle spacing are principal determinants of cap rupture risk. Also, we propose that cap rupture is initiated near the poles of the μCalcs due to the presence of tiny voids that explosively grow at a critical tissue stress and then propagate across the fibrous cap. We develop a theoretical model based on classic studies in polymeric materials by Gent (1980), which indicates that cavitation as opposed to interfacial debonding is the more likely mechanism for cap rupture produced by μCalcs < 65μm diameter. This analysis suggests that there is a critical μCalc size range, from 5μm to 65μm, in which cavitation should be prevalent. This hypothesis for cap rupture is strongly supported by our latest μCT studies in which we have observed trapped voids in the vicinity of μCalcs within fibrous caps in human coronaries.
Keywords: cavitation, vulnerable plaque, microcalcifications, fibrous cap rupture
Introduction
Most acute coronary deaths are caused by the rupture of a fibrous cap atheroma, a complex biomechanical phenomenon, not yet fully understood. The most widely accepted factor for increasing cap vulnerability is the thickness of the fibrous cap overlying the necrotic core (Burke et al., 1997). Necrotic core size, tissue composition and mechanical properties of the cap have also been recognized to play a role in plaque vulnerability (Ohayon et al., 2008). However, finite element analysis (FEA) has shown that individually these latter factors lead to only a 20 to 30 percent increase in local tissue stress (Maldonado et al., 2012) and are unlikely to elevate the tissue stress in the cap above the minimum rupture threshold of 300kPa proposed by Cheng et al., (1993). Furthermore, almost half of observed ruptures occur in the center of the cap (Maehara et al., 2002), or in thick caps (Tanaka et al., 2008), where 3D FEA (Maldonado et al., 2012) and fluid-structure-interaction calculations (Rambhia et al., 2012) predict tissue stresses significantly lower than 300kPa. These observations suggest that other unforeseen factors may play an important role.
Although coronary calcification is clinically related to poor prognosis and is used as a marker of the advancement of the disease, it has not been successfully correlated with plaque rupture (Thilo et al., 2010). Key to understanding the role of calcified tissue in plaque stability was the study by Vengrenyuk et al., (2006), in which the counterintuitive idea that microcalcifications (μCalcs) embedded in the fibrous cap proper, lying below the resolution of current in vivo imaging techniques, could greatly increase cap instability by introducing a 2-fold increase in local tissue stress.
High resolution micro computed tomography (HR-μCT) was successfully used to provide the first evidence of the existence of such μCalcs in the human fibrous cap (Vengrenyuk et al., 2006), and later confirmed in a much larger set of samples (Maldonado et al., 2012) where 81 μCalcs < 60μm diameter were analyzed using 3D finite element analysis (FEA). This study revealed that closely spaced μCalcs could increase local tissue stresses by a factor of five. However, little is known about the exact mechanism of cap rupture.
In this study, we propose that cap rupture is initiated near the μCalcs when the fibrous cap is subject to tensile stresses that exceed a critical value, wherein tiny precursor voids (minute bubbles) greatly expand due to large tensions generated in vicinity of a μCalc (henceforth called cavitation), or where the fibrous tissue detaches from the μCalc surface initiated by a small initial separation (debonding). Cavitation in a hyperelastic solid differs from cavitation in a fluid in which bubbles will grow when subjected to pressures at or below their vapor pressure.
Based on the study by Gent (1980) for spherical beads in polymeric materials, we develop herein theoretical models to investigate this cavitation/debonding cap failure hypothesis by considering the local elastic adhesion energy released when debonding at the μCalc surface occurs or when cavitation is initiated in the tissue itself if the cap critical yield stress is exceeded. We also investigate the effect of the μCalc size and spacing between multiple μCalcs on peak cap stress using FEA and HR-μCT. Human coronary atheromas in which caps with μCalcs were previously detected using HR-μCT (Maldonado et al., 2012) are analyzed herein to obtain insight into the cap rupture initiation process.
Theoretical Model
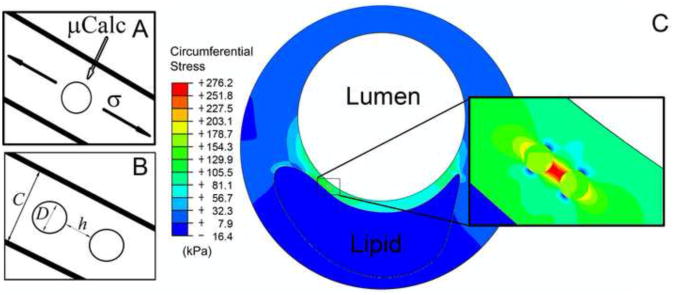
Our idealized mathematical model consists of a typical fibroatheroma where one or more spherical μCalcs are embedded in the fibrous cap as shown in Figs. 1 and 2. Blood pressure is applied in the lumen to deform the artery and create a tensile stress in the cap, which is calculated as the σ22 component of the Cauchy stress tensor. μCalcs are assumed to be rigid spherical particles and the fibrous cap is assumed to have incompressible hyperelastic material properties (Holzapfel, 2000), such that the Cauchy stress tensor,
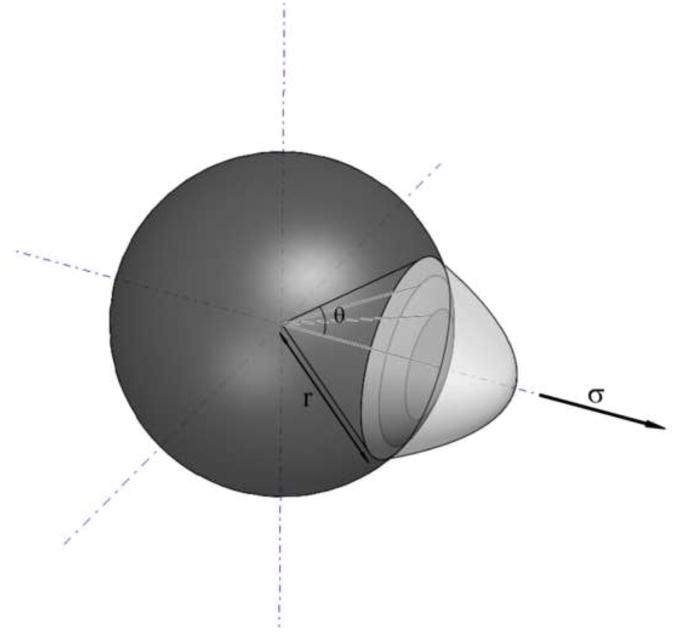
Figure 1.
Sketch of a spherical μCalc where debonding is occurring at the pole.
Figure 2.
A) Schematic of a fibrous cap under tension with a μCalc embedded in the cap. B) with two embedded μCalcs. C) Finite element analysis results showing a large stress concentration in the fibrous cap between two embedded μCalcs.
| [1a] |
In Eq. [1a], F is the deformation gradient, Ψ is the strain energy, and p is an arbitrary pressure-like scalar. Simplifying [1a] for a Neo-Hookean, isotropic and homogeneous solid
| [1b] |
| [1c] |
where W is the strain energy density, I1 is the first strain invariant, μ is the shear modulus, ν the Poisson's ratio, and Et is the Young's elastic modulus of the soft tissue. Assuming ν ≈ 0.5, one finds from [1c] that C ≈ Et/6 (Ohayon et al. 2007).
Two failure modes have been previously described by Gent in layers of hyperelastic materials with rigid spherical inclusions: cavitation and debonding (Gent and Park, 1984). Based on the theoretical model initially developed for the study of reinforced polymers (Gent and Lindley, 1958; Gent and Tompkins, 1969; Gent, 1980; and Gent and Cho, 1984), we studied the failure mode of a hyperelastic fibrous cap with embedded μCalcs. Since the presence of a μCalc introduces local stress concentrations in a cap under tension, elastic energy is stored in the vicinity of the μCalc. Both cavitation and debonding lead to the release of this stored energy. The preferential mode of failure and the magnitude of the stored energy are determined by the size of the μCalc, the strength of the bond between the μCalc and the tissue and their respective Young's modulus of elasticity.
Debonding mechanism
A very small initially debonded area is assumed to grow in accordance with Griffith's criterion when the stored strain energy is greater than the energy required for debonding. From Gent (1980), the minimum applied stress necessary to cause debonding, σd, at the interface of a μCalc at its tensile pole is
| [2] |
where Ga is the bond fracture energy per unit area of bonded surface, r is the radius of the μCalc and θ is the initial debonding angle (see Figure 1; parameter values in Table 1). When the μCalc is a sphere, k has a value of 2.
Table 1. Variables used in the theoretical model and FEM.
| Inputs | Values | Units | |
|---|---|---|---|
| λ | Extension ratio of the void | 1 to ∞ | |
| γ | Surface energy | 25 | erg/cm2 |
| θ | Initially debonded angle | 1 to 5 | ° |
| h | Distance between μCalcs | 1 to100 | μm |
| D | Diameter of the μCalcs | 1 to 200 | μm |
| c | Cap thickness | 70 and 140 | μm |
| r | Radius of the μCalc | 1 to 100 | μm |
| a | Initial radius of the void | r/10 | μm |
| Ga | Bond strength | 0.2 to 1 | J/m2 |
| Outputs | |||
| σc | Cavitation threshold | kPa | |
| σd | Debonding threshold | kPa |
Cavitation mechanism
If we assume a fibrous cap under tension containing an extremely small spherical void, the pressure, Pm, within the void acting on the tissue takes the form (Gent and Lindley, 1958)
| [3] |
where λ is the extension ratio of the void. As the void grows and λ ≫ 1, Pm approaches the limiting value 5/6 Et, causing catastrophic rupture of the tissue layer. The presence of a void as a free surface in the tissue, creates a surface tension γ that opposes to the growth of the cavity, and if the initial void is assumed to be very small, of radius a=r/10, this energy is not negligible Gent et.al, 1969, 1980). The local tissue stress σc for a small void to grow is given by
| [4] |
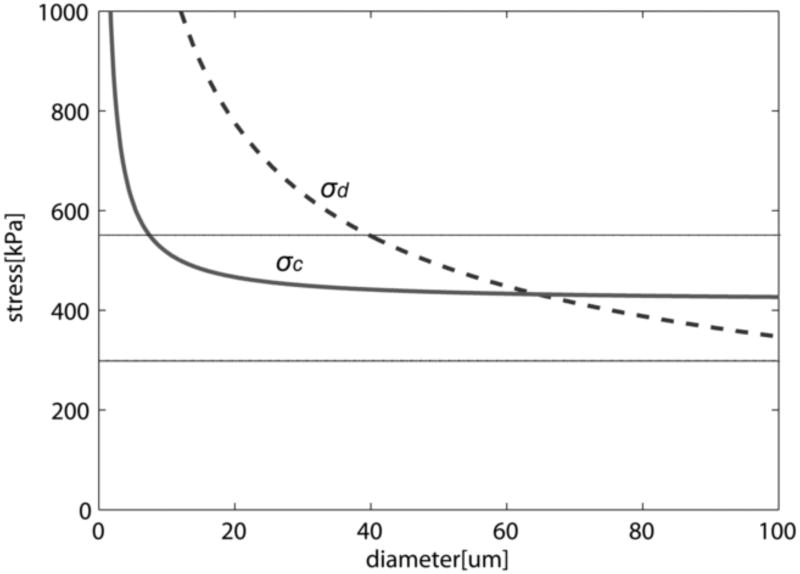
Equations 2 and 4 determine which mode of failure will occur. σc represents the minimum tissue stress required to induce cavitation. Any larger local tissue stress would trigger the unbounded growth of the void in the tissue itself, while σd is the minimum tissue stress required to start debonding of the tissue at the tensile pole of the μCalc starting as a small separation void of prescribed initial debonding angle at the interface. Thus, if σc < σd then cavitation in the tissue will occur before interfacial debonding; if σc > σd then the failure mode will be interfacial debonding. The limiting behavior for cavitation, Pm = 5Et/6, is approached when the void is large enough to neglect its surface energy for expansion.
Materials and Methods
To analyze the effect of diameter D, gap width between μCalcs h, and cap thickness c, we applied FEA assuming the presence of either a single or 2 spherical μCalcs in the fibrous cap of a representative atheroma geometry shown in Figure 2. We quantified the peak circumferential stress (PCS) concentration for different values of h/D from 0.1 to 2, representative of the particle spacing's observed in Maldonado et al., (2012). In these calculations the lumen is 2mm diameter, cap thickness is either 70 or 140μm and the μCalcs are located in the thinnest area of the cap. In total, 50 simulations were done, in which the diameter of μCalcs, D, varied from 10 to 50μm.
Two-dimensional FEA was applied in the cross-section of the μCalcs assuming that this plane was transverse to the axis of the vessel. The calculation was performed using ABAQUS (V.6.10 Simulia, Providence, RI). A quadratic triangular mesh was created and material properties were then assigned using an incompressible neo-Hookean isotropic model. The value of Young's modulus of the lipid core was prescribed to be Elipid = 5kPa, the soft tissue Et = 500kPa and the Ecalc = 10GPa (Ohayon et al., 2008, Akyildiz et al., 2011). A submodeling technique described in Vengrenyuk et al., (2008) was adapted for the 2D section in Figure 2 with approximately 0.1μm element edge length around the μCalcs. At the lumen of the artery a pressure of 110 mmHg (14.6kPa) was applied.
The mechanism of rupture, either cavitation or interfacial debonding, depends on the μCalc size, void diameter and the PCS produced either at the poles of the inclusion or in the tissue gap between μCalcs. Both cavitation and debonding stress thresholds were analyzed as a function of the μCalc size. In applying equations 2 and 4, we prescribed debonding angles of θ = 1, 3, and 5°, surface energy γ = 25erg/cm2 (Gent and Tompkins, 1969), bond fracture energy Ga = 0.2 to 1J/m2 (Wenk et al., 2010) and a void diameter scaled to one-tenth the μCalc size, a=r/10.
Results
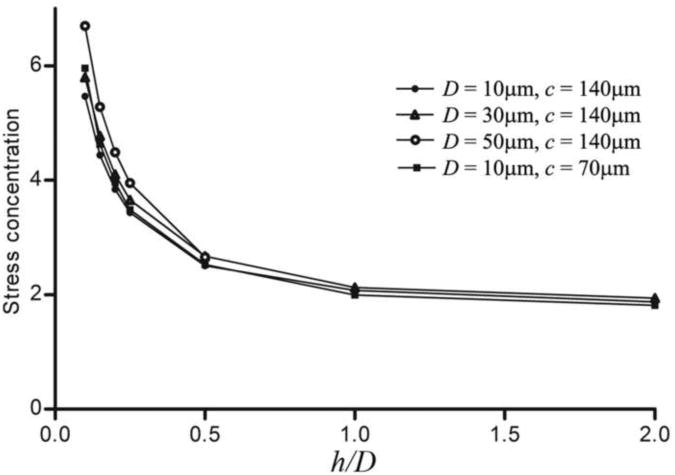
The effect on stress distribution of a μCalc in a fibrous cap has been previously studied, revealing a two-fold increase in stress at the tensile poles of a single isolated near-spherical μCalc in the cap rendering the cap more vulnerable to rupture (Vengrenyuk et al., 2006, 2008; Rambhia et al., 2012). However, in our more recent comprehensive HR-μCT study (Maldonado et al., 2012), 81 μCalcs were analyzed in 9 different fibrous caps, revealing that multiple μCalcs can be embedded in a single fibrous cap. In the latter study 9 ± 5 μCalcs were observed per cap, with a size range D = 28 ± 13μm, including a number of μCalcs that were in close proximity to one another (h/D < 1). For these values of h/D the calculated PCS could be up to 5 times that of the background stress. This recent observation suggested that the size D, and gap width h between μCalcs, could greatly increase the magnitude of the stress field, resulting in an increased cap rupture risk. Our present results indicate that μCalcs in close proximity can magnify peak tissue stresses by a factor of 6 when h/D is 0.1, a result almost independent of cap thickness (Figure 3). The largest increase in tissue stress would occur in the gap between the two particles, presumably, the rupture initiation site. Note that the stress concentration approaches 2 when h/D > 1, a result that is nearly the same as for a single μCalc.
Figure 3.
A) FEA results for stress concentrations between 2 μCalcs along the tensile axis. Stress concentration increases when distance between particles is reduced, and tends to a two fold increase when h > D, as calculated for isolated μCalcs in the fibrous cap.
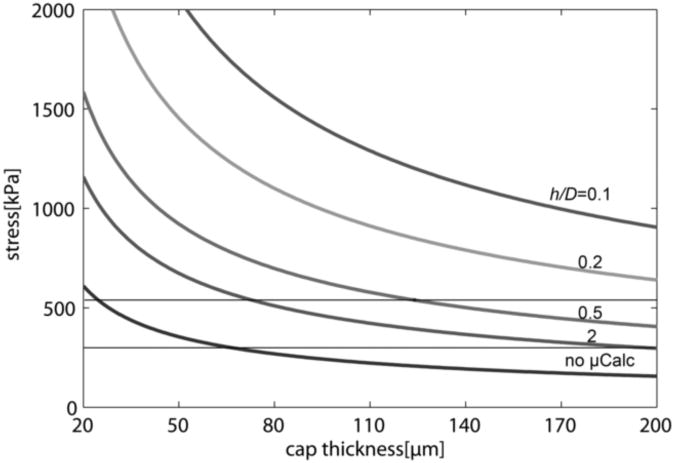
The typical PCS as a function of cap thickness for representative values of h/D is presented in Figure 4. Note that if no μCalcs were present, the cap thickness would have to be 65 μm or less to exceed the widely used minimum rupture threshold of 300kPa, and about 30μm or less to exceed the average rupture threshold of 545kPa. The predictions in Figure 4 are based on 2D FEA and are consistent with the predictions in Cheng et al., (1993) and Finet et al., (2004) when no μCals are present. However, 3D FEA in Ohayon et al., (2005) and Maldonado et al., (2012) indicates that 2D simulations substantially overestimate PCS and, therefore the cap thickness associated with the 300kPa minimum cap rupture threshold in 3D FEA simulations could be less than half the thickness obtained in 2D simulations. Importantly, this result implies that non-ruptured caps as thin as 30μm should be frequently observed in HR-μCT and histology, but only non-ruptured caps with thickness greater than 66μm were found in the 62 fibrous cap lesions observed in Maldonado et al. (2012). The rupture of caps with thickness >30μm where no μCalcs are present is unlikely; however, our results demonstrate that caps that contain μCalcs with h/D < 2 can increase the PCS above the rupture threshold of 300kPa in fibrous caps as thick as 180μm, suggesting that caps with μCalcs could have ruptured even if their thickness alone was insufficient to develop the necessary rupture stresses.
Figure 4.
Typical PCS vs. cap thickness considering the precesence of 2 μCalcs for representative h/D.
The two possible mechanisms for cap rupture, cavitation and interfacial debonding, are compared in Figure 5. For a small void of radius a = r/10, σc < σd for μCalcs with D < 65μm. Since μCalcs are defined in Maldonado et al., (2012) as calcifications < 50μm, in most cases the cavitation threshold would be reached before debonding at the interface of the μCalc, causing the catastrophic growth of the void and rupture of the fibrous cap.
Figure 5.
Calculated cavitation and debonding stress threshold vs. diameter of μCalc (θ = 5°, Ga = 0.5 J/m2). Figure shows that for μCalcs < 65μm σc < σd, and cavitation should be the preferential mode of failure (rupture of the fibrous cap), and for very small calcifications D < 5μm no cavitation nor debonding would occur. Solid horizontal lines indicate minimum and average rupture thresholds 300kPa and 545kPa (Cheng et al. 1993).
Figure 5 shows that for calcifications with D > 65μm, when θ = 5° and Ga = 0.5 J/m2, interfacial debonding would be the mode of failure, although these larger calcifications are rarely present in fibrous caps (the largest of the 81 μCalcs observed in the fibrous caps in Maldonado et al., (2012) was 60μm). For very small μCalcs where D < 5μm, σc > 545kPa; this large increase in σc, is due to the large surface energy of the void if it decreases in size as the μCalcs become smaller. Cavitation is unlikely to occur if this is the case since the surface energy term in equation 4 becomes dominant. Cavitation in the tissue is therefore likely to be the mode of failure for μCalcs between 5 μm and 65 μm for a void that is initially 10 times smaller than the μCalc. For μCalcs > 20μm, σc is nearly uniform and has a value of 416kPa (Figure 5). This value lies between the minimum rupture threshold (300kPa) and average rupture threshold (545kPa) observed to occur in Cheng et al., (1993), as first pointed out in Maldonado et al., (2012).
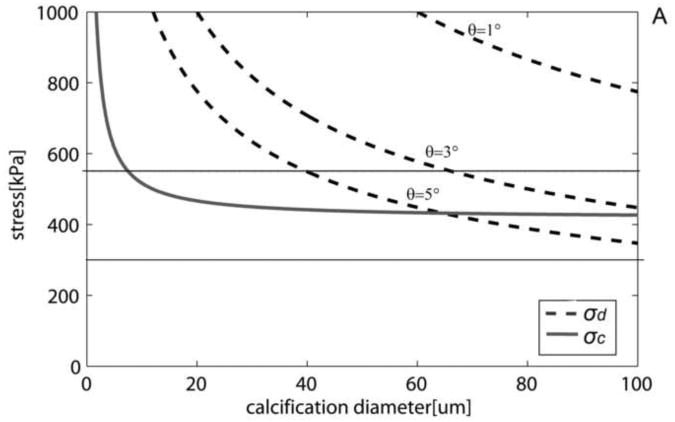
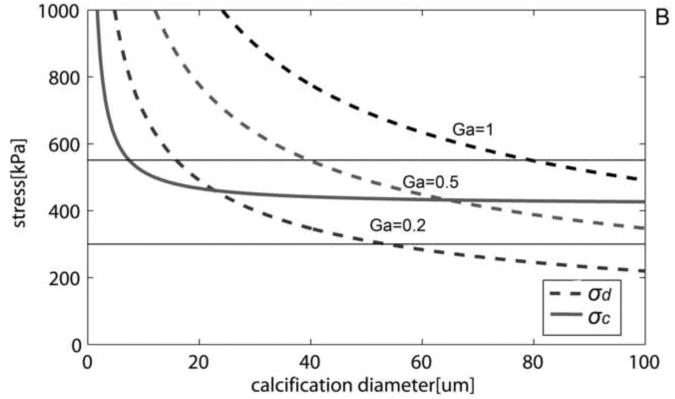
Both cavitation and debonding occur abruptly: in equation 2 for debonding, once the PCS reaches σd, the debonded area will grow abruptly, because the stress required to further debond decreases as the debonded area increases (Figure 6A). Note that for a μCalc with D = 40μm, if initially θ = 3°, σd the is 700kPa, Thus, once this threshold is reached debonding will be initiated and θ will grow, say to θ = 5°, where σd has now decreased to 545kPa. This decrease in σd allows the debonding process to continue as θ increases. For cavitation, any stress larger than σc initiates void growth, and the void will grow unbounded as its surface energy decreases until the local tissue stress falls below the minimum threshold. In the case of debonding once the entire surface of the μCalc is debonded from the tissue, the propagation of the rupture through the fibrous cap requires further tension. In the case of cavitation, as previously shown to occur in polymers (Gent and Park, 1984), the stress concentration between inclusions would lead to a cavitation process where the void grows at a right angle to the applied tension, propagating across the fibrous cap. Figure 6B shows the influence on the debonding threshold of the bond strength Ga between a μCalc and the fibrous cap. Values vary from a theoretical weak bond Ga = 0.2 to a strong bond Ga = 1. For Ga = 0.2 interfacial debonding would occur if D > 23μm, whereas for Ga = 0.5 the μCalc would have to be > 65μm.
Figure 6.
Cavitation and debonding thresholds vs. μCalc diameter. A) Shows how increasing the initially debonded area increases the likelihood of debonding.(Ga = 0.5J/m2). B) Thresholds for different bond strengths (θ= 5°). Solid horizontal lines indicate minimum and average rupture thresholds 300kP and 545kPa (Cheng et al. 1993).
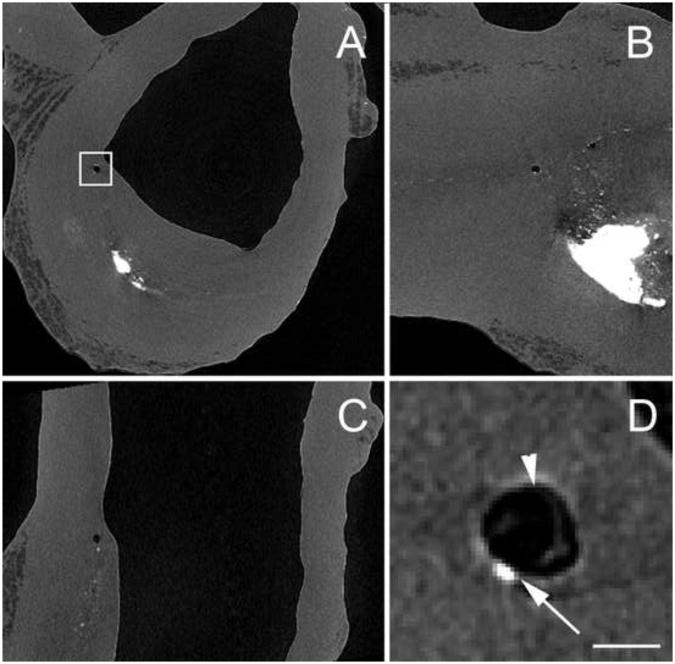
The HR-μCT images reported in Maldonado et al., (2012), revealed that in two of the nine fibroatheromas a void was present in the immediate vicinity of μCalcs contained within the cap itself, providing compelling experimental evidence for the growth of a void bubble in close proximity to the soft tissue/μCalc interface. Figure 7 show HR-μCT views of a human coronary where this void, likely due to a cavitation process, was detected. Note void bubble has grown to nearly 120 µm before stabilizing and is much larger than the µCalc which caused it. These voids were observed in thick caps where the bubble did not have enough energy to break through to the cap surface.
Figure 7.
HR-μCT images at 2.1μm resolution showing a bubble in a fibrous cap in the vicinity of μCalcs. Dark area corresponds to air, gray to soft tissue and bright areas are calcifications. A) Transverse view, B) axial view, and C) longitudinal view of the blood vessel. D) Magnified view of square region shown in A. Arrow indicates μCalc and arrow head shows void near it. (Scale bar is 100μm)
Discussion
The importance of μCalcs in the vulnerability of fibrous cap rupture, first hypothesized by Vengrenyuk et al., (2006) has been recently highlighted in several computational papers (Vengrenyuk et al., 2008; Rambhia et al., 2012; Wenk et al., 2010; Maldonado et al., 2012), mainly addressing the stress concentrations introduced by their presence in the fibrous cap, and providing a plausible explanation for ruptures in regions such as the center of the cap (Maehara et al., 2002), where previous models not considering μCalcs failed to detect tissue stress concentrations.
Whereas we had recently reported the presence of μCalcs at the exact location of tearing in a ruptured cap (Maldonado et al., 2012), Figure 7 is a major breakthrough in our understanding of the fibrous cap rupture mechanism. The high contrast provided by HR-μCT images, clearly shows the presence of voids in the fibrous cap proper, in close proximity with μCalcs. Both samples where this was detected have thick fibrous caps where the expansion of the void did not reach the lumenal surface, but expansion of such voids in thin caps would clearly lead directly to rupture.
The issue addressed in this study is the precise nature of the failure mechanism. Although it is widely accepted that regions of high circumferential stress are related to plaque rupture (Richardson et al., 1989), there are just a few studies which attempt to describe the rupture mechanism. In Vengrenyuk et al., (2006), rupture was hypothesized to start as interfacial debonding of calcified macrophages, and the model by Wenk et al., (2010) supports this hypothesis. The theoretical model presented herein points to cavitation in the tissue space between μCalcs as the more likely mechanism for cap rupture, except perhaps for large μCalcs (> 65μm, Ga = 0.5). This explains not only the presence of the voids in the fibrous cap shown in Figure 7, but also the formation of cavitation bubbles precisely in the tissue stress range commonly used as the threshold for rupture, 300kPa to 545kPa (Cheng et al., 1993).
The proposed model for rupture would also explain the experimental results of Hoshino et al., (2009). If large calcifications are under tension, debonding at the interface would occur. However, this is not the scenario usually observed in human atheromas, since in most cases large calcifications tend to form in the back of lipid pools and are not embedded in regions of high circumferential stress. Figures 5 and 6 show debonding is not likely to occur for μCalcs < 65μm unless the bond between the μCalc and the cap is weak, Ga < 0.5. Since the study of 81 μCalcs in Maldonado et al., (2012) reveals that nearly all μCalcs observed in fibrous caps are smaller than 65μm in diameter (D = 28±13μm), cavitation would be the rupture mechanism.
There are several recent reports of numerous very small μCalcs less than 1μm size (New and Aikawa, 2011; Roijers et al., 2011), presumably calcified matrix vesicles, which are present in the fibrous cap itself. Equations 2 and 4 show that these very small μCalcs are unlikely to cause either cavitation or debonding. This finding suggests a minimum critical size at which the μCalcs within the cap become dangerous. In particular Figures 5 and 6 show that such small μCalcs will be associated with very small voids ≤ 500nm and that the surface energy of these voids rises sharply as their size decreases preventing their explosive growth. This effect of very small inclusions has been widely used and studied in the reinforcement of polymers. Similarly, μCalcs < 5 μm should be stabilizing rather than destabilizing.
The present model provides a quantitative framework for assessing the effect of μCalc size and separation distance on void growth as the mechanism triggering cap rupture. It also provides plausible descriptions of the rupture mechanisms in the experimentally observed stress range of cap rupture in Cheng et al., (1993). This study also suggests a range of microcalcification size that is likely to increase plaque vulnerability, but that outside this range, μCalcs < 5 μm and > 65μm, should not be biomechanically dangerous. The predicted 2 to 5-fold increase in PCS due to closely spaced μCalcs suggests that detection and prevention of such μCalc development may have a clinical relevance as important as cap thickness in fibrous cap rupture. The recent paper by Liu et al., (2011) indicates that it might be possible in the near future to detect μCalcs as small as 5 μm in vivo using recently developed μOCT. Since the penetration of μOCT decays with depth this would be particularly useful for examining μCalcs near the surface of the lesion in the fibrous cap proper. Further studies of the characteristics of the bond between the μCalcs and the fibrous tissue are needed to better estimate parameters such as the bond strength Ga and the initial debonding angle of small surface voids.
Acknowledgments
This research has been supported by NIH ARRA grant RCI HL101151, AG034198 and NSF MRI 0723027.
Footnotes
Disclosures: None
Publisher's Disclaimer: This is a PDF file of an unedited manuscript that has been accepted for publication. As a service to our customers we are providing this early version of the manuscript. The manuscript will undergo copyediting, typesetting, and review of the resulting proof before it is published in its final citable form. Please note that during the production process errors may be discovered which could affect the content, and all legal disclaimers that apply to the journal pertain.
References
- Akyildiz AC, Speelman L, van Brummelen H, Gutiérrez MA, Virmani R, van der Lugt A, van der Steen AF, Wentzel JJ, Gijsen FJ. Effects of intima stiffness and plaque morphology on peak cap stress. Biomed Eng Online. 2011;10:25. doi: 10.1186/1475-925X-10-25. [DOI] [PMC free article] [PubMed] [Google Scholar]
- Burke AP, Farb A, Malcom GT, Liang YH, Smialek J, Virmani R. Coronary risk factors and plaque morphology in men with coronary disease who died suddenly. New England Journal of Medicine. 1997;336(18):1276–82. doi: 10.1056/NEJM199705013361802. [DOI] [PubMed] [Google Scholar]
- Cheng GC, Loree HM, Kamm RD, Fishbein MC, Lee RT. Distribution of circumferential stress in ruptured and stable atherosclerotic lesions. A structural analysis with histopathological correlation. Circulation. 1993;87(4):1179–87. doi: 10.1161/01.cir.87.4.1179. [DOI] [PubMed] [Google Scholar]
- Cho K, Gent AN. Cavitation in model elastomeric composites. Journal of Materials Science. 1988;23(1):141–144. [Google Scholar]
- Finet G, Ohayon J, Rioufol G. Biomechanical interaction between cap thickness, lipid core composition and blood pressure in vulnerable coronary plaque: impact on stability or instability. Coronary Artery Disease. 2004;15(1):13–20. doi: 10.1097/00019501-200402000-00003. [DOI] [PubMed] [Google Scholar]
- Gent AN, Lindley PB. Internal Rupture of Bonded Rubber Cylinders in Tension. Proceedings of the Royal Society of London Series A, Mathematical and Physical Sciences. 1958;249(1257):195–205. [Google Scholar]
- Gent AN, Tompkins DA. Nucleation and Growth of Gas Bubbles in Elastomers. Journal of Applied Physics. 1969;40:2520–2525. [Google Scholar]
- Gent AN. Detachment of an elastic matrix from a rigid spherical inclusion. Journal of Materials Science. 1980;15(11):2884–2888. [Google Scholar]
- Gent AN, Byoungkyeu Park. Failure processes in elastomers at or near a rigid spherical inclusion. Journal of Materials Science. 1984;19(6):1947–1956. [Google Scholar]
- Holzapfel GA. Nonlinear solid mechanics: a continuum approach for engineering. Chichester; New York: Wiley; 2000. [Google Scholar]
- Hoshino T, Chow LA, Hsu JJ, Perlowski AA, Abedin M, Tobis J, Tintut Y, Mal AK, Klug WS, Demer LL. Mechanical stress analysis of a rigid inclusion in distensible material: a model of atherosclerotic calcification and plaque vulnerability. American Journal Physiology Heart and Circulation Physiology. 2009 Aug;297(2):H802–10. doi: 10.1152/ajpheart.00318.2009. [DOI] [PMC free article] [PubMed] [Google Scholar]
- Liu L, Gardecki J, Nadkarni S, Toussaint J, Yagi Y, Bouma B, Tearney G. Imaging the subcellular structure of human coronary atherosclerosis using micro–optical coherence tomography. Nature Medicine. 2011;17:1010–1014. doi: 10.1038/nm.2409. [DOI] [PMC free article] [PubMed] [Google Scholar]
- Maehara A, Mintz GS, Bui AB, Walter OR, Castagna MT, Canos D, Pichard AD, Satler LF, Waksman R, Suddath WO, Laird JR, Kent KM, Weissman NJ. Morphologic and angiographic features of coronary plaque rupture detected by intravascular ultrasound. Journal of the American College of Cardiology. 2002;40(5):904–10. doi: 10.1016/s0735-1097(02)02047-8. [DOI] [PubMed] [Google Scholar]
- Maldonado N, Kelly-Arnold A, Vengrenyuk Y, Laudier D, Virmani R, Fallon JT, Cardoso L, Weinbaum S. A Mechanistic Analysis of the Role of Microcalcifications in Vulnerable Plaque Rupture. American Journal Physiology Heart and Circulation Physiology. 2012;303:H619–H628. doi: 10.1152/ajpheart.00036.2012. [DOI] [PMC free article] [PubMed] [Google Scholar]
- New SE, Aikawa E. Cardiovascular Calcification: An Inflammatory Disease. Circulation. 2011;75(6):1305–13. doi: 10.1253/circj.cj-11-0395. [DOI] [PubMed] [Google Scholar]
- Ohayon J, Finet G, Gharib AM, Herzka DA, Tracqui P, Heroux J, Rioufol G, Kotys MS, Elagha A, Pettigrew RI. Necrotic core thickness and positive arterial remodeling index: emergent biomechanical factors for evaluating the risk of plaque rupture. American Journal Physiology Heart and Circulation Physiology. 2008;295(2):H717–27. doi: 10.1152/ajpheart.00005.2008. [DOI] [PMC free article] [PubMed] [Google Scholar]
- Ohayon J, Dubreuil O, Tracqui P, Le Floc'h S, Rioufol G, Chalabreysse L, Thivolet F, Pettigrew RI, Finet G. Influence of residual stress/strain on the biomechanical stability of vulnerable coronary plaques: potential impact for evaluating the risk of plaque rupture. American Journal Physiology Heart and Circulation Physiology. 2007;293(3):H1987–96. doi: 10.1152/ajpheart.00018.2007. [DOI] [PubMed] [Google Scholar]
- Ohayon J, Finet G, Treyve F, Rioufol G, Dubreuil O. A three-dimensional finite element analysis of stress distribution in a coronary atherosclerotic plaque. Methods. 2005;661:225–241. [Google Scholar]
- Rambhia SH, Liang X, Xenos M, Alemu Y, Maldonado N, Kelly A, Weinbaum S, Cardoso L, Einav S, Bluestein D. Microcalcifications Increase Coronary Vulnerable Plaque Rupture Potential: A Patient-Based Micro-CT Fluid-Structure Interaction Study. Annals of Biomedical Engineering. 2012 Jul;40(7):1443–54. doi: 10.1007/s10439-012-0511-x. [DOI] [PubMed] [Google Scholar]
- Richardson P, Davies M, Born G. Influence of plaque configuration and stress distribution on fissuring of coronary atherosclerotic plaques. The Lancet. 1989;2(8669):941–4. doi: 10.1016/s0140-6736(89)90953-7. [DOI] [PubMed] [Google Scholar]
- Roijers R, Debernardi N, Cleutjens J, Schurgers L, Mutsaers P, van der Vusse G. Microcalcifications in early Intimal Lesions of Atherosclerotic Human Coronary Arteries. American Journal of Pathology. 2011;178(6):2879–87. doi: 10.1016/j.ajpath.2011.02.004. [DOI] [PMC free article] [PubMed] [Google Scholar]
- Tanaka A, Imanishi T, Kitabata H, Kubo T, Takarada S, Tanimoto T, Kuroi A, Tsujioka H, Ikejima H, Ueno S, Kataiwa H, Okouchi K, Kashiwaghi M, Matsumoto H, Takemoto K, Nakamura N, Hirata K, Mizukoshi M, Akasaka T. Morphology of exertion-triggered plaque rupture in patients with acute coronary syndrome: an optical coherence tomography study. Circulation. 2008;118(23):2368–73. doi: 10.1161/CIRCULATIONAHA.108.782540. [DOI] [PubMed] [Google Scholar]
- Thilo C, Gebregziabher M, Mayer F, Schoepf J. Correlation of regional distribution and morphological pattern of calcification. European Radiology. 2010;20(4):855–61. doi: 10.1007/s00330-009-1630-0. [DOI] [PubMed] [Google Scholar]
- Vengrenyuk Y, Cardoso L, Weinbaum S. Micro CT based Analysis of a new paradigm for vulnerable plaque rupture: Cellular Microcalcifications in Fibrous Caps. Molecular Cell Biomechanics. 2008;5:37–47. [PubMed] [Google Scholar]
- Vengrenyuk Y, Weinbaum S, Carlier S, Xanthos S, Cardoso L, Ganatos P, Virmani R, Einav S, Gilchrist L. A hypothesis for vulnerable plaque rupture due to stress-induced debonding around cellular microcalcifications in thin fibrous caps. PNAS. 2006;103:14678–14683. doi: 10.1073/pnas.0606310103. [DOI] [PMC free article] [PubMed] [Google Scholar]
- Wenk JF, Papadopoulos P, Zohdi TI. Numerical modeling of stress in stenotic arteries with microcalcifications: a micromechanical approximation. Journal of Biomechanical Engineering. 2010;132(9):091011. doi: 10.1115/1.4001351. [DOI] [PubMed] [Google Scholar]


